MASTER THESIS. UAS sensitivity to wake turbulence for establishing safety distance requirements. Clàudia Máñez Alonso SUPERVISED BY.
|
|
|
- Jacob Atkinson
- 5 years ago
- Views:
Transcription

1 MASTER THESIS UAS sensitivity to wake turbulence for establishing safety distance requirements Clàudia Máñez Alonso SUPERVISED BY Pablo Royo Chic Universitat Politècnica de Catalunya Master in Aerospace Science & Technology September 2014
2 This Page Intentionally Left Blank
3 UAS sensitivity to wake turbulence for establishing safety distance requirements BY Clàudia Máñez Alonso DIPLOMA THESIS FOR DEGREE Master in Aerospace Science and Technology AT Universitat Politècnica de Catalunya SUPERVISED BY: Pablo Royo Chic Department of Computer Architecture
4 This Page Intentionally Left Blank
5 PREFACE AND ACKNOWLEDGMENT Along all these months which has taken me to perform my thesis, I have to appreciate to everyone who has spent a few minutes to help me and who has supported me since I started this thesis, which has not been really easy to carry out. Firstly, I have to thanks to the ICARUS Research Project Team for letting me use its laboratory in order to do my thesis and for helping me in those moments in which I was completely lost. Secondly, I have to thanks to Xavier Arteaga because his aid has been really helpful for me and for letting me use some Matlab files which have been really useful. And, finally, I have to thanks to Manuel Amaro for helping and supporting me and spending part of his free time to answer me any doubt of Matlab.
6 NOMENCLATURE Acronym WVE RVSM FAA ICAO FL Rad deg ft m mi NM ATC ATCO VFR IFR ATM ATFM FL UAV UAS UA RPAS AOW RW AZ ROD EDR BVF CS Definition Wake Vortex Encounter Reduced Vertical Separation Minimal Federal Aviation Authorities International Civil Aviation Organization Flight Level Radians Degrees feet meters miles Nautical Miles Air Traffic Control Air Traffic Controllers Visual Flight Rules Instrument Flight Rules Air Traffic Management Air Traffic Flow Management Flight Level Unmanned Aerial Vehicle Unmanned Aircraft System Unmanned Aircraft Remotely Piloted Aircraft Systems Opening Angle Rate of Wake Altitude Differential Rate of Descent Eddy Dissipation Rate Brunt - Vaïsala Frequency Circulation Strength
7 This Page Intentionally Left Blank
8 ABSTRACT Nowadays, the aviation industry is one of the most important sectors in our society with a great variety of aircraft. Its development and evolution has brought the appearance of new aircraft and, consequently, an increase in the number of aircraft operations in both air and on the ground. Increasing the number of activities in both Air Traffic Management (ATM) and Air Traffic Flow Management (ATFM) has also led to a greater use of the airspace capacity. What it means is that the capacity has been optimized in order to perform more aircraft operations per minute without taking into account the aerial rules and regulations already established. One of the consequences of the optimization of the airspace capacity was the closer approximation between aircraft, that is to say, a reduction of the distance between the leading and the following aircraft. The approximation, which was carried out without taking into account any law, led to some really dangerous situations between aircraft due to the appearance of an effect on the following aircraft, called turbulences or shaking effects, which had never experienced before and which led them to be crashed. Thus, scientists established an uncertainty area, called Wake Turbulence, which should be avoided by all aircraft flying behind another aircraft in order to prevent such dangerous situations. Consequently, the aim of this thesis is to understand what a wake turbulence is and to establish safety distances requirements between aircraft. On the one side, what it is going to be studied is what a wake turbulence is, including its properties and characteristics, for a better understanding of what it is. On the other side, a type of modeling of the wake turbulence done previously is going to be studied in order to know how much the wake turbulence descends and moves
9 and, once it is done, a new modeling of the wake turbulence is going to be performed basing on previous studies. In addition to it, another simulation is going to be performed in order to see some collision scenarios between aircraft where the wake turbulence is involved. And, finally, once it is done, the minimal safety distance that UAS will have to maintain respect to other aircraft may be estimated..
10 This Page Intentionally Left Blank
11 Table of Contents INTRODUCTION... 1 Motivation... 1 Thesis Planning... 2 CHAPTER 1 BASICS OF WAKE TURBULENCE Wake Vortex Turbulence Characteristics Wake Vortex Encounter Wake Turbulence Classification Wake Turbulence Separation Preliminary work Conclusions...34 CHAPTER 2 AIRCRAFT CRITERIA UAS UAS selection IKHANA, NASA's PREDATOR - B NORTHROP GRUMMAN RQ - 4 GLOBAL HAWK Comparisons Conclusions...46 CHAPTER 3 WAKE VORTEX MODEL Literature in wake vortex model Results and Validation Conclusions My own wake vortex model Selection of data Wake Turbulence Envelope Comparisons Conclusion...71 CHAPTER 4 COLLISION SCENARIOS Vortex strength...79
12 CHAPTER 5 CONCLUSIONS Future work...82 CHAPTER 6 BIBLIOGRAPHY AND REFERENCES CHAPTER 7 ANNEXES ANNEX1: AIR TRAFFIC CONTROL Airspace Air Traffic Controllers Pilots Air Traffic Controllers and Pilots responsibilities Rules and Regulations ANNEX 2: FLIGHT LEVEL CHART ANNEX 3: WAKE VORTEX MODEL IN LITERATURE Selection of data Aircraft mass Wake Turbulence envelope Air density ANNEX 4: COORDINATE REFERENCES FRAME ANNEX 5: INHULL FUNCTION ANNEXES REFERENCES...122
13 This Page Intentionally Left Blank
14 List of Figures Figure 1. Wingtip vortices [1][2]... 7 Figure 2. Producing lift [3]... 8 Figure 3. Air movement around the wing [4]... 8 Figure 4. Wake vortices generation [5]... 9 Figure 5. Relation between the Angle of Attack and the generated turbulence [7]...10 Figure 6. Velocity profile [8]...12 Figure 7. Wake Vortex dimensions [9]...12 Figure 8. Region of influence of the Wake Vortex Turbulence [11]...13 Figure 9. Comparison of the potential wake vortex habitation area with respect to actual vortex hazard area [12]...14 Figure 10. Vertical motion [10]...14 Figure 11. Horizontal motion [10]...15 Figure 12. Horizontal movement with no crosswind [8]...15 Figure 13. Horizontal movement with a 3-knot crosswind [8]...16 Figure 14. Horizontal movement with a 6-knot crosswind [8]...16 Figure 15. Induced roll [8]...19 Figure 16. En route avoidance collision maneuver [8]...21 Figure 17. RVSM between FL290 and FL410 inclusive.[22]...26 Figure 18. Vertical separation for any aircraft following a heavy s [23]...26 Figure 19. Encounter geometries [12]...27 Figure 20. Generator climbing in front of encountering aircraft [12]...28 Figure 21. Generator crossing 1000ft above the encountering aircraft [12]...28 Figure 22. Geometry of climbing/descent aircraft [22]...29 Figure 23. Aircraft are always flying at minimum lateral/vertical separation distance L. [22].30 Figure 24. Geometry of crossing aircraft [22]...30 Figure 25. Aircraft are always flying at minimum longitudinal separation distance L. [22]...31
15 Figure 26. UAS elements [28]...37 Figure 27. Cessna Citation CJ+1 Model 525 [33]...40 Figure 28. NASA's Predator - B, Ikhana [34]...41 Figure 29. Northrop Grumman RQ-4 Global Hawk [37]...43 Figure 30. Wake Envelope Look - Up Table [38]...48 Figure 31. Wake turbulence envelope [38]...49 Figure 32. Wake turbulence coordinates [38]...49 Figure 33. Brunt - Vaïsala frequency at cruise altitudes [41]...51 Figure 34. Super - Heavy aircraft wake vortex envelope...52 Figure 35. Heavy aircraft wake vortex envelope...53 Figure 36. Medium aircraft wake vortex envelope...54 Figure 37. Light aircraft wake vortex envelope...55 Figure 38. Example of Wake area [11]...56 Figure 39. Avoidance area [43]...57 Figure 40. Four flight plans...59 Figure 41. Definition of the wake turbulence in the XY and YZ plane...61 Figure 42. YZ Plane Computational Methods...61 Figure 43. XY Plane Computational Methods...62 Figure 44. ROD equation on Matlab (m/km)...62 Figure 45. Definition of each plane...63 Figure 46. Definition of each vortex of each plane...63 Figure 47. Set of planes that will form the wake turbulence volume...64 Figure 48. Super - Heavy Wake Turbulence Plot...65 Figure 49. Heavy Wake Turbulence Plot...65 Figure 50. Medium Wake Turbulence Plot...66 Figure 51. Light Wake Turbulence Plot...66 Figure 52. XY Plane...67 Figure 53. YZ Plane...67
16 Figure 54. Google Earth Capture...70 Figure 55. Safety distance around the generating aircraft...73 Figure 56. Aircraft inside the area of minimum safety distance without wake turbulence influence...74 Figure 57. Aircraft inside the area and the wake turbulence volume...75 Figure 58. Aircraft outside of this area of minimum safety distance...75 Figure 59. Scenario Collision...77 Figure 60. Safety distance between a Heavy and Super - Heavy aircraft...77 Figure 61. Collision scenario...78 Figure 62. Message obtained...78 Figure 63. Vortex penetration scenarios [44]...80 Figure 64. Atmosphere s layers...88 Figure 65. Airspace classes...89 Figure 66. Radar Display from Madrid s ACC...90 Figure 67. Demonstration of the aircraft...90 Figure 68. Information label joint to the previous symbol...91 Figure 69. Flight Level Chart [4] Figure 70. Trajectory of the first plane with ID AAF Figure 71. Trajectory of the second plane with ID VLG Figure 72. Procedure for performing the simulation [5] Figure 73. EDR table definition Figure 74. ISA temperature distribution [9] Figure 75. ECEF coordinate references frame Figure 76. Ellipsoid parameters Figure 77. 3D Rotation Matrix Figure 78. LLA to ECEF Figure 79. ECEF to LLA Figure 80. Geocentric and Geodetic Latitudes
17 Figure 81. NED reference frame Figure 82. Matrix Rotation Figure 83. Data1-3D matrix Figure 84. 3D matrix which corresponds to "data1" Figure 85. 2D Matrix which corresponds to "data8" Figure 86. data8 matrix. Size of N*5 rows and 3 columns Figure 87. Concatenating values
18 List of tables Table 1. Aircraft category according to their MTOW and Wingspan [17]...22 Table 2. Example Aircraft Assignment to proposed Six Category System [17]...23 Table 3.Wake Turbulence separation matrix, according to the previous classification [19]...24 Table 4. Minimum Separation Distance...24 Table 5. BC-600's General Characteristics [33]...40 Table 6. BC-600's performances [33]...41 Table 7. Ikhana's characteristics [35]...42 Table 8. Ikhana's performances [35]...42 Table 9. Global Hawk's general characteristics [37]...44 Table 10. Global Hawk's performances [37]...44 Table 11. Comparison of the main parameters...45 Table 12. Super - Heavy aircraft results...52 Table 13. Heavy aircraft results...53 Table 14. Medium aircraft results...54 Table 15. Light aircraft results...55 Table 16. Sample Flight Track Data...58 Table 17. Aircraft information...58 Table 18. Minimal Separation Distance by ICAO/FAA...59 Table 19. Results...68 Table 20. Comparisons between both programs...69 Table 21. Final method results...71 Table 22. Meteorological Conditions Categories...97 Table 23. Sample Flight track data Table 24. Sample Aircraft Information Table 25. Mean and Standard Deviation of Aircraft Mass [5]
19 This Page Intentionally Left Blank
20
21 Introduction 1 INTRODUCTION The development of new technology in the aviation sector has led to the generation of new vehicles, such as UAS, the A and so on. Consequently, new rules and regulations must be implemented and be taken into account. Both ATM and ATFW are limited by the capacity of the airport. One of this goal is to increase this capacity in order to raise the number of aircraft operations per minute. However, increasing it without changing the regulations will cause a great number of accidents, since the minimal safety distance between aircraft is not respected. Therefore, it is needed to study a possibility of optimization of this capacity in order to reach the goal. It is the reason why the wake turbulence is being studied. Scientist wants to optimize the wake turbulence separation distances in order to optimize the capacity of the airport and, consequently, the airspace. The aim of this thesis is to study the wake turbulence by modeling it in order to be able to establish the minimal safety distance requirements between different aircraft categories when they are flying in the upper airspace, that is to say, during the enroute phase of flight. The idea is to get a volume for each aircraft weight category (Super - Heavy, Heavy, Medium and Light) and to simulate different collision scenarios with this uncertainty area for getting such distances. To sum up, the main goal is to establish the minimal safety distances between aircraft and UAS by modeling and simulating a volume of the wake turbulence. Motivation This Master Thesis has been carried out along all this year along with the ICARUS group team at Universitat Politècnica de Catalunya in order to study the safety
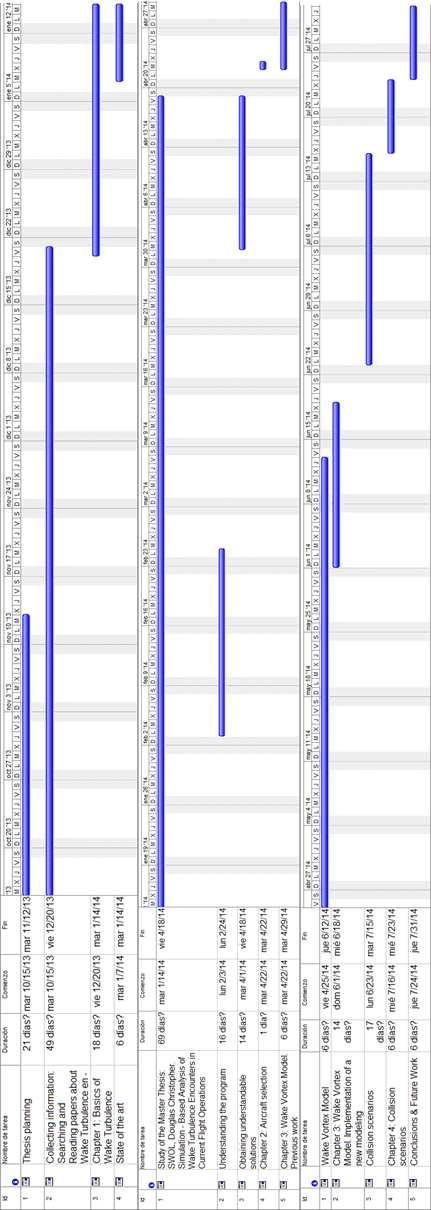
22 2 UAS sensitivity to wake turbulence for establishing safety distance requirements distances between aircraft when they are flying in the upper airspace and to be able to apply such distances to UAS. The fact that ICARUS is carrying out a project with Air Traffic Controllers (ATCO) and EUROCONTROL made me be interested in it. ICARUS would like to see what it would happen if an UAS, considered as a Medium or Light aircraft, is flying in the same flight path than another commercial aircraft and how ATCO would behave in front of this situation. Hence, as they are using a flight simulator for the project, what it would be proper is that the wake turbulence of all aircraft could be shown. This would make us know when there is a possibility of collision or a dangerous situation between different aircraft pairing during the test simulation. It is the reason why I wanted to study the wake turbulence and to try to perform a modeling of it in order that, for future projects, ICARUS is able to reach its goal. Thesis Planning The thesis work is presented in three parts as it follows:
23 Introduction 3
24 4 UAS sensitivity to wake turbulence for establishing safety distance requirements The first period of this thesis extends from October to January. The work done during this period consisted of getting information about wake turbulences by reading and searching any kind of information about it on articles, papers, other previous works and so on. As It is a complicated topic, so much time was needed to get ideas about what and how it was going to be done. The second period of this thesis extends from January to April. The work done was to study one of the Master Thesis found on the internet about Wake Turbulences. The Master Thesis done by Douglas Christopher Swol, "Simulation - Based Analysis of Wake Turbulence Encounters in Current Flight Operations" [38], was based on a simulation of the wake turbulence envelope in order to study different collision scenarios when aircraft were taking off or landing. Studying it took so much time due to the lack of information provided by the thesis itself and no aid came from the ones who wrote it due to the copyright rights. Hence, what it was carried out was to try to obtain some realistic solutions, in 2D, in order to be able to perform the own modeling of the wake turbulence for this project. The third period of this thesis extends from April to July. After obtaining such realistic solutions from the previous works, a new wake turbulence modeling was done, taking into account these results. The new model is based on the computation of a set of points behind a point given in a flight radar track obtained from the simulator and, then, a volume or an uncertainty area has been obtained. The computation takes into account Local and Cartesian Coordinates. In addition to this, some collision scenarios has been also performed and studied, taking into account this new model. Once everything has been done, some conclusions have been obtained from both methods and, finally, some recommendations for future studies are given. Therefore, the project has been performed as it follows:
25 Introduction 5 Chapter 1 What It is going to be explained in this chapter is the main definition of what a wake turbulence is, including its features, characteristics and effects. Such information was obtained from all papers, articles, thesis and so on which were read during the first period of work. Chapter 2 In this chapter, a proper aircraft selection criteria will be carried out for choosing which UAS can be compared and considered as commercial aircraft, according to their wingspan and Maximum Take Off Weight (MTOW) and, after, classifying them into the aircraft weight category. Chapter 3 Chapter 3 will be divided in two sections: 1. The first part consists in the study of a previous project which modeled the wake turbulence in order to obtain a wake turbulence envelope in 2D which would give the altitudinal and longitudinal distance of the wake turbulence for each aircraft weight category. 2. The second part consists in an own wake turbulence model in order to obtain an area in 3D for each aircraft weight category, taking into account the results obtained from the previous project studied. Chapter 4 And, finally, once all volumes for each aircraft weight category has been obtained, some collision scenarios will be studied in order to see if there is any dangerous situation while aircraft are flying in the same or different flight levels (FL). Chapter 5 This chapter will summarize and show the conclusions obtained after having done this project. And, finally, some future works which will allow to enhance it.
26 6 UAS sensitivity to wake turbulence for establishing safety distance requirements This Page Intentionally Left Blank

27 Basics of wake turbulence 7 Chapter 1 BASICS OF WAKE TURBULENCE In order to start this thesis, it is needed to know what a wake turbulence is and which properties or features it has, since it is an important effect that all aircraft generate Wake Vortex Turbulence Wake Vortex turbulence or, more correctly called wingtip vortices or wake vortices, can be defined as a turbulence which is generated by the passage of an aircraft in flight, since the airplane takes off until it lands, along all the flight. It can also be defined as an air mass which rotates over itself, around a rotating core called vortex line. This definition is shown in Figure 1. Figure 1. Wingtip vortices [1][2] The turbulence is the consequence of the generation of wake vortices due to the production of lift, which is generated as a result of the creation of a pressure differential that occurs over the wing surface of the aircraft, shown in Figure 2.

28 8 UAS sensitivity to wake turbulence for establishing safety distance requirements Figure 2. Producing lift [3] The pressure differential is generated due to the movement 1 of the air from underneath to above the wing, that is to say, the higher pressure air always tends to flow towards the area of lower pressure and, therefore, it results in a spiraling movement of the air around the wingtip. Figure 3. Air movement around the wing [4] The spiraling effect creates a tornado-like structure, called wake vortices, that is horizontal and left trailing in the flight path of an aircraft. To sum up, the wake vortices consists of two counter-rotating cylindrical vortices: the left vortex rotates clockwise and the right one rotates counter-clockwise. And, consequently, it creates an uncertainty area where they have their influence that is called Wake Vortex Turbulence, shown in Figure 4. 1 The movement makes the air move outwards under the wing towards the wingtip and curl up and over the upper surface of the wing.
![Basics of wake turbulence 9 Figure 4. Wake vortices generation [5] 1.](/docs-images/86/93695019/images/29-0.jpg "1.1. Characteristics As I have mentioned before, it is needed to do a reference of all the wake vortex turbulence features in order to reach a proper knowledge of it for the posterior work.")
29 Basics of wake turbulence 9 Figure 4. Wake vortices generation [5] Characteristics As I have mentioned before, it is needed to do a reference of all the wake vortex turbulence features in order to reach a proper knowledge of it for the posterior work. Wake vortex strength As these two vortices are a creation of the producing lift, their strength is governed by the weight, speed and wing shape of the generating aircraft, although it can be changed by the wing configuration, that is to say, by the extension of flaps, slats, rudder, etc. However, the most important factor is the weight. The greatest vortices occur under conditions of heavy weight airplanes in two cases: At low level in clean configuration, that is to say, in calm or very light wind conditions. At higher altitudes in thinner air. Other conditions where wake vortices are greater occur at high angles of attack and slow speed [6]. According to the theory of Physics and Fluid Dynamics, wake vortices are generated when the air is separated from the boundary layer at higher angles of

30 10 UAS sensitivity to wake turbulence for establishing safety distance requirements attack and, consequently, the air passes from being laminar to turbulent. Therefore, against higher angles of attack, greater turbulences will take place as shown in Figure 5. Figure 5. Relation between the Angle of Attack and the generated turbulence [7] During the first two minutes of its initial formation, the strength of the vortex shows a little dissipation at altitudes. After these two minutes, the dissipation is greater along the vortex path until both vortices break-up. All this process is affected by atmospheric turbulences so as it will depend on the atmospheric conditions which have already mentioned. This is the result of the decay process of the wake vortices as aircraft move forward and the wake vortex turbulence loses strength. Decay process Since wake vortices are generated until they lose strength and dissipate is called the decay process and it can give an idea of a possible shape or dimension of the wake vortex turbulence. This is usually fast, complex and so influenced by the atmospheric conditions. This is driven by the following factors [8]:
31 Basics of wake turbulence 11 Atmospheric turbulence which imparts viscous forces on the wake that extract energy from the vortex, reducing its strength. The heavier the turbulence, the quicker the wake decays. Viscous interactions which slowly extracts energy from the vortex, also reducing its strength. Buoyancy is an upward force that acts on the vortex as a result of the density inside the vortex system being lower than the density outside the vortex. It also extracts energy from the vortex, reducing its strength. Vortex Instability is generated in the vortex pair due to a small amount of turbulence in the atmosphere that causes the vortices to link. When they link, the strength of the pair decays rapidly. The time that all the decay process takes will determine the wake turbulence life span which is going to be explained later. Dimensions The two vortices generated by the production of the lift force at the wingtips are swirling air masses which develop a circular motion. They are composed of the following regions [8]: A core region of the vortex whose size can vary from only a few inches in diameter to several feet, depending on the type of aircraft. The outer edge of the core has the maximum velocity of the vortex which may exceed of 300ft/sec (92m/s). The outer region is characterized by a decreasing velocity profile, shown in Figure 6. It surrounds the core as large as 100ft (30.5m) in diameter, with air moving at speeds that decrease as the distance from the core increases.
32 12 UAS sensitivity to wake turbulence for establishing safety distance requirements Figure 6. Velocity profile [8] In cross-section, the vortex field flow covers an area about two wing spans in width and one wing span in height. The vortices tend to maintain this spacing, drifting with the wind, at altitudes greater than about a wing span from the ground. In Figure 7, the cross section profile is shown. As an example, a Boeing 747, with a span of 65 meters, trails a vortex from both wingtips each with a diameter of around 65 meters. Figure 7. Wake Vortex dimensions [9]
33 Basics of wake turbulence 13 The vortex circulation can be outward, upward and around the wingtips when viewed from either ahead or behind the aircraft. If the wake vortex encounter persists, a slight change of altitude and lateral position (preferable upwind) will provide a flight path clear of the turbulence. [9] The wake vortex strength, the decay process and dimensions are the same for all phases of flight, since they explain how a wake turbulence is generated and what shape it may have. Even if there is wind or ground effect, the formation of wake vortices will be the same but, they will make the wake vortex turbulence behave in another way than usual. Thus, a region behind an aircraft where this turbulence acts is generated and it may have consequences over other aircraft, which will be studied later. Figure 8 shows the uncertainty area where wake vortices persist. Figure 8. Region of influence of the Wake Vortex Turbulence [11] The area of influence of the wake turbulence is composed by two areas or factors which correct the number of potential encounters [12]. Such areas, shown in Figure 9, are: The wake vortex habitation area is the one where the wake vortex turbulence has its influence. The wake vortex hazard area which is typically the size of the aircraft.
34 14 UAS sensitivity to wake turbulence for establishing safety distance requirements Figure 9. Comparison of the potential wake vortex habitation area with respect to actual vortex hazard area [12] Vertical and horizontal movement Once the vortices are formed, their flow tends to move laterally and to descend vertically due to the ambient wind as the aircraft moves forward generating a perturbation called wake vortex turbulence [8]. Vertically, wake vortices descend at the initial rate of 300 to 500ft/min (1.52m/s to 2.54m/s) about the first 30 seconds. Then, the descent rate decreases and eventually approaches zero at between 500 and 900ft (152.4 and m) below the flight path. Between 900 and 1000ft ( and 305m) of height and at a distance of up to 5 miles (8.05km), both vortices are leveled off and they begin to dissipate. This descent rate is determined by the weight, flight speed and wingspan of the generating aircraft. Figure 10. Vertical motion [10]

35 Basics of wake turbulence 15 Laterally, they spread away from the aircraft. This movement is dictated by the ambient wind and the proximity of the vortices to the ground. However, at a certain altitude above Sea Level, this is determined by the velocity of the wind. Figure 11. Horizontal motion [10] Different scenarios for this last movement are going to be explained: a) With no crosswind, the two vortices move apart to clear the flight path Figure 12. Horizontal movement with no crosswind [8] b) With crosswinds of 1 to 5kt (0.514 to 2.6m/s), they can cause one vortex to remain near the flight path.
36 16 UAS sensitivity to wake turbulence for establishing safety distance requirements Figure 13. Horizontal movement with a 3-knot crosswind [8] c) With crosswinds greater than 5kt (2.6m/s), they can cause the vortices to move quickly across the flight path and to break up. Figure 14. Horizontal movement with a 6-knot crosswind [8] Wake Vortex Turbulence life span The weight, configuration, wingspan, speed and angle of attack of the aircraft determines the initial intensity of the wake. The main parameters for determining it are the atmospheric stability, wind strength and direction, ground effect and mechanical turbulence. These features will give us how much time vortices can persist in the air. [13] Wake Vortex turbulence are most persistent near the ground in light wind conditions (3 to 10kt or 1.54 to 5.14m/s). [14] Therefore:
37 Basics of wake turbulence 17 Approximately 30 seconds, with a wind speed between 5 and 10kt (2.6 and 5.14m/s) Up to 85 seconds, when the wind speed is less than 5kt (2.6m/s) Up to 100 seconds in still air At a certain altitudes above Sea Level, wake vortices may persist for between one and three minutes or longer during en-route flight, as it has been mentioned before. Nevertheless, the persistence will be determined by the atmospheric conditions Wake Vortex Encounter There are some times when you are inside of an aircraft when it is flying and, suddenly, you sense a shaking or vibrating movement on the aircraft, this is when a WVE occurs. It means that the aircraft in which you are flying has crossed a wake vortex turbulence from another airplane. However, not all encounters are dangerous, it will depend on the position and the time of the following aircraft at this moment. Some of the studies from pilots reported encountering wake turbulence as much as 20mi (32.2km) behind and 1000ft (305m) below a preceding aircraft. The risk for this encounter can occur due to environmental factors as weather conditions and operational factors as the spacing separation between aircraft. During en - route flight, WVEs are more likely to happen in situations of Reduce Vertical Separation Minimal (RVSM). RVSM is an aviation term that is used to describe the reduction of the standard vertical separation required between aircraft flying at levels between FL290 (29,000ft) and FL410 (41,000ft) from 2,000ft to 1,000ft. This increases the number of aircraft flying safely through airspace. RVSM airspace encompasses Europe, North America, parts of Asia and Africa and Pacific and Atlantic Oceans. [15]
38 18 UAS sensitivity to wake turbulence for establishing safety distance requirements Furthermore, during cruise flight, WVEs are more likely to happen with climbing or descending aircraft. Therefore, it means that the introduction of RVSM airspace keeps authorities worried due to the idea of reduction from 2,000ft to 1,000ft between FL290 and FL410, since wake vortex turbulence may still have effects until 1,000ft below of its initial origin. Effects of the WVE The greatest hazard from wake turbulence is the induced roll and yaw, more dangerous during the take-off and landing procedures since there is a little altitude to recover. [13] The induced rolling moment, shown in Figure 15, can exceed the roll control of the encountering aircraft. For evaluating it, the overall profile of the vortex must be combined with the aerodynamics characteristics of the encountering aircraft. By carrying out some experiments, which consisted of making aircraft fly directly into the core of a vortex of another aircraft, was shown that the capability of the encountering an aircraft to counteract the roll imposed by the wake vortex primarily depends on the wingspan and the counter - control responsiveness of the encountering aircraft. Counter-control is usually effective and induced roll minimal outside the rotational flow field of the vortex, that is to say, where the wingspan and ailerons of the encountering aircraft extend beyond the rotational field. For this reason, aircraft with short wingspans are most affected by wake turbulence, even if these are of the highperformance type. [16]
39 Basics of wake turbulence 19 Figure 15. Induced roll [8] The effect of the wake turbulence depends on the properties of the following aircraft: its weight, wingspan, relative positions and wake vortices. Some of them can be: In its mildest form, it might only experience a slight rocking of the wings. In its more severe form, a complete loss of control of the aircraft may occur. For recovering from this effect, it will depend on altitude, maneuverability and power of the aircraft. A loss of communication between Air Traffic Controllers and pilots. As it has mentioned, small aircraft are more sensitive to wake turbulence than larger aircraft. For this reason, they may be often displaced more than 30 degrees in roll. The most dangerous situation for them is when they fly directly into the wake of a larger aircraft which can result in a very high sink rates in excess of 1000 feet per minute. Therefore, the main goal is to avoid WVEs which can be really dangerous for the preceding aircraft. In order to reach this goal, ATCOs and pilots are very important and play an important role on it, since they are those who control all aircraft either they are on the ground or en-route phase of flight (see section 6.1. Annex1).
40 20 UAS sensitivity to wake turbulence for establishing safety distance requirements En - route Wake Turbulence Avoidance As it has mentioned before, WVE frequently occur in RVSM airspace, even with very distant aircraft (20NM km). For this reason, ICAO lays down strict rules about the permitted space between aircraft, based on the size, which are going to be explained in the chapter And, moreover, in these cases, the flight crew should consider keeping the seat belt signs ON, when the aircraft proximity is known. Some avoidance strategies must be taken into account when WVE occur in order to guarantee security and safety [8][13][14]: Do not get too close to the leading aircraft Be particularly wary when light wind conditions exist. Avoid the area below and behind other aircraft, especially at low altitude, where even a momentary wake turbulence encounter could be disastrous. Avoid flight below and behind a large aircraft. If a larger aircraft is observed along the same track (meeting or overtaking), adjust position laterally preferably upwind. When passing 1,000ft below another aircraft, the greatest hazard of wake turbulence encounter is miles (16.1km km) after the aircraft passes overhead. To avoid wake turbulence in this scenario, shown in Figure 16, the options are: o Request a lateral offset o Request a deviation for wake turbulence avoidance o Request direct to a fix in your flight plan that slightly changes the course o Request an altitude change
41 Basics of wake turbulence 21 Figure 16. En route avoidance collision maneuver [8] For alleviating the effects of the wake turbulence, the flight crew may offset from the cleared track, by up to a maximum of 2NM (3.7km). The ATC should be advised of this contingency action, but will not issue clearance 2 for this type of lateral offset. The aircraft should be returned to the cleared track as soon as possible. Wake turbulence can cause variation in pitch which is sometimes accompanied by a loud thumping noise when crossing a vortex perpendicularly Wake Turbulence Classification As it has been mentioned along all this chapter, the most important factors for the generating wake vortex turbulence are the lift and the wingspan of an aircraft. These are the reasons why each aircraft is assigned to a category based on the wingspan and the Maximum Take-off Weight (MTOW). 2 Clearance means authorization
42 22 UAS sensitivity to wake turbulence for establishing safety distance requirements The following table shows the FAA criteria, which are the same as ICAO s: Category A B C D E F m < 41,000lb MTOW m m m m < m > or (m) 300,000lb 3 300,000lb 300,000lb 300,000lb 41,000lb m < 15,500lb 125ft < b b 125ft 175ft 65ft < b Wingspan 175ft < b 125ft < b or b > 245ft 4 Or 90ft (b) 245ft 175ft regardless the 90ft < b wingspan 125ft Table 1. Aircraft category according to their MTOW and Wingspan [17] So, in other words, depending on the weight, wake vortex turbulence will be classified as: - Light (L): Aircraft types of less than 15,500lb (7,000kg) or less than 41,000lb (19,000kg), which correspond to category F. - Medium (M): Aircraft types of more than 41,000lb (19,000kg) and less than 136,000kg (300,000lb), which correspond to category D and E. - Heavy (H): All aircraft types of more or equal than 300,000lb (136,000kg), which correspond to category B and C. - Super-heavy (J): A380 aircraft wake vortices turbulence are the biggest ones. So, a new classification is being studied in order to be introduced. This classification corresponds to category A. [17] As an example of this classification, a list of aircraft for each category is presented in the next table. Category A Category B Category C Category D Category E Category F A380 B747 series MD11 B757 series AT72 E120 AN-225 A340 series B763 B737 series RJ100 B190 B777 series A306 A320 series RJ85 C650 A330 series C-17 B727 series B463 H25B C-5 MD80 series B462 C525 3 lb = pounds. 1lb = 0, kg 4 ft = feet. 1ft = m
43 Basics of wake turbulence 23 F50 E170 E190 CRJ1/2 B717 CRJ7/9 GLF5 AT45 DC95 AT43 DC93 GLF4 DH8D SF34 F100 DHSA/B/C F70 E135/145 Table 2. Example Aircraft Assignment to proposed Six Category System [17] Wake Turbulence Separation For avoiding a WVE, wake turbulence separation must be considered when aircraft of different weights categories are operating so close in the same flight path. This close approximation between them could lead to some dangerous situations for those of lower weight categories, since they are unstable to the effects that WVE can cause. It is the reason why ATC is required to apply wake turbulence separation standards, shown in Table 3 and 4, except for the case of an IFR aircraft on a visual approach where the pilot has reported sighting the preceding aircraft and has been instructed to follow or maintain visual separation from it [13].

44 24 UAS sensitivity to wake turbulence for establishing safety distance requirements Table 3.Wake Turbulence separation matrix, according to the previous classification [19] Therefore, summarizing the previous table, the separation to be applied to all aircraft in all phases of flight, under radar separation control, is shown in the next table: Leading Aircraft Super-Heavy Heavy Medium 5 Light Aircraft Following or Crossing Behind Super-Heavy Heavy Medium Light Super-Heavy Heavy Medium Light Super-Heavy Heavy Medium Light Super - Heavy Heavy Medium Light Minimum Separation Distance 2.5NM 6NM 7NM 8NM 2.5NM 4NM 5NM 6NM 2.5NM 2.5NM 2.5NM 5 NM 2.5NM 2.5NM 2.5NM 2.5NM Table 4. Minimum Separation Distance 5 A B757 maintains a separation of 4NM with regard to a heavy, another B757 and a medium aircraft and a separation of 5NM regarding a small aircraft.
45 Basics of wake turbulence 25 On en - route or intermediate approach phases, no special longitudinal spacing based on time are required. Light or Small aircraft will keep a minimum distance of 5 miles when they cross behind or follow the same track as a Heavy aircraft. [12] These distances are applied when one aircraft is operating directly behind (within ½ NM laterally), at the same level and up to 1,000ft below. However, such distances can be increased or decreased depending on the aircraft pairs, as table 3 and 4 show. In this same situation, when the separation is less than 2 minutes, radar controllers should issue a caution of possible wake turbulence, since wake turbulence may remain in the air up to 3 minutes. However, the airspace is classified into different classes and rules and, consequently, into different FL with a vertical separation minima, according to RVSM, [21]: 1,000ft up to FL290 between all aircraft. 1,000ft between FL290 and FL410 between RVSM 6 approved Aircraft only. 2,000ft between FL290 and FL410 between non-rvsm approved aircraft and any other aircraft. 2,000ft between all aircraft above FL410. In Figure 17, it is shown the application of RVSM between FL290 and FL410 inclusive. For obtaining more knowledge about the definition of the different FL for VFR and IFR flight (see section 6.2. Annex 2). 6 In South African, RVSM are not allowed. Therefore, a separation of 2000ft will be maintained between the leader and the follower aircraft.

46 26 UAS sensitivity to wake turbulence for establishing safety distance requirements Figure 17. RVSM between FL290 and FL410 inclusive.[22] Theoretically, the vertical separation applied between aircraft with different categories is the same, even for the A380, considered as a heavy aircraft, because it is fully RVSM capable. However, this theory may not be considered for A aircraft because they are classified as Super - Heavy airplanes and the separation might be bigger. [23] Figure 18. Vertical separation for any aircraft following a heavy s [23]
47 Basics of wake turbulence 27 Such cases take place unless ATCOs consider that a bigger distance is needed when safety issues are implied, since they are the ones to assess the vertical distance by: Observing the secondary ATS Surveillance System Mode C response in accordance with the conditions for the use of Mode C or by obtaining level reports from pilots. Being aware of aircraft performance characteristics and limitations in relation to simultaneous application of horizontal and vertical speed limitations. Nevertheless, in some special cases such as an intense wake turbulence or in places where there are big mountains, that is to say, when aircraft are exposed to instantaneous and unpredictable vertical movements, it would be advisable to increase the vertical separation. [12] In all phases of flight, there are some flight rules, depending on the configuration in which the aircraft flies, which must be obeyed, taking into account the visibility and distance to clouds, established by the Air Traffic Regulations [23]. However, as this project will be based on IFR flights, the rules which must be taken into accounts are those related to this rule. Therefore, it is needed to study the different ATM flight scenarios which can occur during an IFR cruise flight. Such scenarios imply safety issues by reducing the vertical, lateral and longitudinal separation during these operations. The typical encounter geometries on en - route flight are shown in the next figure and they are going to be plotted a posteriori. Figure 19. Encounter geometries [12]
48 28 UAS sensitivity to wake turbulence for establishing safety distance requirements For example, two scenario to be taken into account are the climbing and descending flights corresponding to the Encounter Geometries 1 and 2, since they are reported to play an important part in the risk of encountering a wake vortex because these ones can occur regardless of the weather. It can be divided in two: In Figure 20 and 21, it can be seen a generator aircraft climbing or descending and the following aircraft remains at the same level Figure 20. Generator climbing in front of encountering aircraft [12] Figure 21. Generator crossing 1000ft above the encountering aircraft [12] In Figure 22, it can be seen a generator and a following aircraft climbing or descending
49 Basics of wake turbulence 29 Figure 22. Geometry of climbing/descent aircraft [22] Other scenario, which has been already mentioned, is to maintain a vertical separation of 1,000ft, corresponding to the Encounter Geometries 3 and 4, depending on both the weather conditions and the characteristics of the generating aircraft, since a WVE can also occur in this one.
50 30 UAS sensitivity to wake turbulence for establishing safety distance requirements Figure 23. Aircraft are always flying at minimum lateral/vertical separation distance L. [22] Another one can be when two aircraft cross at a separation distance L as shown in Figure 24. Figure 24. Geometry of crossing aircraft [22] And, finally, when two aircraft are flying at the same level, they should maintain a longitudinal separation distance as shown in Figure 25.
51 Basics of wake turbulence 31 Figure 25. Aircraft are always flying at minimum longitudinal separation distance L. [22] For this thesis, the geometries which have been borne in mind are the Encounter Geometries 3 and 4, which correspond to Figure 23 and 24, since the project is based on all aircraft flying on en - route phase of flight, besides of the longitudinal separation which corresponds to Figure 25. The reason why these two geometries are going to be studied is because most of the time that an aircraft flies on en - route flight, it keeps a constant altitude and velocity, unless ATCOs make them vary by climbing or descending its altitude or reducing its velocity Preliminary work After explaining what a wake vortex turbulence is, what it is need to be explained is why it was started to study, according to past investigations made by scientists. The fact that the wake vortex turbulence is of an increasing interest along all these years is due to its relation with the amount of accidents which have occurred since the appearance of the aircraft industry and most of these ones were reported as a consequence of a WVE, instead of pilots. All research based on the wake turbulence of aircraft were determined especially by a series of economic, ecological, flight safety and security demands. This is due to its influence in the air at any phase of flight: departure, approach, cruise, arrival and land which other aircraft have to take into account.
52 32 UAS sensitivity to wake turbulence for establishing safety distance requirements Firstly, wake vortex turbulence research were focused mainly on the departure and arrival phases of flight where most of accidents and incidents took place. There are different reasons why most of these accidents occurred such as: ATCOs did not take into account the dimensions of the leading aircraft and did not give proper separations to pilots in order to avoid a WVE. The radar was not equipped by the most developed technology, reason why it did not notice the wake turbulence and not warn the ATCOs about it. The cause that generated such consequences were to try to reduce the separation distances between aircraft while taking off or landing, which meant to increase the use of the capacity in both the vicinity of the airport (ATM) and the air (ATFM), since it was a limiting factor. It was carried out without taking into account the spacing required to avoid the wake turbulence of the preceding aircraft. Another cause was the development of aircraft with larger wingspan and higher weight which implied an improvement of the aircraft performances and, therefore, airport installations such as new technologies, tracks, taxiways, etc. Consequently, a set of new rules must have been set up. Optimizing the airport capacity implied an increase in the number of airport activities: more passengers, more airplanes landing and taking off per hours, flight cancellations and delays. Thus, the need of raising the number of aircraft movements on the ground has become one of the most important goals for the aeronautical sector, since the augment of air traffic and the introduction of large aircraft. As a consequence, authorities 7 started to look for methods in order to optimize and improve the capacity of all airports as reducing the spacing required between aircraft, for instance. It leads to establish a set of separation rules which were imposed by airport safety and security conditions, related to the action of the wake vortex turbulence generated between aircraft. The principle of spacing is based on the consideration of all relevant influences: 7 Authorities: FAA, NASA, airport operators and all the airline industries.
53 Basics of wake turbulence 33 Weather forecast improved and updated by sensing the ambient weather conditions used along with data of aircraft pairing to predict the vortex behavior to provide a non - hazardous vortex or vortex free space along the approach path. Adequate margins of security around the wake vortex decay to overcome the uncertainties. The required time to guarantee a safe approach for a following aircraft which defined the minimum separation distance. Therefore, the goal is to minimize the spacing required between aircraft. Some actions can be performed by taking distance from their safe limits, that is to say, the maximum critical distance behind an aircraft. In such actions, aerodynamics, fluid dynamics, meteorology aiming for low vortex design, accelerated decay, weather and vortex behavior prediction and aircraft control are counted [25]: Measured to reduce vortex strength Passive or active devices to speed up the vortex decay More precise prediction of vortex behavior Minimization of the non - hazardous vortex or vortex free space Active aircraft encounter control Speaking about the cruise or en-route flight, 36 wake turbulence incidents were reported to occur in the Upper European Airspace, that is to say, above FL285 (28,500ft) from 2009 and Due to the evolution of the air traffic mix with the appearance of "Very Light" or "Light" jets and "Super Heavy" aircraft as it has been mentioned above, there is a need for a better understanding of en - route wake vortex issues. Moreover, the fact the airports' capacity need to be increased also makes airspace capacity raise. It means that against more aircraft take off from the airport per hour, more airplanes will be flying in cruise flight and, thus, the necessity of enhancing new rules for avoiding WVEs.
54 34 UAS sensitivity to wake turbulence for establishing safety distance requirements A study performed in 1999 which was conducted to evaluate the possible impact of RVSM on the risk of encountering a wake vortex en - route [26]. Once RVSM was introduced, 73 wake turbulence incidents took place and were reported to have occurred above 5000ft, 26 of which occurred above FL285. It allowed to determine the probability of an en-route WVE occurring above FL285, to indentify the main risk factors for assessing their evolution on time and to estimate which safety measures might mitigated regarding the risk in the ATFM [41]. Therefore, the solution proposed in such study for increasing the capacity of the airport was to reduce the safety distances between airplanes by establishing a separation margins between a leading and a following aircraft in order to avoid any WVE. To sum up, wake vortex turbulence started to be studied because of the number of accidents took place due to its influence. Besides of the little knowledge that ATCOs and Pilots had regarding its behavior and the fact that the wake turbulence is invisible makes it be more difficult in order to estimate the safety separation distances Conclusions The conclusions of this chapter can be set as it follows: The wake vortex turbulence of an aircraft is an area created as a consequence of two spiraling vortices created at the wingtips of an aircraft. It is also a critical area of risk which should be avoided by other airplanes because it may cause damages and really dangerous situations to other aircraft flying directly into this area. The behavior of the wake vortices and life span are determined by the atmospheric conditions on that moment. It happens from the moment they are generated, on its origin, located on the wing at b 8 0 of its wingspan, until they 8 b 0 is called the initial spacing and it will depend on the wing geometry, that is to say, if the wing is elliptic or rectangular. For this project, an elliptical geometry is considered so, the initial spacing will be located at π/4 of the wingspan.
55 Basics of wake turbulence 35 dissipate after a certain time behind of it. The dissipation rate will also depend on the weather conditions. Wake vortices may persist for between one and three minutes or longer, depending on the atmospheric conditions, on en - route phase of flight. The shape that the wake turbulence reaches when wake vortices are leveled off is: In cross - section: An area of about two wing spans in width and one wing span in height. However, a set of security margins must be taken into account around both vortices. Longitudinally: It reaches a distance up to 5mi or more. Between 900 and 1000ft of height and at a distance up to 5mi, they tend to level off and start to dissipate. However, they can persist for 20NM. Vertically: It descends up to 1,000ft below its origin with a descent rate of ft/min during the first thirty second and, after, with a smaller descent rate. Laterally: It moves depending on the velocity of the wind and the aircraft. WVEs occur when a following aircraft flies into the wake turbulence of a generating aircraft. The goal is to avoid such situations by establishing safety separation distances between aircraft of different weight categories, according to FAA and ICAO. The critical area corresponds to the one contained into these safety distance separations where aircraft cannot penetrate. The effects of a WVE are the induced roll and yaw which can cause displacements of the following aircraft of 30, 45 or more degrees in roll.
56 36 UAS sensitivity to wake turbulence for establishing safety distance requirements Chapter 2 AIRCRAFT CRITERIA In the next chapter, what it is going to be carried out is a proper selection of different UAS that, according to its features, can be considered as manned or commercial aircraft. Once it is done, these chosen UAS could be classified into the aircraft weight category shown in Table UAS Along all these years, a new class of aircraft has been introduced into civil and military sectors in order to perform some activities which commercial aircraft cannot perform. These are called UAS or Unmanned Aircraft System, according to ICAO. For a better understanding of this concept, the FAA established the following meaning and shown in Figure 1: A UAS is the unmanned aircraft (UA) and all of the associated support equipment, control station, data links, telemetry, communications and navigation equipment, etc., necessary to operate the unmanned aircraft. The UA is the flying portion of the system, flown by a pilot via a ground control system, or autonomously through use of an on-board computer, communication links and any additional equipment that is necessary for the UA to operate safely. [27]
57 Aircraft Criteria 37 Figure 26. UAS elements [28] Nowadays, in Europe, this term has been substituted by Remotely Piloted Aircraft System (RPAS), which is defined as a particular type of UAS, in which the aircraft is not autonomous and is piloted remotely. The main difference is that UAS is referred to the complete system, involving communications, ground stations, pilots, etc., and RPAS are referred to the vehicle which is part of the UAS. In the beginning, RPAS were only used for military services but, nowadays, their continuous development has led to an increase of their use in many aeronautical applications, thus giving a major criterion for their civil use. Moreover, it implies that a set of rules and regulations must be adopted in order that UAS can operate alongside with other commercial aircraft, ensuring its safety. Hence, one of the main goals for RPAS is to introduce them into the airspace. However, the lack of regulations and rules for its flight into it, as well as the lack of required technology for it, has become a limiting factor, since the development of RPAS leads to new technologies such as equipments and loads, and
58 38 UAS sensitivity to wake turbulence for establishing safety distance requirements competitiveness among all sectors due to the development of business, work, research, etc. [29] Thus, it is need to establish a hypothesis in order to make it possible which is: If they were considered as manned aircraft, they would be able to be integrated into the airspace. What this statement says is that UAS must be considered as manned aircraft in order to reach the previous goal. However, some aspects must be considered in order to carry it out [30]: Accomplishing the flight regulations, ensuring all the time the safety of their integration. Fulfilling with the requirements of Communications, Navigations and Surveillance accounting the class of airspace where they are flying. To satisfy with the SESAR system (management of the intended track) and with the ATC procedures/rules. Need of essential prerequisites in order to safeguard the security of the system: o RPAS must be approved by the competent authorities. o The RPAS operator must hold a valid RPAS operator certificate o The Remote pilot must hold a valid license. RPAS must be considered as light aircraft and should avoid carrying unnecessary loads. The social impact of their applications must be studied in matter of responsibility, privacy, assurance, etc. Need of a common regulatory framework in order to cover RPAS of all sizes and all types of operations, since their main objective is to maintain safety all the time. Regarding to RPAS must be light, a conclusion can be set up: a RPAS can be categorized as a Light or Very light aircraft and it could be introduced in the Weight classification table, shown in Table 2, for a set of different RPAS. Thus, once they are able to fly into the airspace, all the other aircraft, Pilots and Controllers must be warned and notified about these drones.
59 Aircraft Criteria 39 As all aircraft, RPAS are also exposed to many hazards such as turbulences, lightning, air, etc., when they are flying en-route flight. However, they differ from commercial airplanes due to their limited size which involves a major sensitivity to wake turbulence, that is to say, they will be affected more than commercial aircraft. It may induce need for particular separation requirements as well as a complete study of different types of wake turbulence that an airplane, with different wingspans, can generate [31][32] UAS selection As I have mentioned before, UAS can be considered as a Light or Very Light aircraft depending on their weight and wingspan. For this study, two kind of UAS are going to be considered since their performance are quite similar to an airplane which can be considered as a Light aircraft, shown in Table 2. These UAS are: Ikhana, NASA s Predator B Northrop Grumman RQ 4 Global Hawk But, before explaining them, a Light aircraft from Table 3 is going to be taken firstly it in order to study its characteristics and properties and, then, to compare them with those of the previous UAS. It will allow to classify them into the proper Weight category. The aircraft used is the Cessna CitationJet, CJ series Model 525 (C525), shown in Figure 2. The C525 is a turbofan powered light corporate jet built by Cessna and developed as an improved version of the Citation CJ1 which gained its certification around It is mainly used for business trips. [33]

60 40 UAS sensitivity to wake turbulence for establishing safety distance requirements Figure 27. Cessna Citation CJ+1 Model 525 [33] Its characteristics and performances are shown in the next tables: General Characteristics Category Crew Capacity Length Wingspan Height Empty Weight Loaded Weight Useful Load Maximum Take Off Weight Power Plant C525 Jet < 15,500lbs One 3 9 passengers 42ft 7in (12.98m) 46ft 11in (14.3m) 13.75ft (4.19m) 6,765lb (3,069kg) 43,250.3lb (19,618kg) 3,835lb (1,740kg) 10,700lb (4,853kg) 2 x Williams FJ44-1AP turbofan, 1,965lbf (8.74kN) each Table 5. BC-600's General Characteristics [33]

61 Aircraft Criteria 41 Performance Maximum Speed Cruise Speed Range Service Ceiling Rate of climb C kt (720km/h) 389kt (720km/h) 1,300nmi (2,048km) 41,000ft (12,497m) 3,290ft/min (1,003m/min) Table 6. BC-600's performances [33] IKHANA, NASA's PREDATOR - B NASA s Predator B or MQ - 9 Reaper, shown in Figure 3, is an RPAS capable of remote controlled or autonomous flight operations, developed by General Atomics Aeronautical Systems (GA-ASI) and used by the United States Air Force. It was designed and built for long endurance and high altitude surveillance for military services. [34] Figure 28. NASA's Predator - B, Ikhana [34] NASA started to use an unarmed version of the Reaper which was named as Ikhana and, moreover, acquired a ground control station in a mobile trailer.
62 42 UAS sensitivity to wake turbulence for establishing safety distance requirements Ikhana means intelligent, conscious or aware and its main goal is the Suborbital Science Program within the Science Mission Directorate. Originally, it was used extensively to survey the Southern California wildfires in [35] Some of its characteristics and performances are shown in the next table: General Characteristics Category Crew Length Wingspan Height Empty Weight Maximum Take Off Weight Fuel Capacity Payload Internal External Power Plant NASA s Predator - B Jet < 15,500lbs 0 onboard, 2 in ground station 36ft 1 in (11m) 65ft 7 in (20m) 11ft 10in (3.6m) 4,901lb (2,223kg) 10,494lb (4,760kg) 4,000lb (1,800kg) 3,800lb (1,700kg) 800lb (360kg) 3,000lb (1,400kg) 1 x Honeywell TPE turboprop, 900hp (671kW) with Digital Electronic Engine Control (DEEC) Table 7. Ikhana's characteristics [35] Performance Maximum Speed Cruise Speed Range Service Ceiling Endurance NASA s Predator - B 482km/h (260kt) 313km/h (169kt) 1,852km (1,000 nmi) 15,240m (50,000ft) 14 hours fully loaded Table 8. Ikhana's performances [35]

63 Aircraft Criteria NORTHROP GRUMMAN RQ - 4 GLOBAL HAWK RQ 4 Global Hawk, shown in Figure 4, is an RPAS surveillance aircraft built and designed by Ryan Aeronautical or, most commonly, Northrop Grumman. In its beginnings, it was used for surveillance operations because it was provided by a broad overview and systematic surveillance using high resolution synthetic aperture radar (SAR) and long rage electro optical/infrared (EO/IR) sensors with long cruising time over target areas. Nowadays, it is used by the USA Air Force and U.S. Navy in a high altitude platform for surveillance and security. Its missions are to cover the spectrum of intelligence collection capability to support forces in worldwide operations in order to provide more precise weapons targeting and better protection of friendly forces. In addition to this, NASA also uses it for demonstrating new technologies and developing new markets for the aircraft, including possible civilian uses. For example, it was used for science applications such as measurements of the ozone layer, cross Pacific transport of air pollutants, aerosols and missions to monitor the development of Atlantic basin Hurricanes. [36] Figure 29. Northrop Grumman RQ-4 Global Hawk [37] Some of its characteristics and performances are shown in the next two tables:
64 44 UAS sensitivity to wake turbulence for establishing safety distance requirements General Characteristics Category Crew Length Wingspan Height Empty Weight Maximum Take Off Weight Fuel Capacity Payload Power Plant RQ 4 Global Hawk Jet < 41,000lbs 0 onboard (3 remote: LRE 9 pilot; MCE 10 pilot and sense operator) 47.6ft (14.5m) 130.9ft (39.9m) 15.4ft (4.7m) 14,950lb (6,781kg) 32,250lb (14,628kg) 4,000lb (1,800kg) 3,000lb (1,360 kg) 1 x Rolls Royce F137 RR 100 turbofan engine, 7,600lbf (24kN) thrust Table 9. Global Hawk's general characteristics [37] Performance Maximum Speed Cruise Speed Range Service Ceiling Endurance RQ 4 Global Hawk 432kt (800km/h) 310kt (575km/h) 7,560nmi (14,001km) 60,000ft (18,288m) hours Table 10. Global Hawk's performances [37] Comparisons For classifying the previous RPAS into the wake turbulence classification, the most important parameters to be taken into account are the weight and the wingspan, more the first one since it is the factor that balances the lift force which is the cause 9 LRE: Launch and Recovery Element 10 MCE: Mission Control Element
65 Aircraft Criteria 45 that the wake vortices are produced. Therefore, the MTOW and the Wingspan from the previous tables are going to be compared. C525 NASA s Predator B Ikhana RQ 4 Global Hawk MTOW 10,700lb (4,853kg) 10,494lb (4,760kg) 32,250lb (14,628kg) Wingspan 46ft 11in (14.3m) 65ft 7in (20m) 130.9ft (39.9m) Table 11. Comparison of the main parameters According to the theory: A "Medium" aircraft is when: o Class D: MTOW < 300,000lb (136,000kg) and a wingspan of: 125ft < b 175ft (38,1m < b 53,34m) 90ft < b 125ft (27,4m < b 38,1m) o Class E: MTOW > 41,000lb (19,000kg) and a wingspan of: 65ft < b 90ft (20m < b 27,4m) A "Light" aircraft is when: o Class F MTOW < 41,000lb (19,000kg) and a wingspan of: b 125ft (b 38,1m) MTOW < 15,500lb (7,000kg) regardless of wingspan or a powered sailplane Therefore, comparing the values from Table 12 to the theoretical data, some conclusions can be established:
66 46 UAS sensitivity to wake turbulence for establishing safety distance requirements o NASA's Predator - B Ikhana can be considered as a "Light" aircraft because its MTOW is less than the theoretical one. o RQ - 4 Global Hawk can be considered as a "Medium" aircraft of the Class D because it fulfill the requirements of this classification Conclusions After this study, it can be conclude that some RPAS, such as NASA's Predator - B, RQ - 4 Global Hawk and so on, can be classified into the aircraft weight category, shown in Table 2, according to their configuration and properties, though all RPAS are considered as "Light" or "Very Light" aircraft, according to the European RPAS Roadmap from June 2013 [29][30] that says: "RPAS must be considered as manned aircraft accounting some aspects. One of them says that RPAS must be considered as "Light" aircraft and should avoid carrying unnecessary loads in order to be integrated into the airspace." However, the NASA's Predator - B Ikhana and RQ - 4 Global Hawk can be considered as a "Light" and "Medium" aircraft, respectively, according to their MTOW and wingspan performances.
67 Wake Vortex Model 47 Chapter 3 WAKE VORTEX MODEL This chapter will be focused on the wake vortex turbulence modeling. On the one side, a previous wake vortex model is going to be studied in order to get some solutions related with the shape of the wake turbulence. Then, on the other side, such solutions will be used for a new wake vortex model, independently of the first one. Thus, a 3D volume of the wake turbulence is going to be obtained Literature in wake vortex model The first part of the project is to simulate the wake turbulence area of influence for each weight category (Super - Heavy, Heavy, Medium and Light). For doing that, a programming code in MATLAB has been used. Such code was uploaded on the internet inside of a Master Thesis. This Thesis was written by Christopher Douglas Swol and the topic was "Simulation - Based Analysis of Wake Turbulence Encounters in Current Flight Operations" [38]. The code is called TDAWP model (TASS Driven Algorithm for Wake Prediction) and it was developed and used by NASA/FAA. This model is based on the fluid - dynamics Terminal Area Simulation System (TASS) model which numerically solves the Navier - Stokes equations to determine wake vortices. It computes a set of differential equations in order to obtain an area behind of the leading aircraft and it provides very accurate predictions for wake descent (altitude change) but it does not for longitudinal distance, since there is an error. It means that, despite having been validated by demonstrating TDAWP's capabilities as the model was able to match the actual wake measurements from LIDAR, a small error was maintained which directly depended on the input values of atmospheric turbulence (Eddy Dissipation Rate (EDR), Brunt - Vaïsala Frequency (BVF) and Circulation Threshold (CS)).

68 48 UAS sensitivity to wake turbulence for establishing safety distance requirements The consequence of using such model was to generate a table where a set of normalized values which corresponded to its three primary parameters. Such parameters drive the size/shape of the wake envelope: EDR, BVF and CS. It consisted of running this model over a wide range of these values and, then, normalized them. This table was generated by J. Shortle at George Mason University (GMU). [38] Figure 30. Wake Envelope Look - Up Table [38] On the one side, for determining the longitudinal (y-axis or t-axis) and the altitudinal (z-axis) of the wake vortex envelope, normalized data values must be calculated and, once it is done, it must find these parameters in the look - up table. Then, with the chosen row, the wake envelope will take the t* and z* values as the y and z coordinates. On the other side, for computing the lateral (x-axis), it is calculated as the difference between the lower and upper boundaries of the wake vortex (z + - z - ), which is added to the initial lateral distance. It must be taken into account that the wake turbulence spreads laterally and vertically at the same rate because of the circular rotating motion of wake vortices. However, on the en-route flight, it spreads less laterally since no ground effect is produced and, consequently, the lateral movement is determined by the velocity of the wind and the aircraft. Therefore, once the model is run, a wake vortex turbulence envelope will be obtained, as shown in Figure 31.


69 Wake Vortex Model 49 Figure 31. Wake turbulence envelope [38] The model is based on real flight track data, written in different text files, from where the aircraft information is taken. The goal is to simulate the wake area of influence behind the leading aircraft by running 20 points in the simulation. Such points will be creating by feeding inputs from the operational model, that is to say, from the aircraft information (e.g. aircraft mass, velocity, wingspan, air density) and a set of coordinates of the envelope will be obtained, shown in Figure 32. Figure 32. Wake turbulence coordinates [38]
70 50 UAS sensitivity to wake turbulence for establishing safety distance requirements However, despite having used this model for obtaining realistic solutions of the wake vortex envelope in 2D, the lack of information from the files, the Wake Envelope Look - Up Table, shown in Figure 30, and the little help coming from the authors who wrote this thesis, since it is a NASA's project and there are copyright rights, has made it be too difficult to get a better understanding of what they did on the thesis. Nevertheless, as it has been used, the program has been forced to get some solutions by plotting the wake envelope in 2D and obtaining, at least, the altitudinal and longitudinal distances in order to use them in the new wake vortex model. Thus, with these two distances, a shape in 3D of the wake turbulence will be obtained by using a new wake turbulence modeling (see section 7.3. Annex 3: Wake Vortex Model in literature) Results and Validation Before running the program, certain considerations and hypothesis are done. Although it is a model for arriving and departing aircraft, results will be considered the same for en-route flights, since all aircraft generate the same wake turbulence and the study is focused on this phase of flight. On en-route flight, wake turbulence can remain up to 3min in the air, depending on the velocity of the wind, and may have consequences up to 20NM or more, depending on how strong the wake turbulence is. It is also a model for larger aircraft (Heavy) and small aircraft (light). Therefore, Super - Heavy results can be very different from the ones expected. The vertical distance will provide very appropriate values. However, the longitudinal distance is not very accurate due to an error of 10% between the real and the predicted circulation [24]. The input constant values will be EDR, BVF and CS. These ones are set to be 0.02, 0.01 and 175 m 2 /s, respectively. The first two values are chosen because they are the normal values on en-route flights and the latter because of the introduction of Super - Heavy aircraft.
71 Wake Vortex Model 51 The BVF's value was obtained from Figure 33, according to the cruising FL. The EDR's value was obtained from Figure 73 (see section 7.3. Annex 3: Wake Vortex Model in literature) and this value is strongly related to the BVF's. Figure 33. Brunt - Vaïsala frequency at cruise altitudes [41] The GMU look - up table is incomplete since the column of maximum normalized circulation strength lacks. However, with the EDR and BVF values are enough. Considering all these hypothesis, the program is run. The model has two parts: The first part identifies which aircraft is the leader and which one is the follower. The program will create a wake envelope from the closest point of both aircraft, that is to say, in the point where a wake encounter is likely to occur. The conditions are: The time between the leader and the follower has to be less or equal than 0.1h, since the time is given in hours. The distance between the leader and the follower has to be less or equal than 5 miles. The altitude between both of them has to be less or equal than 1000ft (305m).

72 52 UAS sensitivity to wake turbulence for establishing safety distance requirements The second part takes the leader aircraft and computes its wake envelope formed by 20 points as it is shown in Figure 32. It means that, for generating these points, it will just take into account the leader aircraft, regardless the follower. Therefore, the results which are going to be obtained are: the wake vortex envelope of each aircraft of different weight category in 2D, the longitudinal distance (y - axis, Δy) and the height total (z - axis, Δz). a) Super - Heavy aircraft The plot in 2D of the wake vortex turbulence of a Super - Heavy aircraft is shown in Figure 34. Δz (Altitude) Δy (Distance) Distance (NM) SH (30.98km) Altitude (ft) 1,179.4 (359.5m) Table 12. Super - Heavy aircraft results Figure 34. Super - Heavy aircraft wake vortex envelope From the figure, the wake turbulence descends until 1,1794ft below its initial formation and reaches a distance of NM behind the aircraft. b) Heavy aircraft The plot in 2D of the wake turbulence of a Heavy aircraft is shown in Figure 35.

73 Wake Vortex Model 53 Distance (NM) H (23.2km) Altitude (ft) ( m) Δz (Altitude) Table 13. Heavy aircraft results Δy (Distance) Figure 35. Heavy aircraft wake vortex envelope Looking at the figure, the wake vortex turbulence descends until ft below its initial formation and reaches a distance of NM. c) Medium aircraft The plot in 2D of the wake turbulence of a Heavy aircraft is shown in Figure 36.
 Δy (Distance) Figure 36. Medium aircraft wake vortex envelope Observing the figure, the wake vortex turbulence descends until 560.")
74 54 UAS sensitivity to wake turbulence for establishing safety distance requirements Distance (NM) M ( km) Altitude (ft) ( m) Table 14. Medium aircraft results Δz (Altitude) Δy (Distance) Figure 36. Medium aircraft wake vortex envelope Observing the figure, the wake vortex turbulence descends until ft below its initial formation and reaches a distance of NM. d) Light aircraft The plot in 2D of the wake turbulence of a Light aircraft is shown in Figure 37.

75 Wake Vortex Model 55 Δz (Altitude) Distance (NM) Altitude (ft) L (1.0708km) (24.352m) Table 15. Light aircraft results Δy (Distance) Figure 37. Light aircraft wake vortex envelope From the figure, the wake vortex turbulence descends until ft below its initial formation and reaches a distance of NM. Remaining in the air does not mean that the end of the wake turbulence affects to the following aircraft, it will depend on the circulation strength. As it has been mentioned before, wake turbulence can late up to 3min to get completely dissipated and might affect to other aircraft up to 20NM in cruise flight. Furthermore, according to the theory, the vertical separation between aircraft is up to 1,000ft unless stronger wake turbulence may require it to be bigger. Therefore, such distances and heights obtained are understandable due to the properties of each weight category, shown in Table 1. It is also shown that Super - Heavy aircraft have the biggest wake vortex envelope and Light aircraft have the smallest ones. It means that Light aircraft have the smallest circulation strength, that is to say, the smallest weight and, thus, they are going to be the most affected ones when they fly behind an aircraft of other weight category.

76 56 UAS sensitivity to wake turbulence for establishing safety distance requirements The fact that the GMU look - up table was created was for the purpose of getting an example of a possible wake turbulence area. In order to find the proper row for drawing the area, EDR, BVF and CS normalized values must be calculated depending on the aircraft chosen. Once they are calculated, the program look for a row which matches with the values obtained. Then, each coordinate takes the proper column of such row, according to Figure 30. However, if a row from the table is chosen, an area in 2D of the wake envelope can be obtained, as it is shown in Figure 32. Thus, comparing the previous results with Figure 38, it can be said that the previous wake vortex envelope plots obtained can be validated. The picture represents an example of wake area according to the GMU look - up table [38], given by J. Shortle [11]. Figure 38. Example of Wake area [11] Conclusions After having worked on the TDAWP model, it has allowed to obtain a 2D profile view of the wake vortex envelope and give proper solutions for wake descent but not for the longitudinal distance of the wake as a consequence of an error, which has been already mentioned previously, and the lack of information from the project itself.

77 Wake Vortex Model 57 What it has taught is that, vertically, wake turbulence can reach up to 1,000ft below its origin for Super - Heavy, Heavy, Medium and Light aircraft. This is the reason why this vertical altitude is going to be used for a new wake modeling My own wake vortex model Basing on the previous results for the altitude and longitude coordinates and everything that has been mentioned previously, my own simulating program to model the wake turbulence has been done. The simulation consists of modeling a volume for each point from a given flight radar track. The program will compute the volume in x, y and z in Cartesian Coordinates and, then, getting them in Local Coordinates in order to draw a volume in 3D. The result has to give something similar to the dark area shown in Figure 39. This is the wake turbulence area from the flight path of the aircraft to 1,000ft below it, approximately. Figure 39. Avoidance area [43] The volume, drawn in Local Coordinates, will be lead to the centre of the Earth. This is the reason why it will let us draw it on Google Earth or over another map. Moreover, it will let the wake turbulence move on Google Earth, following the bearing of the aircraft.
78 58 UAS sensitivity to wake turbulence for establishing safety distance requirements Selection of data First of all, some information data has to be obtained from different files which the program will read and open. This data will be the flight radar track of different aircraft, their performances and the minimal safety distances established by ICAO or FAA. The flight plan data sheet gives the information of the route that the aircraft will follow, shown in Table 19. It will provide the register number of each aircraft, its identification number, time, latitude, longitude, heading and ground speed. Register Number Aircraft Identification Zulu Time (h) Altitude (m) Heading (Deg) Latitude (Deg) Longitude (Deg) Ground Speed (m/s) 1 IBE IBE IBE IBE IBE IBE Table 16. Sample Flight Track Data The aircraft information sheet will summarize all aircraft contained into the previous sheet by their register number in order to know how many aircraft are flying. It will indicate its weight category classification, wingspan, the maximum distance that reaches the wake turbulence and the vertical distances until it decays. This is shown in the next table. Flight Record Aircraft ID Wake Category Wingspan (m) 1 IBE760 Super-Heavy 80 2 IBE946 Heavy 64 3 GHAWK4 Medium 40 4 IKHAB Light 20 Table 17. Aircraft information Maximum Distance (NM) 17 (31.484km) 13 (24.076km) 9 (16.668km) 2 (3.704km) Vertical Distance (m)
 Super-Heavy Heavy Medium Light Super-Heavy 2.5 6 7 8 Heavy 2.5 4 5 6 Medium 11 2.5 4 4 5 Light 2.5 2.5 2.5 2.5 Table 18.")
79 Wake Vortex Model 59 The minimal safety distances sheet shows the distances established by ICAO and FAA between different aircraft configurations. Separation Distances (NM) Super-Heavy Heavy Medium Light Super-Heavy Heavy Medium Light Table 18. Minimal Separation Distance by ICAO/FAA For this project, four aircraft of different weight categories have been chosen, although more aircraft could have been used. The flight plan of each one, obtained from the flight plan data sheet by generating a KML on Matlab which has allowed it to be drawn on Google Earth, is shown in the next figure. Figure 40. Four flight plans 11 In this case, the Medium aircraft is a B757, since Global Hawk was classified as a Medium Weight Category of Class D.
80 60 UAS sensitivity to wake turbulence for establishing safety distance requirements It will let us see which is the real flight path of each aircraft when more aircraft are wanted to be run into the program Wake Turbulence Envelope As It has been mentioned before, the program is based on modeling a wake turbulence, that is to say, an uncertainty area behind the aircraft where no other aircraft should be. Therefore, it has to be a volume in 3D. This volume is going to be recalculated for each point of the given flight radar track, taking into account the latitude, longitude, altitude, speed, heading, wingspan, the rate of descent of the wake turbulence, the maximum distance that the wake turbulence may remain in the air, the vertical distance which it may descent and the angle that makes the wake turbulence spread laterally. Each computation will be done in Cartesian Coordinates and, after, the results obtained will allow to get Local Coordinates in order to generate a KML file, that is to say, to represent the wake turbulence in Google Earth, in a static or moving way. Furthermore, as all points must have a wake turbulence, they have to be referred to another point which is located on the Earth Surface. In this case, all of them will be referred to the center of the Earth. It will allow to obtain the wake turbulence in the exact point where it is wanted the wake turbulence to be. Moreover, referring all points to the center of the Earth will allow our wake turbulence model to move in Google Earth, since the recalculated points will take into account the new values of latitude, longitude and altitude (see section 7.4. Annex 4: Coordinate reference frame). Therefore, regarding it, the wake turbulence is going to be drawn in planes. The total number of planes must be set up, that is to say, a set of imaginary points will be calculated behind of each point given in the flight plan and, for each of them, a plane will be drawn. This number of points will be constants for each plot. They will be also contained into the maximum distance obtained in the section for each aircraft
81 Wake Vortex Model 61 weight category. The definition of how the wake turbulence shape is going to be is shown in Figure 41. Figure 41. Definition of the wake turbulence in the XY and YZ plane The computation consists in the next steps: 1. "α" is the opening angle (AOW) in degrees. For obtaining this value, the vertical distance obtained from the results of the chapter has been used. Firstly, the Pythagoras Theorem, shown in Figure 42, has been used for computing the longitudinal distance that must correspond to the vertical distance and the Rate of Descent (ROD). And, secondly, with this longitudinal distance (l), the AOA can be calculated, shown in Figure 43. Figure 42. YZ Plane Computational Methods
82 62 UAS sensitivity to wake turbulence for establishing safety distance requirements Figure 43. XY Plane Computational Methods 2. ROD is the Rate of Descent established to 500ft/min (152m/min). However, as the program just works with higher distances, its units are going to be taken as m/km. Figure 44. ROD equation on Matlab (m/km) 3. max_dist is the longitudinal distance obtained from the previous wake model in section "AZ" is the altitude differential, in meters, which directly depends on the ROD. 5. "δv" is the velocity differential, in meters, per second which corresponds to the aircraft velocity. 6. "δw" is the half of the aircraft wingspan, in kilometers. 7. "d'" is the sum of δw plus a distance, in kilometers, which depends on the AOA and δv and will make the wake turbulence spread laterally. 8. "d" is the distance between each plane, in kilometers. 9. "N" corresponds to the number of points and it is set up to be 10 points. Therefore, on the program, the computational method is shown in Figure 43:
83 Wake Vortex Model 63 Figure 45. Definition of each plane Consequently, each plane will be defined by 5 points as it is shown in next figure. Figure 46. Definition of each vortex of each plane As the model is going to be in 3D, three coordinates are needed. This is why px (x - axis points), py (y - axis points) an pz (z- axis points) have been used which define each rectangular plane that will be contained into the wake turbulence plot. Thus, as they are going to be referenced to the Earth Center, it will be easier later to make them rotate according to the Earth Sphere (see section 7.4. Annex 4: Coordinate reference frame). Therefore, the planes will be drawn as it follows in the next figure:
84 64 UAS sensitivity to wake turbulence for establishing safety distance requirements Figure 47. Set of planes that will form the wake turbulence volume Thus, once the simulation program is run, the result obtained will be similar for each aircraft of different weight category. However, it is going to be easy to differentiate them according to their wingspan and the values obtained. It is needed to mention that against more points behind the aircraft location, more accurate and easier to differentiate the different plots will be. It has to be taken into account that the fact that all points are referred to the center of the Earth, the program has to use large distances. This is the reason why, on the computational model, the longitudinal axis will be set in kilometers and the altitudinal axis will be set in meters, shown in Figure 45. One of the consequences of using large distances is that the longitudinal axis may not give proper values of it. Hence, the results obtained are plotted in the next figures.

85 Wake Vortex Model 65 Figure 48. Super - Heavy Wake Turbulence Plot Figure 49. Heavy Wake Turbulence Plot

86 66 UAS sensitivity to wake turbulence for establishing safety distance requirements Figure 50. Medium Wake Turbulence Plot Figure 51. Light Wake Turbulence Plot Seeing from XY and YZ plane the previous plots, the longitudinal, latitudinal and altitudinal axis are represented by Δx, Δy and Δz, respectively.


87 Wake Vortex Model 67 Figure 52. XY Plane Figure 53. YZ Plane So, summarizing each plot for each aircraft weight category, what it has been obtained is shown in the next table:
88 68 UAS sensitivity to wake turbulence for establishing safety distance requirements Parameters Distance Maximum Lateral Weight between α Distance Distance Category points (deg) (km) (m) (km) Super - Heavy Heavy Medium Light Table 19. Results Altitude Differential (m) 517 (1700ft) 312 (1026ft) 238 (782ft) 14 (46ft) Longitude Distance (NM) 17 (31.484km) 13 (24.076km) 9 (16.668km) 2 (3.704km) As it has been repeated along all this project, one thing is the duration of the wake turbulence in the air and another thing is the minimum safety separation distance, since a wake turbulence may last for 3 minutes or longer, depending on the air configuration. However, even if it lasts for this time, it does not mean that there is a WVE because the vortex strength may be so low that its effect may results negligible. This is why it is needed to see how much this strength is in order to specify and establish the safety distance requirements for all of UAS Comparisons Before starting the different collision scenarios, it is needed to compare the first results with these new ones.
89 Wake Vortex Model 69 Super - Heavy (A ) Heavy (B747) Medium (Global Hawk) Light (Ikhana) Previous Model Own Model Altitude Differential (m) (1180ft) (1700ft) (943.41ft) (1026ft) (560.38ft) (782ft) (79.9ft) (46ft) Previous Model Own Model Longitude Differential 17 (31.484km) 13 (24.076km) 9 (16.668km) 2 (3.704km) (NM) 17 (31.484km) 13 (24.076km) 9 (16.668km) 2 (3.704km) Table 20. Comparisons between both programs Comparing both results from both programs run in this project, it can be said that the values for wake descent can be considered corrects, since they are quite similar and give accurate results. For the longitudinal distance, such results cannot be considered properly corrects, since there was an error on the previous project. Nonetheless, this distance has been used for drawing the planes contained into the wake turbulence plot and, consequently, they have remained constants. It has to be mentioned that these values are obtained for the most critical case, that is to say, when the rate of descent is the highest slope value which is 500ft/min (152m/min). In addition to this, in the new wake vortex model, such values will depend on the number of points N which will make them change. This is why this number of points is established to be the same for all cases. On the one hand, the previous model method only worked out with small wake turbulences, from Heavy's to Light's, without testing the Super - Heavy configuration and can only be drawn in 2D. However, it takes into account the CS, the EDR and the BVF in order to model the Wake Turbulence Envelope which came from different

90 70 UAS sensitivity to wake turbulence for establishing safety distance requirements values contained into a Wake Envelope Look - Up table (see Figure 30), which is not completed. On the other hand, the final method worked for all weight configurations and for large distances, taking into account the X, Y and Z coordinates, which will let it be implemented in any map or in Google Earth, as an example of it is shown in Figure 54. Figure 54. Google Earth Capture Moreover, all results can be plotted in 3D, instead of 2D, taking a bigger uncertainty area. Despite the fact that the CS or vortex strength, the EDR and the BVF have not been used along this second part, wake descent results are properly corrects for the type of aircraft that has been used in this part. Using large distances, it may not give proper longitudinal distances like the previous model. Nevertheless, the program has been built up following the results obtained from the previous wake vortex model. Furthermore, for this part, what it has been used are the properties of each aircraft obtained from the information file, such as velocity, position, time and so on.
91 Wake Vortex Model Conclusion After running and comparing the results of both methods, it can be said that solutions can be considered correct in height (Z-axis), since wake turbulence can descend beyond 1000ft, but not for longitudinal (Y-axis), since the existence of an error in the previous model. Nevertheless, it is known that the wake turbulence can last in the air for 3 minutes or longer, or up to 20NM, depending on the wind conditions and the aircraft weight category. For the method chosen for this project, the results obtained are: Super - Heavy (A ) Heavy (B747) Medium (Global Hawk) Light (Ikhana) Own Wake Turbulence Model Altitudinal Distance (m) 517 (1700ft) 312 (1026ft) 238 (782ft) 14 (46ft) Lateral Distance (m) Longitudinal Distance (NM) 17 (31.484km) 13 (24.076km) 9 (16.668km) 2 (3.704km) Table 21. Final method results These results are obtained independently from the RVSM rule, which says that vertical distance can be shorten from 2,000ft to 1,000ft in order to optimize the ATFM between FL290 and FL410 and ATM around the airport. Such results can be explained as it follows: 1. Vertically, wake turbulences can descend up to 1000ft or more, depending on the aircraft weight category. 2. Laterally, wake turbulences can be spread depending on the velocity of the wind and the aircraft, since on en - route flight they usually spread less due to the lack of the ground effect.
92 72 UAS sensitivity to wake turbulence for establishing safety distance requirements 3. Longitudinally, the values are kept constants as the previous model. Wake turbulences may be up to 5NM, but could persist during 20NM depending on the wind configuration, since some effects could still be notices at such distance. Therefore, vertical and lateral distances can be considered corrects for all the aircraft chosen for this project whose solutions are nearly similar to the ones obtained from the previous method. The longitudinal distance cannot be considered accurate due to the existence of an error.
93 Collision scenarios 73 Chapter 4 COLLISION SCENARIOS Once all the wake turbulence volumes are obtained, different collision scenarios can be performed. For doing it, some limitations must be set up with regard to the minimum safety distances already mentioned. The limitations established are: A difference of height of 1000ft (305m) between the generating and the following aircraft A safety distance, shown in Figure 55, around the generating aircraft. Depending on the weight category of the leading and following aircraft, it will take one security distance from the Table 18. Figure 55. Safety distance around the generating aircraft Moreover, in order to know if the following aircraft is contained into the array of points of the generating aircraft, a function called "inhull" is used. It consists in testing if a set of points are inside a convex hull. In this case, the position of the following aircraft is the test point and the convex hull is the wake turbulence volume that is the array of vertices or points of the leading aircraft in 2D (see section 7.5. Annex 5: Inhull function). Consequently, this part must be divided in three parts:
94 74 UAS sensitivity to wake turbulence for establishing safety distance requirements 1. If the aircraft is contained inside the area of minimum safety distance but without being contained into the convex hull, that is to say, into the wake turbulence volume, shown in Figure 56. However, it is needed to be sure if there is a possibility of WVE in a future, that is to say, it is needed to check if there is going to be a dangerous situation in any given moment in the pass of the following aircraft behind the leading's, by evaluating each point. Figure 56. Aircraft inside the area of minimum safety distance without wake turbulence influence 2. If the aircraft is contained inside the area of minimum safety distance and is also contained into the convex hull, shown in Figure 57.
95 Collision scenarios 75 Figure 57. Aircraft inside the area and the wake turbulence volume 3. In case there is no crashing moment is because the aircraft is not inside of this area of minimum safety distance and it is not going to be influenced by the wake turbulence in any moment in the future. The message plotted for this case will be: "No existence of crashing moment". Figure 58. Aircraft outside of this area of minimum safety distance Then, evaluating the first two scenarios, some results are obtained:
96 76 UAS sensitivity to wake turbulence for establishing safety distance requirements a) In the first case, as the aircraft is not contained into the wake turbulence volume, it is needed to check if there is a possibility that, in any given moment, there is a possibility of collision between both aircraft. The system will return "There is no crash moment due to the wake turbulence. It is needed to check if there is any dangerous situation around the aircraft" and, evaluating it, two messages will be obtained depending on the aircraft follower's position with regard to the leader's: I. "There is a possibility of a crashing moment at any moment" when both aircraft are really closer to each other. II. "There is no going to be any crashing moment" when no crash is presented due to the distance between both aircraft. b) In the second case, the aircraft is contained in both, the wake turbulence volume and the area of minimum safety distance. When this situation occurs, the system will return the next message: "Wake Turbulence Caution. Keep safety distances." and, evaluating it, two other messages will be obtained depending on the position of the follower's inside the wake turbulence: I. "BE CAREFUL. DANGEROUS SITUATION: WAKE TURBULENCE AREA. IMMINENT COLLISION" II. "Situation dangerous. A wake turbulence area is located. Some turbulence will be noticed". In the case there is a possible collision, the program will return which the generating and the following aircraft are, shown in Figure 59, the minimal wake turbulence separation between them, shown in Figure 60, and the position of the following aircraft inside the generating's wake turbulence, besides of a message.
97 Collision scenarios 77 Figure 59. Scenario Collision Where the safety distance between a Heavy and a Super - Heavy aircraft is 2.5NM. Figure 60. Safety distance between a Heavy and Super - Heavy aircraft However, although there is a possibility of collision, it does not mean that there is going to be a crash at any moment because it means that the following aircraft position is contained into the convex hull. Hence, this case of collision is shown in Figure 61 and the message obtained is shown in Figure 62.

98 78 UAS sensitivity to wake turbulence for establishing safety distance requirements Figure 61. Collision scenario Figure 62. Message obtained Thus, it is going to be possible to know if a crash may or may not happen. The program will evaluate all those points which are inside this safety distance and those which are inside of the wake vortex turbulence. And, therefore, every time the program is run, a different message will be obtained. However, it is needed to be sure if, when the distance between the leader and the follower is less than the minimum safety distance, there is or not a crash. It means that it is needed to check how much the vortex strength is in order to know how strong it is in each calculated point. When this strength is known, it is going to be
99 Collision scenarios 79 possible to establish safety distances between aircraft and UAS along the cruise flight Vortex strength As I have already mentioned, it is needed to know if there is going to be a crash or not, that is to say, if the wake vortex turbulence influences or not in the following aircraft. This might be performed if the vortex strength was known and, consequently, which effect could be caused if a WVE occurs. However, it is quite complicated to know exactly the behavior of the wake vortex turbulence by this procedure because it is not known which parts of the wake turbulence volume are the most critical and the least one, since it is not simulated properly by a CFD program which will let the effects be known. Consequently, what it can be foreseen is that the wake vortex will be stronger from the wake vortex origin until the minimum safety distance which corresponds to the critical area and the effects that can be caused are shown in the next figure.

100 80 UAS sensitivity to wake turbulence for establishing safety distance requirements Figure 63. Vortex penetration scenarios [44]
101 Conclusions 81 Chapter 5 CONCLUSIONS As the goal of this project is to establish safety distance requirements between commercial aircraft and UAS, once these ones are able to fly in the upper airspace, some conclusions have been obtained. It has to be counted that all the aerial rules already established for en-route phase of flight which are related to the separation from the wake turbulence must be respected by everyone, even if they can fly closer than the ones already set up by ICAO and FAA. However, if an aircraft or an UAS wants to get closer to another aircraft for security manners, pilots will have to wait for the ATCO's clearance until they get the authorization, but always keeping a certain security distance. Both UAS, Global Hawk and Ikhana Predator - B, have been classified as Heavy and Light aircraft, respectively, since they are the only ones that are already allowed to fly in the Upper airspace. As wake turbulence can descend from its origin to 1000ft or below it, last 3 minutes or longer longitudinally and spread laterally some certain degrees, a wake turbulence volume is obtained. Therefore, the solutions obtained are: 4. For a Super - Heavy: It descends 1700ft vertically, lasts 17NM longitudinally and spreads laterally with a wingspan of 80m with an angle of 0.03 degrees. 5. For a Heavy: It descends 1026ft vertically, lasts 13NM longitudinally and spreads laterally with a wingspan of 64m with an angle of degrees. 6. For a Medium: It descends 782ft vertically, lasts 9NM longitudinally and spreads laterally with a wingspan of 40m with an angle of degrees. 7. For a Light: It descends 14ft vertically, lasts 2NM longitudinally and spreads laterally with a wingspan of 20m with an angle of degrees. As I have already mentioned previously, the values obtained for wake descent (vertical distance) and lateral distance can be considered properly corrects but not for
102 82 UAS sensitivity to wake turbulence for establishing safety distance requirements lateral distance. However, all these results have been used in order to obtain the Wake Turbulence plot. Moreover, this is the first time that the A has been used for this study, this is why the results might not be equal as the ones provided before, since no studies have been carried out about its wake turbulence. Therefore, it could be considered that UAS, classified as a Medium and Light aircraft must be separated: From Super - Heavy and Heavy aircraft by the minimum safety distance provided in Table 18 when they are flying at the same flight level. From Medium aircraft, if the UAS is considered as Medium, by a separation from 4NM to 9NM and, if the UAS is considered as Light, by a separation from 5NM to 9NM. From Light aircraft, by a separation of 2NM is enough. A Light aircraft must be held to the safety distance rules for all aircraft which fly before it. Nevertheless, when a Light aircraft is flying before other Lights', they could be also separated by a distance of 2NM, since aircraft of similar weight categories have similar vortex strength and, consequently, they can get closer due to the similarity of their properties and features. To sum up, UAS and commercial aircraft will be held to the minimum safety distances already established by ICAO and FAA, except for those aircraft which have similar weight categories. Nevertheless, in case anything happens and it means that an aircraft have to come closer to another aircraft, it is compulsory to obtain an authorization from ATCOs. An example of it can be the aircraft refueling while it is flying on en - route phase of flight Future work As it is an initial study for those enterprise who works with UAS, there are some improvements to be done for the future and which could be really helpful in the next years.
103 Conclusions 83 First of all, once all UAS are allowed to fly in the Upper Airspace, one thing that should be done is to simulate the UAS's wake turbulence on their simulators as ATCO's radar display. As the points of the wake turbulence have been displayed as rectangular planes, it is going to be easy to draw the wake turbulence symbol of the ATCO's radar display (see section 7.1, Figure 67) by doing that each plane is a symbol in a shape of a rhombus. Secondly, such project could have been done by taking into account the three main properties of the wake turbulence which are the EDR, BVF and CS. However, it has been decided to perform it by Local Position (longitude, latitude, altitude) and aircraft properties (speed, wingspan, weight and so on) to make it simple in order to program it for the airplanes simulator. Thirdly, a new constant, which is the wind, should be included in order to move the wake turbulence according to the wind velocity and, moreover, it has to be plotted what happens if the wake turbulence ascends or descends in order to see how the wake turbulences moves. Fourthly, the two remaining geometries which correspond to Encounter Geometry 1 (Climb/Descent - Level) and 2 (Climb/Descent - Climb/Descent) should be also studied once the program is enhanced. And, finally, for better understanding and having more knowledge about the behavior of the wake turbulence, a CFD simulation in Ansys/Fluent or GID should be done in order to know which areas of the wake turbulence volume are the most and the least critical in case any aircraft is inside of the convex hull, which is the wake vortex turbulence.
104 84 UAS sensitivity to wake turbulence for establishing safety distance requirements Chapter 6 BIBLIOGRAPHY AND REFERENCES [1] (Accessed on 1 st /12/2013) [2] tex.html (Accessed on 1 st /12/2013) [3] (Accessed on 1 st /12/2013) [4] (Accessed on 5 th /12/2013) [5] (Accessed on 5 st /12/2013) [6] (Accessed on 5 th /12/2013) [7] (Accessed on 04 th /04/2014) [8] (Accessed on 10 th /10/2013) [9] (Accessed on 21 st /10/2013) [10] (Accessed on 9 th /12/2013) [11] SHORTLE, J., SHERRY, L., WANG, J., ZHANG, Y., Wake Turbulence Research Modeling. C. Doug Swol and Antoni Trani. George Mason University. Virginia Tech. [12] HOOGSTRATEN, Mike, VISSER, Hendrikus, HART, Dennis, TREVÉ, Vincent and ROOSELEER, Frederic. An Improved Understanding of En-route Wake Vortex Encounters. Delft University of Technology. Delft, The Netherlands. EUROCONTROL HQ. Brussels (Belgium). [13] (Accessed on 1 st /12/2013) [14] (Accessed on 1 st /12/2013) [15] (Accessed on 1 st /12/2013)
105 Bibliography and references 85 [16] (Accessed on 1 st /12/2013) [17] Wake Turbulence. Course Reference Card. Advanced Aircrew Academy [18] Aeropuertos Españoles y Navegación Aérea. División de Información Aeronáutica. Airbus A Wake Turbulence. Cancel AIC 3/08. España. 25th September [19] /safo [20] (Accessed on 1 st /12/2013) [21] (Accessed on 1 st /12/2013) [22] CAMPOS, L., MARQUES, J., Collision Probabilities, Aircraft Separation and Airways Safety. Lisbon. Portugal. [23] (Accessed on 1 st /12/2013) [24] (Accessed on 1 st /11/2013) [25] HAHN, Klaus Uwe. Coping with wake vortex. Institute of Flight Research, German Aerospace Center (DLR), Germany [26] Woodfield, A. A. En-route encounters with wake vortices, and the implications of reduced vertical separation minimum RVSM Woodfield Aviation Research Report No [27] (4 th /04/2014) [28] BILLINGSLEY, Thomas B., Safety Analysis of TCAS on Global Hawk using Airspace Encounter Models. Massachusetts Institute of Technology, June [29] European RPAS Roadmap. Roadmap for the integration of civil Remotely- Piloted Aircraft Systems into the European Aviation System. June [30] European RPAS Roadmap. Annex 1. [31] European RPAS Roadmap. Annex 2. [32] European RPAS Roadmap. Annex 3. [33] cessna-citation-cj1-ar84044.html (Accessed on 4 th /04/2014)
106 86 UAS sensitivity to wake turbulence for establishing safety distance requirements [34] AMBROSIA, V., BUONI, G., COBLEIGH, B., HOWELL, K., RIVAS, M., The NASA IKHANA UAS Platform. Introduction to UAV. [35] (Accessed on 4 th /04/2014) [36] (Accessed on 4 th /04/2014) [37[ x (Accessed on 4 th /04/2014) [38] SWOL, Douglas Christopher. Simulation - Based Analysis of Wake Turbulence Encounters in Current Flight Operations. Final Master's Thesis. Virginia Polytechnic Institute and State University. Antonio Trani, Pamela Murray - Tuite, Shinya Kikuchi. August 24, [39] FAN, Z., TRANI, A. Potential Wake Encounter Analysis in Current and NextGen Flight Operation. Virginia Polytechnic Institute and State University. April 25, ICNS Conference. [40] GERZ, T., HOLZÄPFEL, F., DARRACQ, D., Commercial Aircraft Wake Vortices. Pogress in Aerospace Science 38 (2002) Elsevier Science Ltd. Institut for Atmospheric Physics, German Aerospace Center (DLR) Oberpfaffenhofen. Centre Européen de Recherche et Formation Avancée en Calcul Scientifique (CERFACS) Toulouse. [41] HOOGSTRATEN, Mike, VISSER, Hendrikus, HART, Dennis, TREVÉ, Vincent and ROOSELEER, Frederic. An Improved Understanding of En-route Wake Vortex Encounters. Delft University of Technology. Delft, The Netherlands. EUROCONTROL HQ. Brussels (Belgium). [42] (4 th /04/2014) [43] (Accessed on 12/07/2014) [44] _Leerstoelen/Afdeling_AEWE/Aerodynamics/Contributor_Area/Secretar y/m._sc._theses/doc/2007_1_6.pdf (Accessed on 22/07/2014)
107 Annexes 87 Chapter 7 ANNEXES 7.1. ANNEX1: AIR TRAFFIC CONTROL Air Traffic Control (ATC) is a service provided by controllers at Control Tower (TWR) or Area Control Centre (ACC) of an airport to lead aircrafts when they are on the ground (TWR) or in the air (ACC). Its maximum priority is the avoidance of possible collisions between aircrafts that operate under the system, to organize the amount of traffic and to make it agile. The main objectives are: - To prevent collisions between aircraft; - To avoid collision between aircraft and obstructions of the area (terrains, etc.); - To keep air traffic organized, arranged and managed; - To give advices and the information necessary to a safe flight; - To notify Search and Rescue to controllers of the respective area. Air Traffic Control is used in the countries that comprise the Chicago Convention 12 that created the International Civil Aviation Organization (ICAO). ATC usually controls most of the airspace, either controlled or uncontrolled airspaces. Furthermore, ATC requires certain rules for pilots and controllers. One of them is to keep communications all the time along the duration of the flight, since aircraft must be in control in case of a possible emergency could occur. [1] Airspace Airspace is the portion of the atmosphere controlled by a country above its territory, either marines or terrestrials, or more generally, any specific three dimensional portion of the atmosphere. By international law, the notion of a country s sovereign 12 Chicago Convention or Convention on International Civil Aviation established the International Civil Aviation Organization (ICAO) in which a set of rules of airspace, aircraft registration and safety, and details the rights of the signatories in relation to air travel. The Convention also exempts air fuels from tax. The document was signed on December 7, Nowadays, this Convention has 191 states parties.

108 88 UAS sensitivity to wake turbulence for establishing safety distance requirements airspace corresponds with the maritime definition of territorial waters as being 12 miles out from a nation s coastline. The Federation Aéronautique International has established the Karman line at an altitude of 100km (62.1 mile) that represents the boundary between the Earth s atmosphere and the outer space. Airspace is divided into two basic types, known as FIR (Flight Information Region), which is also subdivided into a variety of areas and zones including those ones where certain flying activities are restricted or completely prohibited, which are defined by ICAO (International Civil Aviation Organization). With the development of aircraft, an Upper Information Region (UIR) was added upon FIR. - Controlled airspace is an aviation term to describe airspace in which traffic levels are such that it has been determined that ATC must give some form of separation between aircraft. It exists in the vicinity of busier airports where aircraft used in commercial air transport flights are climbing out from or making an approach to the airport, or at higher levels where will tend to cruise. Figure 64. Atmosphere s layers - Uncontrolled airspace is an aviation term that describes airspace when an ATC service is not deemed or cannot be provided by practical reasons. Usually, ATC does not exercise any authority but will provide information to aircraft in radio contact. It is permitted to fly under IFR and VFR. Since 2004, ICAO has been studying a proposal in order to reduce the number of airspace classes in three, which would be to the current classes C, E and G.
 or Area Centre Controls")
109 Annexes 89 Figure 65. Airspace classes Air Traffic Controllers Controllers are the people who work either Control Towers (TWR) or Area Centre Controls (ACC) or Terminal Area Control Centers (TACC). Their objectives are to
 is showed, when they are flying, they are approaching to the runway or they are going to take off in order to keep security, safety and confidence")
110 90 UAS sensitivity to wake turbulence for establishing safety distance requirements control aircrafts, through their Radar Display where all aircraft information (heading, velocity, height, wake turbulence, orientation and direction of the air) is showed, when they are flying, they are approaching to the runway or they are going to take off in order to keep security, safety and confidence among aircrafts. So, a kind of relation between pilots and controller must exist [2][3]. Figure 66. Radar Display from Madrid s ACC Figure 67. Demonstration of the aircraft on the Radar Display Positioning symbol: It indicates where the aircraft is located. Information comes from the Primary Radar Historical Points: It indicates the path that the aircraft has done. The separation between them shows how the speed of the aircraft is, that is to say, fast or slow If these ones are more separated, it means that the aircraft speed is fast. If these ones are closer, it means that its speed is slow.
111 Annexes 91 This symbol is usually accompanied with a label which indicates all the aircraft information. IBE: Iberia (Type of Airline) 035: It is the real altitude (feet) above the airport s altitude and the arrow, which follows it, means if the aircraft climbs or descends. 130: Level of flight authorized 24: Ground speed (knots) H: Type of wake vortex turbulence 1121: CSSR Code. It is the code that is put on the transponder of the SSR in order to know the aircraft s identification. It is an indicator. Figure 68. Information label joint to the previous symbol As this project is going to take into account just the en-route flight, the controllers that work in this area are the following ones [2]: - Executive Controller has the principal decisions about separation between aircraft and the communications with them and carries out the tactical coordination with other executive controllers. - Planner Controller keeps updated and organized the flight progress strip, detects conflicts and gives the necessaries coordination to avoid them, coordinates with Tower Controls the route clearance for their takes off and passes the considered ones to the collateral dependencies. - Assistant of the Flight Data attend to the Planner Controller and, if it is necessary, carries out coordination. In Spain, this kind of controller does not exist yet but, continues working in some towers and his mission is to maintain updated the relative information to the flight plans. In addition, here is counted on other two controllers of more level [2]: - Supervisor Controller controls and inspects that as personnel as systems realize their missions in an appropriate form, in order to maintain the work from the sectors. Also, coordinates with the other supervisor controllers from
112 92 UAS sensitivity to wake turbulence for establishing safety distance requirements other dependency, provides aids in the case of overloads of the work and coordinates the rotation of the equipment of controller of the sectors under his responsibility. - Head of chamber is, usually, the position to the oldest controllers which have more experience. He coordinates all the elements that participate in the operations, included the management of the affluence of traffic. Moreover, each ACC or TACC has an Approach Controller which is in charge of approaching the aircraft to the airport when it is going to land or moving it away after taking off. Depending on the routes that aircraft must follow, the weather, the traffic and anything that could affect to pilots, some aeronautical charts are published which contain the instructions of the flight to follow and the established routes which are standards. These are published by the airports for aims to attenuate the effects of the noise in some airports. Other important functions of these are [2]: - Protection of the environment (principally noises) - To be able to follow the flight, although a possible loss of communications between controllers and pilots may occur - To follow the shortest route of departure or arrival - To allow climbs and descents interrupted by a minimum of restrictions - To reduce the number of communication ground/air, as well the service load of pilots and air controllers. In addition, there is other action that is realized in the approach control which is called radar vector service. Through it, controllers can indicate to pilots the altitude that they must keep and the path that they must fly. It finishes when pilots can carry out the navigation by themselves Pilots A pilot is the person who controls or leads the aircraft since it takes off until it lands, according to Air Traffic Controllers rules. He/she is responsible for all passengers safety of the aircraft and assumes when the seat belt button has to be switched on or off. [3] During en-route flight, they must obey:
113 Annexes 93 - The Air Traffic Controller from the sector in which they are flying in order to avoid collision, accidents and to ensure a safe flight. - The Flight Plan that they wrote before the flight where the flight path (waypoints) to follow is indicated. Unless, along the flight, pilots decide to change it and, immediately, they have to communicate this change to controllers in order that these ones authorize it provided that safety is always assured. All pilots and controllers must be related and coordinated in order to arrange, manage and control aircraft flight. This relation is very important, since the pilot who controls the aircraft and the controller who controls both know that it is very dangerous not to understand each other since it can generate certain tension and stress between them [2][3] Air Traffic Controllers and Pilots responsibilities Since wake vortex turbulence is considered invisible and pilots are not able to see it in order to apply proper avoidance procedures during Instrumental Meteorological Conditions (IMC), Air Traffic Controllers (ATCO) are the ones responsible for maintaining longitudinal separation distances between IFR aircraft and waketurbulence advisories to VFR aircraft, while providing radar vector service. It means that they have the responsibility of preventing the wake turbulence encounter [2][3]. So, ATCO responsibilities are: - Providing cautionary wake-turbulence information to assist pilots prior to their assuming visual responsibility for avoidance. - Issuing cautionary information to any aircraft if wake turbulence can have an adverse effect on it. - Providing separation during departure, arrival and cruise procedures. Aircraft can be separated by visual means, that is to say, when visual separation is assured because another previous separation is approved. For ensuring the latter,
114 94 UAS sensitivity to wake turbulence for establishing safety distance requirements controllers should consider aircraft performance, wake turbulence, closure rate, routes of flight and known weather condition. On en-route flight, controllers may use visual separation in lieu of radar separation in conjunction with visual approach procedures. When a pilot sees the other aircraft and is instructed to maintain visual separation from the aircraft: - The pilot receives the information of the other aircraft (position, direction, speed) by ATC. - Acknowledge is obtained from the pilot that the other aircraft is in sight. - The pilot is instructed to maintain visual separation from the other aircraft. - The pilot is advised if the radar targets appear likely to converge. - If the aircraft are converging, the other aircraft is informed of the traffic and that visual separation is applied. In addition to that, Pilots are also responsible for avoiding wake turbulence encounter. So, they are responsible for: - Acceptance of instructions from air traffic control (ATC) such as traffic information, instructions to follow and aircraft and the acceptance of a visual approach clearance in order to ensure safe take-off, land and cruise procedures. - Accepting the responsibility for providing wake turbulence separation. - Avoiding wake turbulence when: o Flying in VFR and not being vectored by ATC. o Maintaining visual separation. o Cleared for a visual approach. - Depending on the aircraft category, pilots have to use it in radio communications. - Pilots can request a waiver to the interval, if they consider possible wake turbulence effects. ATC may acknowledge this request as acceptance of responsibility for wake-turbulence separation. As the most dangerous wake turbulence encounters occur during take-off and land procedures, pilots will have more responsibilities during these stages of the flight.
115 Annexes 95 So, for helping pilots, when a wave turbulence encounter is likely to occur, ATC is required to provide a CAUTION WAKE TURBULENCE advisory when VFR aircraft are not being radar vectored and are behind heavy jets and to IFR aircraft that accept visual separation or a visual approach. As wake turbulence is variable, controllers may also use a wake-turbulence caution if, in their opinion, this perturbation can have an adverse effect on the aircraft. However, they are not responsible for anticipating its existence or effect Rules and Regulations Flight conditions Nowadays, there are some rules and regulations which are applied according to the visibility, the distance to clouds and the kind of airspace in order to let aircraft fly which are Visual Flight Rules (VFR), Instrumental Flight Rules (IFR) and Meteorological Conditions (MC). Visual Flight Rules (VFR) VFR is a set of aviation rules in order that a pilot to be able to operate an aircraft in weather conditions depending on visual references of the environment outside of the cockpit, so that he can control the aircraft s altitude, speed and heading and to be able to navigate and maintain a safe distance from obstacles such as terrain, structures and other aircraft. Pilots flying under VFR conditions have the responsibility for maintaining a distance from other aircraft, since routes or altitudes are not assigned by air traffic control. The essential collision safety principle by guiding the VFR pilot is see and avoid. Furthermore, VFR must take into account the meteorological conditions that have some requirements for VFR flight, accepted by Visual Meteorological Conditions (VMC). If this requirements are not met, they are considered instrument meteorological conditions and, in addition, a flight may only operate under IFR. The
116 96 UAS sensitivity to wake turbulence for establishing safety distance requirements IFR s operations need a specific training, experience, equipment and inspection requirements for the pilot and the aircraft. Instrumental Flight Rules (IFR) Like the rules previously explained, Instrument Flight Rules (IFR) are a set of regulations and procedures whereby navigation and obstacle clearance of an aircraft is maintained with reference to aircraft instruments. Otherwise, separation from other airplanes is provided by Air Traffic Control (ATC). This kind of rule can be used when pilots have low visibility due to the cockpit s instruments which provide to the pilot the information necessary to be able to fly between clouds. Pilots can fly between clouds in IFR Flight but not in VFR Flight because it is not allowed, therefore, IFR is an alternative to Visual Flight Rules. Weather Conditions (WC) One of the main purpose of IFR is the safe process of aircraft in Instrument Meteorological Conditions (IMC) although, normally, the weather is considered to be IMC when it does not meet the minimum requirements for Visual Meteorological Conditions (VMC). The boundary criteria between VMC and IMC are known as VMC minima. IFR flight is not concerned by the weather so it is allowed to fly in conditions of low visibility as, for example, when there are clouds. Despite that, an aircraft flying under IFR flight must always take into account the geographic conditions of the surrounding areas near to the airport to proceed to the takeoff and the landing. In aviation, Visual Meteorological Conditions (VMC) are those that allow an aircraft to fly under VFR flight, so that pilots have sufficient visibility to fly an aircraft maintaining visual separation from terrain and other aircraft. VMC is defined by certain visibility minimums, cloud ceilings and cloud clearances, (depending whether it is day or night as in some countries that night VFR is allowed). They usually require
117 Annexes 97 greater visibility and cloud clearance in controlled airspace than in uncontrolled airspace, in which there is less risk of a VFR aircraft colliding with an IFR emerging between clouds. Therefore, aircrafts can be flown closer to clouds. However, in Class B airspace class, a lower cloud clearance is required. Instrument Meteorological Conditions (IMC) is an aviation term that describes weather conditions that are required by pilots to fly by reference to instruments, therefore, under IFR is more preferable that under VFR. It is defined as less than the minima specified for VMC. When pilots have good visibility, they can determine the attitude of the aircraft by using visual cues from outside the aircraft (the horizon) but if they do not have such clues at their disposal they must use the internal clue of attitude that is provided by an Attitude Indicator ( or Artificial Horizon ). The availability of a good horizon is, of course, controlled by meteorological conditions that are very important in order to avoid the terrain. Summarizing both definitions, the next table shown when they can be applied: Visibility Ceiling VMC > 3 miles > 5,000ft MMC 13 3 miles 1,000ft < ceiling < 5,000ft IMC < 3 miles < 1,000ft Table 22. Meteorological Conditions Categories Separation In air traffic control, separation is the concept of keeping an aircraft in a minimum distance from another aircraft or obstacle to reduce risk of collisions, depending of meteorological visibility conditions and known VFR aircraft by applying a flight 13 MMC: Marginal Meteorological Conditions
118 98 UAS sensitivity to wake turbulence for establishing safety distance requirements clearance based on route, time, distance, speed, and altitude differences between aircraft. Separation is usually used in the two kind of airspace existing. In controlled airspace, ATC separates IFR aircraft from obstacles and other IFR. In uncontrolled airspace, IFR aircraft do not requires clearance and they separate themselves from each other by using charted minimum altitudes to avoid terrain and obstacles. For that, there are different separations between aircraft, altitudes, etc. - Vertical separation: Between the surface and an altitude of 29,000ft (8,800m), no aircraft should be closer vertically than 1,000ft (305m). Above that altitude, no aircraft shall come closer than 2,000ft (600m) except in the airspace where RVSM can be applied. - Horizontal separation: A horizontal separation must exist if two aircraft are separated by less than the vertical separation minimum. It is based on a procedural separation which uses upon reports made by the pilots over radio. It requires the use of the radar. - Lateral separation: A lateral separation minimum is based on the position of the aircraft when it is derived visually through radio navigation aids. Other lateral separation may be defined by the geography of pre-determined routes. When it is based in beacons, the aircraft must be a certain distance from the beacons and their tracks. - Longitudinal separation: It is known that an aircraft is flying with a longitudinal separation, and not flying with lateral separation. This is due to that the aircraft followed by tracks within 45 degrees of each tower so it follows the same route and requires a longitudinal separation. It is based upon time or distance as measure by DME. - Radar separation: This separation is applied by a controller through radar display, from where controllers can see two aircraft at a certain minimum horizontal distance away from each other. Since radar they can control those two aircraft and ensure a certain minimum safety distance or go modifying the altitude, speed, depending on where and how the aircraft is. The actual distance used is 5NM (9km) in the airspace, 3NM (5.56km) in terminal airspace at lower levels or 10 NM (18.52km) if there is less reliable radar cover. - Reduced separation: Controllers may reduce separation below the required minima.
119 Annexes In the vicinity of an aerodrome: From the Control Tower, a controller can see aircraft in the vicinity of the aerodrome or airport. The large windows of the tower allow a high visibility. If two aircraft arrive at the aerodrome and they are unable to see each other, they must immediately inform it to the controller who will reduce the standard separation necessary to avoid a possible collision. 2. RVSM (Reduced Vertical Separation Minima): is an aviation term that is used to describe the reduction of the standard vertical separation required between aircraft flying at levels between FL290 (29,000ft) and FL410 (41,000ft) from 2,000ft to 1,000ft. This increases the number of aircraft flying safely through airspace. These aircraft have a more modern altimeter and autopilot system. RVSM airspace encompasses Europe, North America, parts of Asia and Africa and Pacific and Atlantic Oceans. Wake vortex encounters, during cruise flight, are more likely to happen with climbing or descending aircraft. Therefore, it means that the introduction of RVSM airspace keeps authorities worried due to the idea of reduction from 2,000ft to 1,000ft between FL290 and FL410, since wake vortex turbulence may still have effects until 1,000ft below of its initial origin, as I mentioned above. For this reason, ICAO lays down strict rules about the permitted space between aircraft, based on the size, which are going to be explained in the following chapter.

120 100 UAS sensitivity to wake turbulence for establishing safety distance requirements 7.2. ANNEX 2: FLIGHT LEVEL CHART Figure 69. Flight Level Chart [4]

121 Annexes ANNEX 3: WAKE VORTEX MODEL IN LITERATURE To make it simple, two departing aircraft from the airport of Barcelona have been used in order to generate the wake turbulence area. The plots obtained and plotted on this paper are coming from the flight with ID VLG8744. Figure 70. Trajectory of the first plane with ID AAF235

![Procedure for performing the simulation [5] 7.3.1. Selection of data As I have mentioned previously, the airport selected is Barcelona's.](/docs-images/86/93695019/images/122-1.jpg "Two aircraft, departing or landing, have been chosen in order to run the program.")
122 102 UAS sensitivity to wake turbulence for establishing safety distance requirements Figure 71. Trajectory of the second plane with ID VLG8744 The idea of modeling the wake turbulence envelope follows the next scheme. Figure 72. Procedure for performing the simulation [5] Selection of data As I have mentioned previously, the airport selected is Barcelona's. Two aircraft, departing or landing, have been chosen in order to run the program. However, results are not going to be as accurate as it is wished due to the lack of information from some files and an incomplete GMU table. But, it is going to be a closer approach to
123 Annexes 103 the real results and it can give an idea of how wake turbulence envelope might be in 2D. From both aircraft, their flight track data from Radar have been used and it provides the flight identification (the airline and flight number), the aircraft type, the position (latitude and longitude), altitude, ground speed and heading. Altitude Ground Flight Flight Latitude Longitude Time (h) (ft) Speed Number ID (Rad) (Rad) (100*ft) (kt) Heading 1 AAF AAF AAF AAF AAF Table 23. Sample Flight track data Moreover, other aircraft properties must be taken into account because they play an important role in the generation of wake vortices. These ones are the aircraft's weight and wingspan. Aircraft Information Flight Record Departure Airport Aircraft Types Wake Class MALW (kg) MTOW (kg) Wingspan (m) OEW (kg) 1 LEBL A380 Super Heavy LEBL B747 Heavy LEBL B757 Medium LEBL C525 Light Table 24. Sample Aircraft Information
124 104 UAS sensitivity to wake turbulence for establishing safety distance requirements Aircraft mass As it is known, from the moment that an aircraft takes off until it lands, it loses fuel and, therefore, weight. This is the reason for which the exact mass of an aircraft cannot be acquired and, hence, an approximation of the mass has to be performed. Recognizing that the mass of any given aircraft type can vary based on the distance the aircraft will be travelling (for departing aircraft) or the distance that has been traversed (for arriving aircraft), the aircraft will be distributed across a range of possible mass values. For arriving aircraft, the calculation comes from three equations [5]: 1. The first's establishes the Mean Landing Weight (MLW) (1) (1.1) OEW is the Operating Empty Weight of the aircraft, mwf is the mean weight factor and MALW is the maximum allowable landing weight. 2. The second's computes the mass variation (MV) based on normal random distribution and with some standard deviation. (2) (1.2) randn(1,1) is a pseudrorandom number generated from a normal distribution with mean of 0 and standard deviation 1. The std is the standard deviation of aircraft mass. 3. The third's computes the actual aircraft mass (AAM) (3) (1.3) For departing aircraft, the calculation is similar to the previous one. (1) (2) (3) (1.4) (1.5) (1.6) The standard deviation and the mean weight factor are shown in the next table.
125 Annexes 105 Aircraft Mass Distribution Departures Arrivals Wake Class Mean SD Mean SD Super-heavy Heavy B Medium Light Table 25. Mean and Standard Deviation of Aircraft Mass [5] Wake Turbulence envelope For generating the Wake envelope, the three main parameters that determine its size/shape have to be taken into account. It is also important to account with the shape of the wing, that is to say, if this is rectangular or elliptical. For this case, an elliptical wing is going to be considered and s, which is a rotational constant, will be taken as π/4 [6][7]. 1. Circulation strength (CS) is the strength produced due to the circular motion of the wake vortices. The initial circulation strength ( ) is the one produced at the initial moment in time where the wake leaver the aircraft wing and it depends on the aircraft's mass, air density, wingspan and the aircraft velocity. (1.7) From this equation, the normalized circulation is calculated by the division between the Circulation Threshold and the Initial Circulation Strength. The Circulation threshold represents the minimum of wake circulation needed to pose some type of risk to encountering aircraft. (1.8)
126 106 UAS sensitivity to wake turbulence for establishing safety distance requirements 2. Eddy Dissipation Rate (EDR) measures the atmospheric turbulence that can affect how rapidly the wake dissipates. Higher values of EDR indicate stronger atmospheric turbulence and thus tend to undermine the circulation of the wake vortices and cause them to dissipate faster. Its normalized value is calculated in the next equation. (1.9)
127 Annexes 107 Figure 73. EDR table definition Where b 0 is the spacing initial, where the wake is generated on the wing, and it is calculated by the rotational constant (s) per the wingspan (B). (1.10) 3. Brunt - Vaïsala Frequency (BVF) measures the vertical gradient of the temperature in the atmosphere. It also measures the buoyancy of the aircraft whereby the wake can swing. Against higher values of the buoyancy, more rapidly the wake dissipates, but also cause the wake to rise instead of sinking.
128 108 UAS sensitivity to wake turbulence for establishing safety distance requirements A rising wake could influence the chance that another aircraft may encounter the wake. (1.11) This equation describes the computation of the normalized BVF where t 0 is the initial time in seconds. (1.12) These two last parameters are really important since the atmosphere plays an important role in the dissipation of the wake. The atmospheric condition which has the greatest effect on the evolution of the wake vortex is the stratification [8], frequently described by the Brunt - Vaïsala Frequency Air density The density of the air, ρ, has to be taken into account because it varies with the altitude in which the aircraft is flying. To higher altitudes, lower altitudes. For this case, it is assumed that the aircraft will fly in the first layer of the atmosphere, that is to say, in the troposphere which goes from 0 to 11km, according to ISA (International Standard Atmosphere).
129 Annexes 109 Figure 74. ISA temperature distribution [9] For this reason, the density of the air will be calculated as follows [9]: (1.13) Where ρ 0 is the density of the air at 0m, a is the thermal gradient which corresponds to K/m in the troposphere, R is the ideal gas constant and T 0 is the temperature at sea level.
130 110 UAS sensitivity to wake turbulence for establishing safety distance requirements 7.4. ANNEX 4: COORDINATE REFERENCES FRAME ECEF means Earth - Centered, Earth - Fixed or also called Conventional Terrestrial System (CTS). It is the Cartesian coordinate frame of references used in GPS. It uses three - dimensional XYZ coordinates (in meters) to describe the location of a GPS user or satellite. In this case, it will be the position of the aircraft which is wanted to be studied. The term "Earth - Centered" means that the origin of the axis is located at the mass center of gravity and the term "Earth - Fixed" means that the axis are fixed with respect to the earth and it rotates, over the Z axis, with the earth. Figure 75. ECEF coordinate references frame LLA means Latitude, Longitude and Altitude. It is the one called geodetic - mapping coordinates which consists of drawing an imaginary grid composed by parallels and meridians. As the geoid surface is two - dimensional, two parameters are needed in order to specify the position which are the latitude and longitude. As all points are going to be referenced to the center of the Earth, it is needed to take into account that the Earth is an ellipsoid. This is why a series of parameters that define the ellipsoid are necessary. Such parameters, shown in Figure 47, are: Semi - major axis (a) Semi - minor axis (b) First eccentricity (e)
131 Annexes 111 Second centricity (e') Flattering (f) Figure 76. Ellipsoid parameters It will allow to convert from ECEF to LLA or from LLA to ECEF, depending on what it is wanted to show or to do. And, for rotating it over the Earth Surface in 3D regarding to its center, a rotation matrix has to be used. Figure 77. 3D Rotation Matrix Where X, Y and Z are matrices of points which are wanted to be evaluated. In this program, the wake turbulence will be drawn as a set of planes.
132 112 UAS sensitivity to wake turbulence for establishing safety distance requirements a) From LLA to ECEF Regarding what it has been said, LLA coordinates can be converted to ECEF as it follows. Figure 78. LLA to ECEF b) From ECEF to LLA In the same way as before, ECEF coordinated can be converted as it follows. Figure 79. ECEF to LLA
133 Annexes 113 Figure 80. Geocentric and Geodetic Latitudes c) From NED to ECEF As all points are referred to the Earth center, it is needed a system which is able to compute it. This is the NED (North - East - Down) system or also known as Local Tangent Plane (LTP). It is a geographical system for representing state vectors. Figure 81. NED reference frame
134 114 UAS sensitivity to wake turbulence for establishing safety distance requirements It consists of three numbers: one represents the position along the northern axis, one along the eastern axis and the last one represents vertical positions. Figure 82. Matrix Rotation This system will allow the wake turbulence to move along the flight plan in Google Earth, since all points are well - referred.
135 Annexes ANNEX 5: INHULL FUNCTION function in = inhull(testpts,xyz,tess) % inhull: tests if a set of points are inside a convex hull % usage: in = inhull(testpts,xyz) % usage: in = inhull(testpts,xyz,tess) % usage: in = inhull(testpts,xyz,tess,tol) % % arguments: (input) % testpts - nxp array to test, n data points, in p dimensions % If you have many points to test, it is most efficient to % call this function once with the entire set. % % xyz - mxp array of vertices of the convex hull, as used by % convhulln. % % tess - tessellation (or triangulation) generated by convhulln % If tess is left empty or not supplied, then it will be % generated. % % tol - (OPTIONAL) tolerance on the tests for inclusion in the % convex hull. You can think of tol as the distance a point % may possibly lie outside the hull, and still be perceived % as on the surface of the hull. Because of numerical slop % nothing can ever be done exactly here. I might guess a % semi-intelligent value of tol to be % tol = 1.e-13*mean(abs(xyz(:))); % In higher dimensions, the numerical issues of floating % point arithmetic will probably suggest a larger value % of tol. % % DEFAULT: tol = 0 % % arguments: (output) % in - nx1 logical vector % in(i) == 1 --> the i'th point was inside the convex hull. % % Example usage: The first point should be inside, the second out % % xy = randn(20,2); tess = convhulln(xyz); % testpoints = [ 0 0; 10 10]; % in = inhull(testpoints,xy,tess) % % in = % 1 % 0 % % A non-zero count of the number of degenerate simplexes in the hull % will generate a warning (in 4 or more dimensions.) This warning % may be disabled off with the command: % % warning('off','inhull:degeneracy') % % See also: convhull, convhulln, delaunay, delaunayn, tsearch, tsearchn % % Author: John D'Errico % woodchips@rochester.rr.com
136 116 UAS sensitivity to wake turbulence for establishing safety distance requirements % Release: 3.0 % Release date: 10/26/06 % get array sizes % m points, p dimensions p = size(xyz,2); [n,c] = size(testpts); if p ~= c error 'testpts and xyz must have the same number of columns' end if p < 2 error 'Points must lie in at least a 2-d space.' end % was the convex hull supplied? if (nargin<3) isempty(tess) tess = convhulln(xyz); end [nt,c] = size(tess); if c ~= p error 'tess array is incompatible with a dimension p space' end % was tol supplied? if (nargin<4) isempty(tol) tol = 0; end % build normal vectors switch p case 2 % really simple for 2-d nrmls = (xyz(tess(:,1),:) - xyz(tess(:,2),:)) * [0 1;-1 0]; % Any degenerate edges? del = sqrt(sum(nrmls.^2,2)); degenflag = (del<(max(del)*10*eps)); if sum(degenflag)>0 warning('inhull:degeneracy',[num2str(sum(degenflag)),... ' degenerate edges identified in the convex hull']) % we need to delete those degenerate normal vectors nrmls(degenflag,:) = []; nt = size(nrmls,1); end case 3 % use vectorized cross product for 3-d ab = xyz(tess(:,1),:) - xyz(tess(:,2),:); ac = xyz(tess(:,1),:) - xyz(tess(:,3),:); nrmls = cross(ab,ac,2); degenflag = false(nt,1); otherwise % slightly more work in higher dimensions, nrmls = zeros(nt,p); degenflag = false(nt,1); for i = 1:nt % just in case of a degeneracy % Note that bsxfun COULD be used in this line, but I have chosen to % not do so to maintain compatibility. This code is still used by % users of older releases.
137 Annexes 117 % nullsp = null(bsxfun(@minus,xyz(tess(i,2:end),:),xyz(tess(i,1),:)))'; nullsp = null(xyz(tess(i,2:end),:) - repmat(xyz(tess(i,1),:),p- 1,1))'; if size(nullsp,1)>1 degenflag(i) = true; nrmls(i,:) = NaN; else nrmls(i,:) = nullsp; end end if sum(degenflag)>0 warning('inhull:degeneracy',[num2str(sum(degenflag)),... ' degenerate simplexes identified in the convex hull']) end % we need to delete those degenerate normal vectors nrmls(degenflag,:) = []; nt = size(nrmls,1); end % scale normal vectors to unit length nrmllen = sqrt(sum(nrmls.^2,2)); % again, bsxfun COULD be employed here... % nrmls = bsxfun(@times,nrmls,1./nrmllen); nrmls = nrmls.*repmat(1./nrmllen,1,p); % center point in the hull center = mean(xyz,1); % any point in the plane of each simplex in the convex hull a = xyz(tess(~degenflag,1),:); % ensure the normals are pointing inwards % this line too could employ bsxfun... % dp = sum(bsxfun(@minus,center,a).*nrmls,2); dp = sum((repmat(center,nt,1) - a).*nrmls,2); k = dp<0; nrmls(k,:) = -nrmls(k,:); % We want to test if: dot((x - a),n) >= 0 % If so for all faces of the hull, then x is inside % the hull. Change this to dot(x,n) >= dot(a,n) an = sum(nrmls.*a,2); % test, be careful in case there are many points in = false(n,1); % if n is too large, we need to worry about the % dot product grabbing huge chunks of memory. memblock = 1e6; blocks = max(1,floor(n/(memblock/nt))); anr = repmat(an,1,length(1:blocks:n)); for i = 1:blocks j = i:blocks:n; if size(anr,2) ~= length(j), anr = repmat(an,1,length(j)); end in(j) = all((nrmls*testpts(j,:)' - anr) >= -tol,1)'; end

138 118 UAS sensitivity to wake turbulence for establishing safety distance requirements In order to make this function works, a 2D matrix of N columns per M rows is needed. From the program, a 3D matrix is obtained which saves the aircraft location and the vortices of each calculated plane of the wake turbulence, computed behind of it in the computational method. This 3D matrix is defined as "data1" and its size is formed by N planes, 5 points and 3 coordinates (Longitude, Latitude and Altitude) and it is shown in next figure: Figure 83. Data1-3D matrix However, what it is needed is a 2D matrix. Consequently, the previous matrix must be concatenated to 2D and a new matrix in 2D will be obtained which will be called "data8".
139 Annexes 119 Concatenating means passing from a 3D matrix to a 2D matrix as it is shown in the following pictures: Figure 84. 3D matrix which corresponds to "data1" Figure 85. 2D Matrix which corresponds to "data8" Therefore, the new matrix will take the vortices values of data1 and will introduce them in a row and its corresponding columns. This is why the size of "data8" will be N planes per 5 vortices and 3 coordinates (Longitude, Latitude and Altitude) and it is shown in next figure:
140 120 UAS sensitivity to wake turbulence for establishing safety distance requirements Figure 86. data8 matrix. Size of N*5 rows and 3 columns Once it is done, in each vertex of the wake turbulence it is going to be drawn a circle as it is shown in the next figure.

141 Annexes 121 Figure 87. Concatenating values
CAUTION: WAKE TURBULENCE
 CAUTION: WAKE TURBULENCE This was the phrase issued while inbound to land at Boeing Field (BFI) while on a transition training flight. It was early August, late afternoon and the weather was clear, low
SAFE WINGS. This issue WAKE-UP TO WAKE TURBULENCE. * For Internal Circulation Only
 * For Internal Circulation Only SAFE WINGS Flight Safety Magazine of Air India, Air India Express and Alliance Air Issue 59, APRIL 2017 This issue WAKE-UP TO WAKE TURBULENCE SAFE WINGS April Edition 59
Wake Turbulence All aircraft produce wake turbulence, which consists of wake vortices formed any time an airfoil is producing lift.
 Wake Turbulence Wake Turbulence All aircraft produce wake turbulence, which consists of wake vortices formed any time an airfoil is producing lift. 2 Wake Turbulence Occurrences Many pilots have received
2. CANCELLATION. AC 90-23F, Aircraft Wake Turbulence, dated February 20, 2002, is canceled.
 U.S. Department of Transportation Federal Aviation Administration Advisory Circular Subject: Aircraft Wake Turbulence Date: 2/10/14 Initiated by: AFS-400 AC No: 90-23G Change: 1. PURPOSE. This advisory
Wake Turbulence Standards
 Recategorization of ICAO Wake Turbulence Standards RECAT Phase I Overview Joint FAA/EUROCONTROL Project Three year study (25 meetings) RECAT Team Comprised of worldwide wake turbulence and aviation experts
Section 3. Wake Turbulence
 1 of 12 7/31/2014 4:19 PM AIM 7/24/14 Section 3. Wake Turbulence 7-3-1. General a. Every aircraft generates a wake while in flight. Initially, when pilots encountered this wake in flight, the disturbance
Appendix B Ultimate Airport Capacity and Delay Simulation Modeling Analysis
 Appendix B ULTIMATE AIRPORT CAPACITY & DELAY SIMULATION MODELING ANALYSIS B TABLE OF CONTENTS EXHIBITS TABLES B.1 Introduction... 1 B.2 Simulation Modeling Assumption and Methodology... 4 B.2.1 Runway
Effective: AIRCRAFT WAKE TURBULENCE
 AUSTRALIA AERONAUTICAL INFORMATION SERVICE AIRSERVICES AUSTRALIA GPO BOX 67, CANBERRA ACT 2601 Phone: 02 6268 4874 Email: aim.editorial@airservicesaustralia.com Effective: AERONAUTICAL INFORMATION CIRCULAR
ASSEMBLY 37TH SESSION
 International Civil Aviation Organization WORKING PAPER 27/9/10 ASSEMBLY 37TH SESSION TECHNICAL COMMISSION Agenda Item 46: Other business to be considered by the Technical Commission CURRENT ASPECTS OF
Wake Turbulence Research Modeling
 Wake Turbulence Research Modeling John Shortle, Lance Sherry Jianfeng Wang, Yimin Zhang George Mason University C. Doug Swol and Antonio Trani Virginia Tech Introduction This presentation and a companion
CEE Quick Overview of Aircraft Classifications. January 2018
 CEE 5614 Quick Overview of Aircraft Classifications Dr. Antonio A. Trani Professor Civil and Environmental Engineering January 2018 1 Material Presented The aircraft and its impact operations in the NAS
AIR LAW AND ATC PROCEDURES
 1 The International Civil Aviation Organisation (ICAO) establishes: A standards and recommended international practices for contracting member states. B aeronautical standards adopted by all states. C
Pre-Solo and BFR Written
 Sky Sailing,Inc 31930 Highway 79 Warner Springs Ca 92086 e-mail soar@skysailing.com www.skysailing.com (760) 782-0404 Fax 782-9251 Safety Is No Accident Choose the most correct answer: Pre-Solo and BFR
Worst-case analysis of wake vortex induced risk of 700ft vertical separation. Gerben van Baren
 Worst-case analysis of wake vortex induced risk of 700ft vertical separation Gerben van Baren Contents Incentive Objective Approach Results Conclusions NLR Air Transport Safety Institute 15-1-2009 2 Incentive
CHAPTER 5 SEPARATION METHODS AND MINIMA
 CHAPTER 5 SEPARATION METHODS AND MINIMA 5.1 Provision for the separation of controlled traffic 5.1.1 Vertical or horizontal separation shall be provided: a) between IFR flights in Class D and E airspaces
Date: 5 November East of Frankfurt/Main
 Bundesstelle für Flugunfalluntersuchung German Federal Bureau of Aircraft Accident Investigation Factual Report The Investigation Report was written in accordance with para 18 of the Law Relating to the
IFR SEPARATION USING RADAR
 IFR SEPARATION USING RADAR 1. Introduction When flying IFR inside controlled airspace, air traffic controllers either providing a service to an aircraft under their control or to another controller s traffic,
SECTION 6 - SEPARATION STANDARDS
 SECTION 6 - SEPARATION STANDARDS CHAPTER 1 - PROVISION OF STANDARD SEPARATION 1.1 Standard vertical or horizontal separation shall be provided between: a) All flights in Class A airspace. b) IFR flights
Runway Length Analysis Prescott Municipal Airport
 APPENDIX 2 Runway Length Analysis Prescott Municipal Airport May 11, 2009 Version 2 (draft) Table of Contents Introduction... 1-1 Section 1 Purpose & Need... 1-2 Section 2 Design Standards...1-3 Section
USE OF RADAR IN THE APPROACH CONTROL SERVICE
 USE OF RADAR IN THE APPROACH CONTROL SERVICE 1. Introduction The indications presented on the ATS surveillance system named radar may be used to perform the aerodrome, approach and en-route control service:
SAFETYSENSE LEAFLET 15c WAKE VORTEX
 SAFETYSENSE LEAFLET 15c WAKE VORTEX photos: Bob Stoyles, Cathay Pacific via Crewsnews 1 INTRODUCTION 2 VORTEX ENCOUNTERS 3 AIR TRAFFIC CONTROL 4 AVOIDANCE APPROACH 5 AVOIDANCE DEPARTURE 1 INTRODUCTION
ACCIDENT. Aircraft Type and Registration: Piper PA Cherokee, G-BRWO. No & Type of Engines: 1 Lycoming O-320-E3D piston engine
 ACCIDENT Aircraft Type and Registration: No & Type of Engines: Piper PA-28-140 Cherokee, G-BRWO 1 Lycoming O-320-E3D piston engine Year of Manufacture: 1973 Date & Time (UTC): Location: Type of Flight:
AIRBUS FlyByWire How it really works
 AIRBUS FlyByWire How it really works Comparison between APOLLO s and Phoenix PSS Airbus FlyByWire implementation for FS2002 Copyright by APOLLO Software Publishing The FlyByWire control implemented on
Wake Turbulence: Managing Safety and Capacity. Bram Elsenaar co-ordinator of the European Thematic Network WakeNet2-Europe
 Wake Turbulence: Managing Safety and Capacity Bram Elsenaar co-ordinator of the European Thematic Network WakeNet2-Europe Outline What s the problem? Present ruling Possible changes and benefits How to
CHAPTER 6:VFR. Recite a prayer (15 seconds)
") CHAPTER 6:VFR Recite a prayer (15 seconds) ATM TOPIC 1. INTRODUCTION TO AIR TRAFFIC MANAGEMENT,TYPE OF CONTROL AREAS & FLIGHT PLAN 2. AERODROME CONTROL 3. AREA CONTROL 4. APPROACH CONTROL --------------------------------------mid-term
CHAPTER 6:VFR Recite a prayer (15 seconds) ATM TOPIC 1. INTRODUCTION TO AIR TRAFFIC MANAGEMENT,TYPE OF CONTROL AREAS & FLIGHT PLAN 2. AERODROME CONTROL 3. AREA CONTROL 4. APPROACH CONTROL --------------------------------------mid-term
Wake Encounter In-Situ Flight Tests in Cruise - Wake Characterization
 Wake Encounter In-Situ Flight Tests in Cruise - Wake Characterization Dietrich Fischenberg Carsten Schwarz DLR - Institute of Flight Systems Braunschweig, Germany DLR Weather & Flying Final Colloquium
LFPG / Paris-Charles de Gaulle / CDG
 This page is intended to draw commercial and private pilots attention to the aeronautical context and main threats related to an aerodrome. They have been identified in a collaborative way by the main
ACAS on VLJs and LJs Assessment of safety Level (AVAL) Outcomes of the AVAL study (presented by Thierry Arino, Egis Avia)
 Outcomes of the AVAL study (presented by Thierry Arino, Egis Avia)") ACAS on VLJs and LJs Assessment of safety Level (AVAL) Outcomes of the AVAL study (presented by Thierry Arino, Egis Avia) Slide 1 Presentation content Introduction Background on Airborne Collision Avoidance
ACAS on VLJs and LJs Assessment of safety Level (AVAL) Outcomes of the AVAL study (presented by Thierry Arino, Egis Avia) Slide 1 Presentation content Introduction Background on Airborne Collision Avoidance
Lessons Learnt From The EUROCONTROL Wake Impact Severity Assessment Flight Simulator Campaign
 Lessons Learnt From The EUROCONTROL Wake Impact Severity Assessment Flight Simulator Campaign Vincent Treve (EUROCONTROL) Cpt. Dirk De Winter (Contrator to EUROCONTROL) Content Objectives Experiment setup
WAKE TURBULENCE SEPARATION MINIMA
 1. Definition WAKE TURBULENCE SEPARATION MINIMA Wake turbulence is turbulence that forms behind an aircraft as it passes through the air, causing wingtip vortices. 2. Radar wake turbulence separation minima
Establishing a Risk-Based Separation Standard for Unmanned Aircraft Self Separation
 Establishing a Risk-Based Separation Standard for Unmanned Aircraft Self Separation Roland E. Weibel, Matthew W.M. Edwards, and Caroline S. Fernandes MIT Lincoln laboratory Surveillance Systems Group Ninth
AIRMAN S INFORMATION MANUAL. Enroute
 AIRMAN S INFORMATION MANUAL AIM 52 AIRPORT LIGHTING AND MARKING AIDS Airport Beacons Operation of the airport rotating beacon during the daytime indicates the weather in the Class D airspace is below basic
NOISE ABATEMENT PROCEDURES
 1. Introduction NOISE ABATEMENT PROCEDURES Many airports today impose restrictions on aircraft movements. These include: Curfew time Maximum permitted noise levels Noise surcharges Engine run up restrictions
WakeNet3-Europe Concepts Workshop
 WakeNet3-Europe Concepts Workshop Benefits of Conditional Reduction of Wake Turbulence Separation Minima London, 09.02.2011 Jens Konopka (jens.konopka@dfs.de) DFS Deutsche Flugsicherung GmbH 2 Outline
NOTE TO MEMBERS #24 22 MAR 2017
 SUBJECT: ENROUTE WAKE TURBULENCE REVISED: 22 MAR 2017. CIRCULATION: PUBLIC SHARE FREELY. Situation/Event In January 2017, a Challenger 604 passed 1000 feet underneath an opposite direction Airbus 380,
3) There have some basic terminology of a flight plan and it is the fuel calculations
 There have some basic terminology of a flight plan and it is the fuel calculations") QUESTION BANK FLIGHT PLANNING (CHAPTER 1) Introduction to Flight Planning 1) It is a duty of flight operation officer (FOO) to do a flight plan before the aircraft want to fly. a) i. Give the definition
QUESTION BANK FLIGHT PLANNING (CHAPTER 1) Introduction to Flight Planning 1) It is a duty of flight operation officer (FOO) to do a flight plan before the aircraft want to fly. a) i. Give the definition
TCAS Pilot training issues
 November 2011 TCAS Pilot training issues This Briefing Leaflet is based in the main on the ACAS bulletin issued by Eurocontrol in February of 2011. This Bulletin focuses on pilot training, featuring a
CESSNA SECTION 5 PERFORMANCE
 CESSNA SECTION 5 TABLE OF CONTENTS Page Introduction............................................5-3 Use of Performance Charts................................5-3 Sample Problem........................................5-4
CEE 5614 and CEE Aircraft Classifications. Spring 2013
 CEE 5614 and CEE 4674 Aircraft Classifications Dr. Antonio A. Trani Professor Civil and Environmental Engineering Spring 2013 1 Material Presented The aircraft and the airport Aircraft classifications
Airspace Encounter Models for Conventional and Unconventional Aircraft
 Airspace Encounter Models for Conventional and Unconventional Aircraft Matthew W. Edwards, Mykel J. Kochenderfer, Leo P. Espindle, James K. Kuchar, and J. Daniel Griffith Eighth USA/Europe Air Traffic
Real-time Simulations to Evaluate the RPAS Integration in Shared Airspace
 Real-time Simulations to Evaluate the RPAS Integration in Shared Airspace (WP-E project ERAINT) E. Pastor M. Pérez-Batlle P. Royo R. Cuadrado C. Barrado 4 th SESAR Innovation Days Universitat Politècnica
IFR SEPARATION WITHOUT RADAR
 1. Introduction IFR SEPARATION WITHOUT RADAR When flying IFR inside controlled airspace, air traffic controllers either providing a service to an aircraft under their control or to another controller s
APPENDIX F AIRSPACE INFORMATION
 APPENDIX F AIRSPACE INFORMATION Airspace Use DEFINITION OF AIRSPACE Airspace, or that space which lies above a nation and comes under its jurisdiction, is generally viewed as being unlimited. However,
ATC-Wake: Integrated Air Traffic Control Wake Vortex Safety and Capacity System
 ATC-Wake: Integrated Air Traffic Control Wake Vortex Safety and Capacity System L.J.P. (Lennaert) Speijker, speijker@nlr.nl WakeNet Europe, 8/9 January 2009 http://www.nlr.nl/public/hosted-sites/atc-wake
PRESOLO WRITTEN EXAM
 PRESOLO WRITTEN EXAM Date of Exam STUDENT INFORMATION Student Name Student Pilot Certificate Number FLIGHT INSTRUCTOR INFORMATION Instructor Instructor Certificate Number 1 INTRODUCTION Student Actions:
Research on Controlled Flight Into Terrain Risk Analysis Based on Bow-tie Model and WQAR Data
 2017 Asia-Pacific Engineering and Technology Conference (APETC 2017) ISBN: 978-1-60595-443-1 Research on Controlled Flight Into Terrain Risk Analysis Based on Bow-tie Model and WQAR Data Haofeng Wang,
ONE-ENGINE INOPERATIVE FLIGHT
 ONE-ENGINE INOPERATIVE FLIGHT 1. Introduction When an engine fails in flight in a turbojet, there are many things the pilots need to be aware of to fly the airplane safely and get it on the ground. This
Airfield Capacity Prof. Amedeo Odoni
 Airfield Capacity Prof. Amedeo Odoni Istanbul Technical University Air Transportation Management M.Sc. Program Air Transportation Systems and Infrastructure Module 10 May 27, 2015 Airfield Capacity Objective:
Safety Syllabus. VFR into IMC
 VFR into IMC A syllabus designed to help protect pilots against GA's most fatal type of weather-related accident: VFR into IMC. Recommended for use by flight instructors and schools. 2017 421 Aviation
LAPL(A)/PPL(A) question bank FCL.215, FCL.120 Rev OPERATIONAL PROCEDURES 070
/PPL(A) question bank FCL.215, FCL.120 Rev OPERATIONAL PROCEDURES 070") OPERATIONAL PROCEDURES 070 1 1 Which one of the following statements is false? An accident must be reported if, between the time that anyone boards an aircraft to go flying and until everyone has left
OPERATIONAL PROCEDURES 070 1 1 Which one of the following statements is false? An accident must be reported if, between the time that anyone boards an aircraft to go flying and until everyone has left
Number April 2016
 Luxembourg Air Safety Bulletin Number 16-001 - April 2016 This Air Safety Bulletin examines a number of hazards related to flying in and out, and in the vicinity of, Luxembourg Airport. As the Direction
Analysis of Operational Impacts of Continuous Descent Arrivals (CDA) using runwaysimulator
 using runwaysimulator") Analysis of Operational Impacts of Continuous Descent Arrivals (CDA) using runwaysimulator Camille Shiotsuki Dr. Gene C. Lin Ed Hahn December 5, 2007 Outline Background Objective and Scope Study Approach
Analysis of Operational Impacts of Continuous Descent Arrivals (CDA) using runwaysimulator Camille Shiotsuki Dr. Gene C. Lin Ed Hahn December 5, 2007 Outline Background Objective and Scope Study Approach
Aircraft Design: A Systems Engineering Approach, M. Sadraey, Wiley, 2012 Chapter 12 Design of Control Surfaces. Tables
 Aircraft Design: A Systems Engineering Approach, M. Sadraey, Wiley, 2012 Chapter 12 Design of Control Surfaces Tables No Term 1 Trim, balance, equilibrium Definition When the summations of all forces exerting
GENERAL INFORMATION Aircraft #1 Aircraft #2
 GENERAL INFORMATION Identification number: 2007075 Classification: Serious incident Date and time 1 of the 2 August 2007, 10.12 hours occurrence: Location of occurrence: Maastricht control zone Aircraft
Air Law. Iain Darby NAPC/PH-NSIL IAEA. International Atomic Energy Agency
 Air Law Iain Darby NAPC/PH-NSIL International Atomic Energy Agency Aviation Regulations International Civil Aviation Organisation (ICAO) Convention on International Civil Aviation also known as the Chicago
APPENDIX D MSP Airfield Simulation Analysis
 APPENDIX D MSP Airfield Simulation Analysis This page is left intentionally blank. MSP Airfield Simulation Analysis Technical Report Prepared by: HNTB November 2011 2020 Improvements Environmental Assessment/
Accident Prevention Program
 Accident Prevention Program WEIGHT AND BALANCE An Important Safety Consideration for Pilots Aircraft performance and handling characteristics are affected by the gross weight and center of gravity limits.
Airspace Complexity Measurement: An Air Traffic Control Simulation Analysis
 Airspace Complexity Measurement: An Air Traffic Control Simulation Analysis Parimal Kopardekar NASA Ames Research Center Albert Schwartz, Sherri Magyarits, and Jessica Rhodes FAA William J. Hughes Technical
DEMORPAS Project. Final Dissemination Forum. 10th March 2016, World ATM Congress, Madrid
 DEMORPAS Project Final Dissemination Forum 10th March 2016, World ATM Congress, Madrid Workshop Contents 1. Introduction to DEMORPAS Project 2. Operational environment 3. Exercises performed 4. Analysis
Decisions on which type of approach to use vary with each airline, and sometimes even for each flight. aero quarterly qtr_02 10
 Decisions on which type of approach to use vary with each airline, and sometimes even for each flight. 24 Fuel Conservation Strategies: Descent and Approach The descent and approach phases of flight represent
USE OF TAKEOFF CHARTS [B737]
![USE OF TAKEOFF CHARTS [B737]](/thumbs/84/90602989.jpg "USE OF TAKEOFF CHARTS [B737]") USE OF TAKEOFF CHARTS [B737] 1. Introducton This documentation presents an example of takeoff performance calculations for Boeing 737. It is called self-dispatch, primarily used by airline crew if that
USE OF TAKEOFF CHARTS [B737] 1. Introducton This documentation presents an example of takeoff performance calculations for Boeing 737. It is called self-dispatch, primarily used by airline crew if that
Outmaneuvered AIRFLOW
 Today s portable sensors and data-analysis techniques enable scientists worldwide to visualize dimensions, measure velocities and track positions of wake vortices generated by specific variants of large
OPERATIONS MANUAL PART A
 PAGE: 1 Table of Content A.GENERAL /CHAPTER 7 -....3 7.... 3 7.1 Minimum Flight Altitudes /Flight Levels VFR Flight... 3 7.2 Minimum Flight Altitudes /Flight Levels IFR Flight... 4 7.2.1 IFR flights non
Analyzing Risk at the FAA Flight Systems Laboratory
 Analyzing Risk at the FAA Flight Systems Laboratory Presented to: Workshop By: Dr. Richard Greenhaw, FAA AFS-440 Date: 29 November, 2005 Flight Systems Laboratory Who we are How we analyze risk Airbus
THE AREA CONTROL CENTRE (CTR) POSITION
 POSITION") THE AREA CONTROL CENTRE (CTR) POSITION 1. Introduction The Area Control Centre (ACC) also known as en-route controller and called CTR on IVAO, has the responsibility of ensuring Air Traffic Control (ATC)
THE AREA CONTROL CENTRE (CTR) POSITION 1. Introduction The Area Control Centre (ACC) also known as en-route controller and called CTR on IVAO, has the responsibility of ensuring Air Traffic Control (ATC)
University of Colorado, Colorado Springs Mechanical & Aerospace Engineering Department. MAE 4415/5415 Project #1 Glider Design. Due: March 11, 2008
 University of Colorado, Colorado Springs Mechanical & Aerospace Engineering Department MAE 4415/5415 Project #1 Glider Design Due: March 11, 2008 MATERIALS Each student glider must be able to be made from
Chapter 6. Airports Authority of India Manual of Air Traffic Services Part 1
 Chapter 6 6.1 ESSENTIAL LOCAL TRAFFIC 6.1.1 Information on essential local traffic known to the controller shall be transmitted without delay to departing and arriving aircraft concerned. Note 1. Essential
Santa Monica Flyers. Pre-Solo Knowledge Test. Aircraft Type to be flown solo:
 Santa Monica Flyers Pre-Solo Knowledge Test Name: Date: Aircraft Type to be flown solo: Answer the following questions in the space provided using the FARs, AIM, Charts, the AFM/POH for the airplane to
Wake Turbulence Recategorization (RECAT) ATC Human Factors Issues During Implementation. Terminal Services
 ATC Human Factors Issues During Implementation. Terminal Services") Wake Turbulence Recategorization (RECAT) ATC Human Factors Issues During Implementation Presented to: WakeNet Europe By: Joel Forrest, Human Solutions, Inc. Date: May 13, 2014 Terminal Services Overview
Wake Turbulence Recategorization (RECAT) ATC Human Factors Issues During Implementation Presented to: WakeNet Europe By: Joel Forrest, Human Solutions, Inc. Date: May 13, 2014 Terminal Services Overview
Comparative wake-turbulence assessments and findings for the B747-8
 WakeNet3-Europe February 2012 Comparative wake-turbulence assessments and findings for the B747-8 J.D. Crouch & M.J. Czech Boeing Commercial Airplanes JDC/MJC Feb12 1 Comparative wake-turbulence assessments
PLUME RISE ASSESSMENTS
 Advisory Circular AC 139-5(1) NOVEMBER 2012 PLUME RISE ASSESSMENTS CONTENTS Page 1. References 1 2. Purpose 2 3. Status of this advisory circular 2 4. Acronyms 2 5. Definitions 3 6. Background 3 7. Key
HARD. Preventing. Nosegear Touchdowns
 Preventing HARD Nosegear Touchdowns In recent years, there has been an increase in the incidence of significant structural damage to commercial airplanes from hard nosegear touchdowns. In most cases, the
Time-Space Analysis Airport Runway Capacity. Dr. Antonio A. Trani. Fall 2017
 Time-Space Analysis Airport Runway Capacity Dr. Antonio A. Trani CEE 3604 Introduction to Transportation Engineering Fall 2017 Virginia Tech (A.A. Trani) Why Time Space Diagrams? To estimate the following:
Pope Field, NC MID-AIR COLLISION AVOIDANCE
 Pope Field, NC MID-AIR COLLISION AVOIDANCE 2017 43 rd Air Mobility Operations Group Flight Safety, Pope Field, NC Tel: (910)394-8383/ 8389 Fax: (910)394-8098 E-mail:43AMOGW.SE1@US.AF.MIL The potential
THE TOWER CONTROL POSITION (TWR)
") 1. Introduction THE TOWER CONTROL POSITION (TWR) The Aerodrome Local Control, or Tower (called TWR) controller has the responsibility of ensuring Air Traffic Control (ATC) Services within a restricted
1. Introduction THE TOWER CONTROL POSITION (TWR) The Aerodrome Local Control, or Tower (called TWR) controller has the responsibility of ensuring Air Traffic Control (ATC) Services within a restricted
AIRCRAFT INCIDENT REPORT
 AIRCRAFT INCIDENT REPORT (cf. Aircraft Accident Investigation Act, No. 35/2004) M-04303/AIG-26 OY-RCA / N46PW BAe-146 / Piper PA46T 63 N, 028 W 1 August 2003 This investigation was carried out in accordance
EUROCONTROL AVAL Project. AVAL Phase 1 findings (presented by Thierry Arino)
") EUROCONTROL AVAL Project AVAL Phase 1 findings (presented by Thierry Arino) Slide 1 Presentation content Introduction Safety benefits of ACAS VLJs and LJs below 5,700 kg: what are they? What are the safety
EUROCONTROL AVAL Project AVAL Phase 1 findings (presented by Thierry Arino) Slide 1 Presentation content Introduction Safety benefits of ACAS VLJs and LJs below 5,700 kg: what are they? What are the safety
LAPL(A)/PPL(A) question bank FCL.215, FCL.120 Rev OPERATIONAL PROCEDURES 070
/PPL(A) question bank FCL.215, FCL.120 Rev OPERATIONAL PROCEDURES 070") OPERATIONAL PROCEDURES 070 1 Which one of the following statements is false? An accident must be reported if, between the time that anyone boards an aircraft to go flying and until everyone has left it:
OPERATIONAL PROCEDURES 070 1 Which one of the following statements is false? An accident must be reported if, between the time that anyone boards an aircraft to go flying and until everyone has left it:
Pilot RVSM Training Guidance Material
 Pilot RVSM Training Guidance Material Captain Souhaiel DALLEL IFALPA RVP AFI WEST RVSM Pilot Procedures ICAO requires states to establish for flight crews specific: Initial training programs and Recurrent
According to FAA Advisory Circular 150/5060-5, Airport Capacity and Delay, the elements that affect airfield capacity include:
 4.1 INTRODUCTION The previous chapters have described the existing facilities and provided planning guidelines as well as a forecast of demand for aviation activity at North Perry Airport. The demand/capacity
PLAN Anoka County - Blaine Airport
 Reliever Airports: NOISE ABATEMENT PLAN Anoka County - Blaine Airport INTRODUCTION The noise abatement plan for the Anoka County-Blaine Airport was prepared in recognition of the need to make the airport
INTERNATIONAL FEDERATION OF AIR TRAFFIC CONTROLLERS ASSOCIATIONS. Agenda Item: B.5.12 IFATCA 09 WP No. 94
 INTERNATIONAL FEDERATION OF AIR TRAFFIC CONTROLLERS ASSOCIATIONS 48 th ANNUAL CONFERENCE - Dubrovnik, 20 th to 24 th April 2009 Agenda Item: B.5.12 IFATCA 09 WP No. 94 Study Go Around Procedures When on
Guidance for Complexity and Density Considerations - in the New Zealand Flight Information Region (NZZC FIR)
") Guidance for Complexity and Density Considerations - in the New Zealand Flight Information Region (NZZC FIR) Version 1.0 Director NSS 14 February 2018 Guidance for Complexity and Density Considerations
Guidance for Complexity and Density Considerations - in the New Zealand Flight Information Region (NZZC FIR) Version 1.0 Director NSS 14 February 2018 Guidance for Complexity and Density Considerations
Consideration will be given to other methods of compliance which may be presented to the Authority.
 Advisory Circular AC 139-10 Revision 1 Control of Obstacles 27 April 2007 General Civil Aviation Authority advisory circulars (AC) contain information about standards, practices and procedures that the
a. Aeronautical charts DID THIS IN LESSON 2
 AIRMAN CERTIFICATION STANDARDS: REMOTE PILOT SMALL: You will know and be able to explain in writing or oral form the below tasks regarding AIRPORT OPERATIONS Task References Objective Task B. Airport Operations
6.0 JET ENGINE WAKE AND NOISE DATA. 6.2 Airport and Community Noise
 6.0 JET ENGINE WAKE AND NOISE DATA 6.1 Jet Engine Exhaust Velocities and Temperatures 6.2 Airport and Community Noise D6-58329 JULY 1998 93 6.0 JET ENGINE WAKE AND NOISE DATA 6.1 Jet Engine Exhaust Velocities
Wingsuit Design and Basic Aerodynamics 2
 WINGSUIT DESIGN AND BASIC AERODYNAMICS 2 In this article I would like to expand on the basic aerodynamics principles I covered in my first article (Wingsuit Flying Aerodynamics 1) and to explain the challenges
1. Background. 2. Summary and conclusion. 3. Flight efficiency parameters. Stockholm 04 May, 2011
 Stockholm 04 May, 2011 1. Background By this document SAS want to argue against a common statement that goes: Green departures are much more fuel/emission efficient than green arrivals due to the fact
LESSON PLAN Introduction (3 minutes)
") LESSON PLAN Introduction (3 minutes) ATTENTION: MOTIVATION: OVERVIEW: Relate aircraft accident in which a multi-engine airplane ran off the end of the runway. This could have been avoided by correctly
LESSON PLAN Introduction (3 minutes) ATTENTION: MOTIVATION: OVERVIEW: Relate aircraft accident in which a multi-engine airplane ran off the end of the runway. This could have been avoided by correctly
COLLISION AVOIDANCE FOR RPAS
 COLLISION AVOIDANCE FOR RPAS Johan Pellebergs, Saab Aeronautics ICAS workshop, September 2017 This document and the information contained herein is the property of Saab AB and must not be used, disclosed
AVIATION OCCURRENCE REPORT A98W0216 LOSS OF SEPARATION
 AVIATION OCCURRENCE REPORT A98W0216 LOSS OF SEPARATION BETWEEN AIR CANADA BOEING 747-238 C-GAGC AND AIR CANADA BOEING 747-400 C-GAGM 55 NORTH LATITUDE AND 10 WEST LONGITUDE 27 SEPTEMBER 1998 The Transportation
Approach-and-Landing Briefing Note Response to GPWS Pull-Up Maneuver Training
 Approach-and-Landing Briefing Note 6.3 - Response to GPWS Pull-Up Maneuver Training Introduction A typical awareness and training program for the reduction of approach-and-landing accidents involving controlled-flight-into-terrain
Chapter 16. Airports Authority of India Manual of Air Traffic Services Part RESPONSIBILITY IN REGARD TO MILITARY TRAFFIC
 Chapter 16 16.1 RESPONSIBILITY IN REGARD TO MILITARY TRAFFIC 16.1.1 It is recognized that some military aeronautical operations necessitate non-compliance with certain air traffic procedures. In order
SULAYMANIYAH INTERNATIONAL AIRPORT MATS CHAPTER 11
 KURDISTAN REGIONAL GOVERNMENT SULAYMANIYAH INTERNATIONAL AIRPORT MATS CHAPTER 11 SEPARATION STANDARDS & APPLICATIONS International and Local Procedures ( First Edition ) April 2012 Ff Prepared By Fakhir.F.
WAKE TURBULENCE RE-CATEGORISATION ON APPROACH AND DEPARTURE FOR SAFE AND MORE EFFICIENT AIR TRAFFIC MANAGEMENT
 WAKE TURBULENCE RE-CATEGORISATION ON APPROACH AND DEPARTURE FOR SAFE AND MORE EFFICIENT AIR TRAFFIC MANAGEMENT Frédéric Rooseleer*, Vincent Treve*, Ivan De Visscher**, Robert Graham* *European Organization
Efficiency and Automation
 Efficiency and Automation Towards higher levels of automation in Air Traffic Management HALA! Summer School Cursos de Verano Politécnica de Madrid La Granja, July 2011 Guest Lecturer: Rosa Arnaldo Universidad
LARGE HEIGHT DEVIATION ANALYSIS FOR THE WESTERN ATLANTIC ROUTE SYSTEM (WATRS) AIRSPACE CALENDAR YEAR 2016
 AIRSPACE CALENDAR YEAR 2016") International Civil Aviation Organization Seventeenth meeting of the GREPECAS Scrutiny Working Group (GTE/17) Lima, Peru, 30 October to 03 November 2017 GTE/17-WP/07 23/10/17 Agenda Item 4: Large Height
International Civil Aviation Organization Seventeenth meeting of the GREPECAS Scrutiny Working Group (GTE/17) Lima, Peru, 30 October to 03 November 2017 GTE/17-WP/07 23/10/17 Agenda Item 4: Large Height
CRUISE TABLE OF CONTENTS
 CRUISE FLIGHT 2-1 CRUISE TABLE OF CONTENTS SUBJECT PAGE CRUISE FLIGHT... 3 FUEL PLANNING SCHEMATIC 737-600... 5 FUEL PLANNING SCHEMATIC 737-700... 6 FUEL PLANNING SCHEMATIC 737-800... 7 FUEL PLANNING SCHEMATIC
Pilot Procedures Photographic Survey Flights Flight Planning, Coordination, and Control
 Pilot Procedures Photographic Survey Flights Flight Planning, Coordination, and Control 2017-01-31 2017 NAV CANADA All rights reserved. No part of this document may be reproduced in any form, including
PBN AIRSPACE CONCEPT WORKSHOP. SIDs/STARs/HOLDS. Continuous Descent Operations (CDO) ICAO Doc 9931
 ICAO Doc 9931") International Civil Aviation Organization PBN AIRSPACE CONCEPT WORKSHOP SIDs/STARs/HOLDS Continuous Descent Operations (CDO) ICAO Doc 9931 Design in context Methodology STEPS TFC Where does the traffic
International Civil Aviation Organization PBN AIRSPACE CONCEPT WORKSHOP SIDs/STARs/HOLDS Continuous Descent Operations (CDO) ICAO Doc 9931 Design in context Methodology STEPS TFC Where does the traffic