Passenger Movements. August 231, , ,090 81,
|
|
|
- Stewart Nash
- 5 years ago
- Views:
Transcription
1 7. Conclusion The main objective of the Research was to find out ways of increasing efficiency and throughput by optimum utilization of Baggage Belts. The outcome of the Research can be used to manage and utilize the existing Baggage Handling System Infrastructure more efficiently and effectively while maximizing the Return. The results will be highly useful for the Baggage Belt Operator, who is the Ground Handling Agent at BIA: M/s. Sri Lankan Airlines, in developing criteria on the effective utilization of available resources, especially because a similar criteria is not available at present. Further, the results of both the Quantitative Analysis and the Qualitative Analysis gives a clear picture on the present demand and the available capacity as well as the medium term (2015) demand and the capacity requirements to meet that demand. The study gives a detailed comparison of Baggage Handling systems and technologies used at other leading airports. It also gives the recommendations for minimizing of mishandled / lost baggage and the ways of meeting the expected demand created by the operation of NLA : Airbus A 380 and the ways of mitigating its impacts on the BHS at BIA. 70
2 References 1. Bainum, Justin, Hong Ji and kheny, Priyanka. The Denver International Airport Automated Baggage Handling System, Castagnet, Daniel. "Baggage Handling - Team Effort", Passenger Terminal World, September 2004, PP de Barros, Alexander G. and Wirasinghe, S.C. Sizing the baggage claim area for New Large Aircraft J. Transp. Engrg., Volume 130, Issue 3, PP (May / June 2004) 4. de Neufville, Richard. "The Baggage System at Denver. Prospects and Lessons", Journal of Air Transport Management, Vol. 1, No. 4, December 1994, PP Farchione, Phil. "Baggage Handling - Tag technology - A handle on lost baggage", Passenger Terminal World, April 2000, PP Feasibility Study Report, BIADP - Phase II Stage II : Japan Airport Consultants (2005) 7. Guide, John. "Baggage Handling - Tag Technology - Lost Baggage a thing of the past". Passenger Terminal World, April 2000, PP Hamdy, A. Taha. Operations Research-An Introduction - 7 th Edition, Prentice Hall Inc.,(2003) 9. Heacock, Philip. "Smart Baggage Handling Systems Improve Airport Baggage Operations", Ground Support Magazine, June International Air Transport Association (IATA), (2004). "Airport Development Reference Manual" 9 * Ed. Montreal, Canada. 10. Mckenzie, Jim. "Baggage Handling - Friends reunited", Passenger Terminal World, September 2003, PP Pandit, Pankajnarayan. "Radio Frequency Identification for Airlines". Transportation and Services - Infosys Technologies Ltd; July 2004, PP Schlienz, Dagmar. "Technology - Seamless travel", Passenger Terminal World, September 2002, PP Improving Airport Operations and Security with RFID
3 Appendix - A Month Passenger Movements Transfer % Transfer Uplift Discharge Total Pax Pax January 164, , ,849 53, February 140, , ,254 49, March 167, , ,676 61, April 176, , ,152 63, May 178, , ,273 78, June 174, , ,005 83, July 180, , ,052 78, August 231, , ,090 81, September 191, , ,436 71, October 202, , ,822 69, November 199, , ,769 72, December 193, , ,332 82, Total 2,200,788 2,124,922 4,325, , Table A - 1: Passenger Movements - Year 2005 (Source: Data Base of Airport and Aviation Services Ltd) Year Passengers Annual Cargo Annual Aircraft Annual Growth (tons) Growth Movements Growth ,471,711-39,830-17, ,521, % 44, % 18, % ,797, % 50, % 19, % ,893, % 56, % 20, % ,156, % 70, % 20, % ,234, % 77, % 19, % ,148, % 85, % 20, % ,319, % 97, % 22, % ,356, % 94, % 24, % ,648, % 103, % 27, % ,880, % 128, % 32, % ,628, % 101, % 26, % ,766, % 112, % 25, % ,232, % 125, % 27, % ,069, % 145, % 35, % Average growth 7.89% 10.28% 5.49% First half in ,980, % 78, % 20, % Table A - 2: Air Traffic Record at Bandaranaike International Airport (Source: Data Base of Airport and Aviation Services Ltd)
4 Month Sen. Aircraft Movements Cargo (MT) Mail (MT) Non- Sch. Others Total Uplift Discharge Total Uplift Discharge Total January 2,537 1, ,627 7,188 7,409 14, February 2, ,190 7,221 4,899 12, March 2, ,206 8,806 5,278 14, April 2, ,933 6,942 4,906 11, May 2, ,275 7,374 4,955 12, June 2, ,045 7,831 5,029 12, July 2, ,185 9,399 5,385 14, August 2, ,537 7,970 5,251 13, September 2, ,440 7,727 5,146 12, October 2, ,385 8,505 5,655 14, November 2, ,531 7,633 4,974 12, December Not Available Not Available Not Available Not Available 9,106 5,533 14, Total 26,647 3, ,354 95,702 64, , ,234 Table A - 3: Monthly Statistics - Aircrafts, Cargo and Mail -Year 2005 (Source: Data Base of Airport and Aviation Services Ltd)
5 Year /Month January - 22,445 22,533 37,392 19,787 29,958 47,589 53,637 February - 16,783 22,586 34,714 20,511 24,722 38,989 49,026 March 14,695 18,192 24,009 34,564 22,204 19,936 40,444 61,247 April 15,087 19,129 19,587 32,402 17,863 18,430 43,895 63,441 May 15,437 19,545 25,794 33,429 23,294 20,764 48,442 78,502 June 16,450 19,453 28,497 35,342 19,162 20,706 51,781 83,639 July 18,186 19,323 35,249 32,839 19,836 26,698 57,663 78,511 August 14,805 19,236 36,580 20,074 20,331 25,883 62,430 81,086 September 15,692 19,582 33,159 17,295 18,279 -O,->0J 52,885 71,709 October 14,426 18,486 31,716 15,131 24,481 34,230 51,157 69,101 November 14,675 20,021 31,766 16,888 25,286 35,226 54,606 - December 15,808 21,573 31,064 19,591 29,907 42,077 59,065 - Total Transfer/ Transit Annual Growth Rate Total Passengers % Transfer of Total Passengers 115, , , , , , , , % 46.5% -3.8% -20.8% 28.0% 81.8% 2,356,836 2,648,780 2,880,387 2,628,043 2,766,164 3,232,762 4,069, Table A - 4: Total Transfer, Transit Passengers at BIA (From 1998 ~ 2005) (Source: Data Base of Airport and Aviation Services Ltd)
6 Year Passenger Forecast Cargo Forecast Aircraft Forecast Prob. Growth High Growth Prob. Growth High Growth Prob. Growth High Growth Pax. Annual Pax. Annual Cargo Annual Cargo Annual Acft. Annual Moveme Growth Moveme Growth Movement Growth Moveme Growth Moveme Growth nt(mil) Rate nt(mil) Rate (tons) Rate nt (tons) Rate nt Rate Annual Growth Rate Acft. Moveme nt 2004 (actual) 25.9% % % 145, % 145, % 35, % 35, % % % 161, % 166, % 37, % 37, % % % 179, % 188, % 39, % 40, % % % 199, % 213, % 41, % 43, % % % 221, % 241, % 43, % 46, % % % 245, % 273, % 46, % 50, % % % 272, % 309, % 48, % 53, % % % 302, % 350, % 51, % 57, % % % 335, % 396, % 53, % 61, % % % 372, % 448, % 56, % 65, % o 8.7% % 413, % 508, % 59, % 70,468 O.JJ % % % 459, % 575, % 62, % 75, % % % 505, % 646, % 65, % 80, % % % 555, % 725, % 69, % 85, % % % 611, % 814, % 72, % 90, % % % 672, % 914, % 76, % 96, % % % 739, % 1,027, % 80, % 103,209 Table A - 5: Passenger, Cargo and Aircraft Movement Forecast (Source: Data Base of Airport and Aviation Services Ltd) i
7 Month No. of Bags Mishandled No. of Bags Uplifted. Sep ,218 Oct ,343 Nov ,554 Dec ,649 Jan ,871 Feb ,296 Mar ,534 Apr ,136 May ,416 Jun ,036 Jul ,843 Aug ,818 Average ,726 Table A - 6: Mishandled Bags - Sri Lankan Airlines Flights (Sep Aug. 2005) (Source: Sri Lankan Airline Ltd) Belt No. Length (m) Capacity (kg/m) Total Capacity (kg) No. of Equivalent 25 kg Baggage Actual Capacity J Table A - 7: Baggage Belt Capacity (Source: Airport and Aviation Services Ltd) 76
8 Definition Aircraft Seats Seating Capacity (Nos) Load Factor Pax. Capacity (Nos) No of Baggage * New Large A Jumbo B A B B ER Large B LR A A B Medium A A Small A320 B Assume Bags/Pax = 1.5 [current industry std.] Table A - 8: Aircraft Seating and Baggage Capacity (Source: Airport and Aviation Services Ltd) Aircraft Seating Capacity (Nos) Peak Hour Peak HourTraffic Demand Forecast (2015) Traffic Demand (Present) Low Case Medium Case High Case New Large Jumbo Large Medium Small Total Table A - 9: Forecast of Passenger Aircraft Traffic Demand (Source: (BIADP-Phase II Stage II Feasibility Study Report) 77
9 Belt No. Optimum / Alternative Solution m, m 2 m, m 5 Maximum Mix Total Maximum Return (Z) 1 Optimum Optimum Optimum Optimum Alternative Optimum Alternative Table A - 10: Belt No Total Z 1120 Optimum Mix of Aircrafts and the Maximum Return for each Baggage Belt when D/a = 0.5 Optimum /Alternative Solution m, m 2 m, ITLl m 5 Maximum Mix Total Maximum Return (Z) 1 Optimum Optimum Optimum Optimum Alternative Optimum Alternative Total Z 1360 Table A - 11: Optimum Mix of Aircrafts and the Maximum Return for each Baggage Belt when D/a =
10 Belt No. Optimum / Alternative Solution m, m 2 m 3 nvt m 5 Maximum Mix Total Maximum Return (Z) 1 Optimum Optimum Optimum Optimum Alternative Optimum Alternative Total Z 2040 Table A - 12: Optimum Mix of Aircrafts and the Maximum Return for each Baggage Belt when D/a = 0.7
11 Flight No. Landed Time Aircraft Type Aircraft Category Baggage Belt Assigned UL A 320 Small 1 SV B 747 Jumbo 4 UL A 330 Large 3 UL A 320 Small 2 UL A 340 Large 2 UL A 320 Small 4 UL A 320 Small 2 EK A 330 Large 3 UL A 320 Small 2 UL A 330 Large 1 Table A 13: Record of Belt Assignment for Passenger Aircrafts arrived on Tuesday 3 rd January 2006 Flight No. Landed Time Aircraft Type Aircraft Category Baggage Belt Assigned SQ A 320 Small 1 UL A 330 Large 3 UL A 320 Small 1 OK A310 Medium 4 UL A 340 Large 2 RJ A310 Medium 1 UL A 330 Large 3 KV A 300 Medium 2 UL A 320 Small 1 QR A 330 Large 3 EY A 330 Large 4 Table A - 14: Record of Belt Assignment for Passenger Aircrafts arrived on Saturday 7,h January 2006
12 Flight No. Landed Time Aircraft Type Aircraft Category Baggage Belt Assigned SQ A 320 Small 4 UL A 330 Large 3 UL A 340 Large 2 UL A 330 Large KIO 0508 A 320 Small 4 UL A 330 Large 2 UL A 330 Large 3 UL A 340 Large 1 UL A 320 Small 4 KU A 300 Medium 2 EY A 330 Large 4 QR A 330 Large 3 Table A - 15: Record of Belt Assignment for Passenger Aircrafts arrived on Monday 9 th January 2006 No of Aircraft Denatures Monday No of Aircraft Depatures Tuesday No of Aircraft Depatures Wednesday No of Aircraft Depatures Thursday No of Aircraft Depatures Friday No of Aircraft Depatures Saturday Graph A - 16: No. of Aircrafts departures - (Monday - Sunday) 81
13 Ill No of Aircraft Arrivals Monday No of Aircraft Arrivals Tuesday No of Aircraft Arrivals Wednesday No of Aircraft Arrivals Thursday No of Aircraft Arrivals Friday No of Aircraft Arrivals Saturday No of Aircraft Arrivals Sunday Graph A - 17: No. of Aircrafts Arrivals - (Monday - Sunday) s:
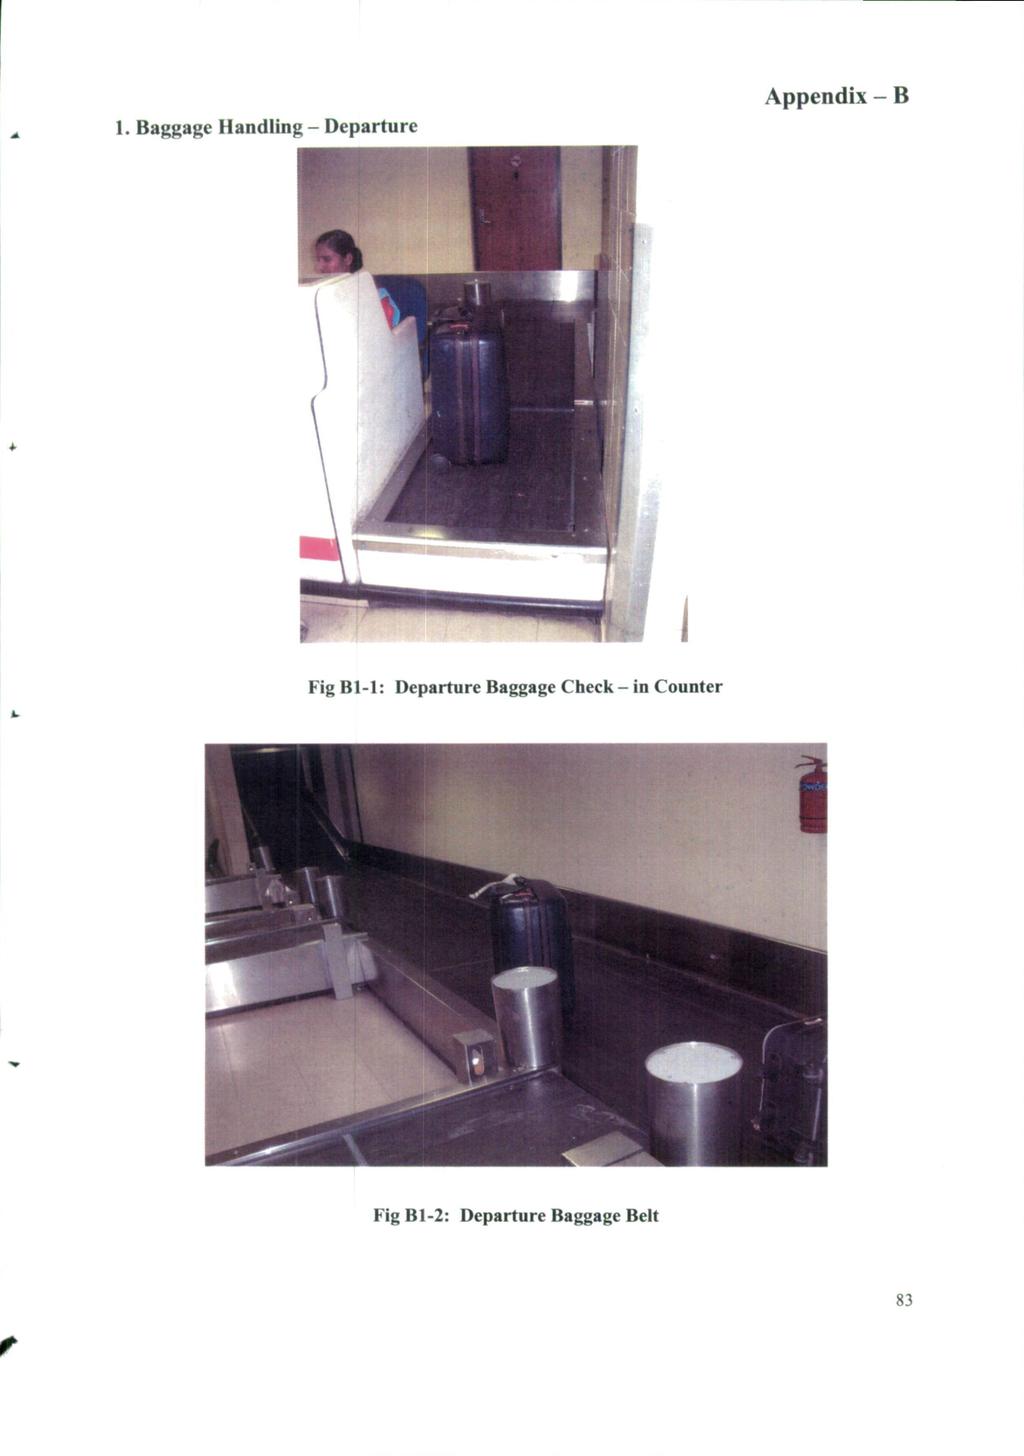
14 83
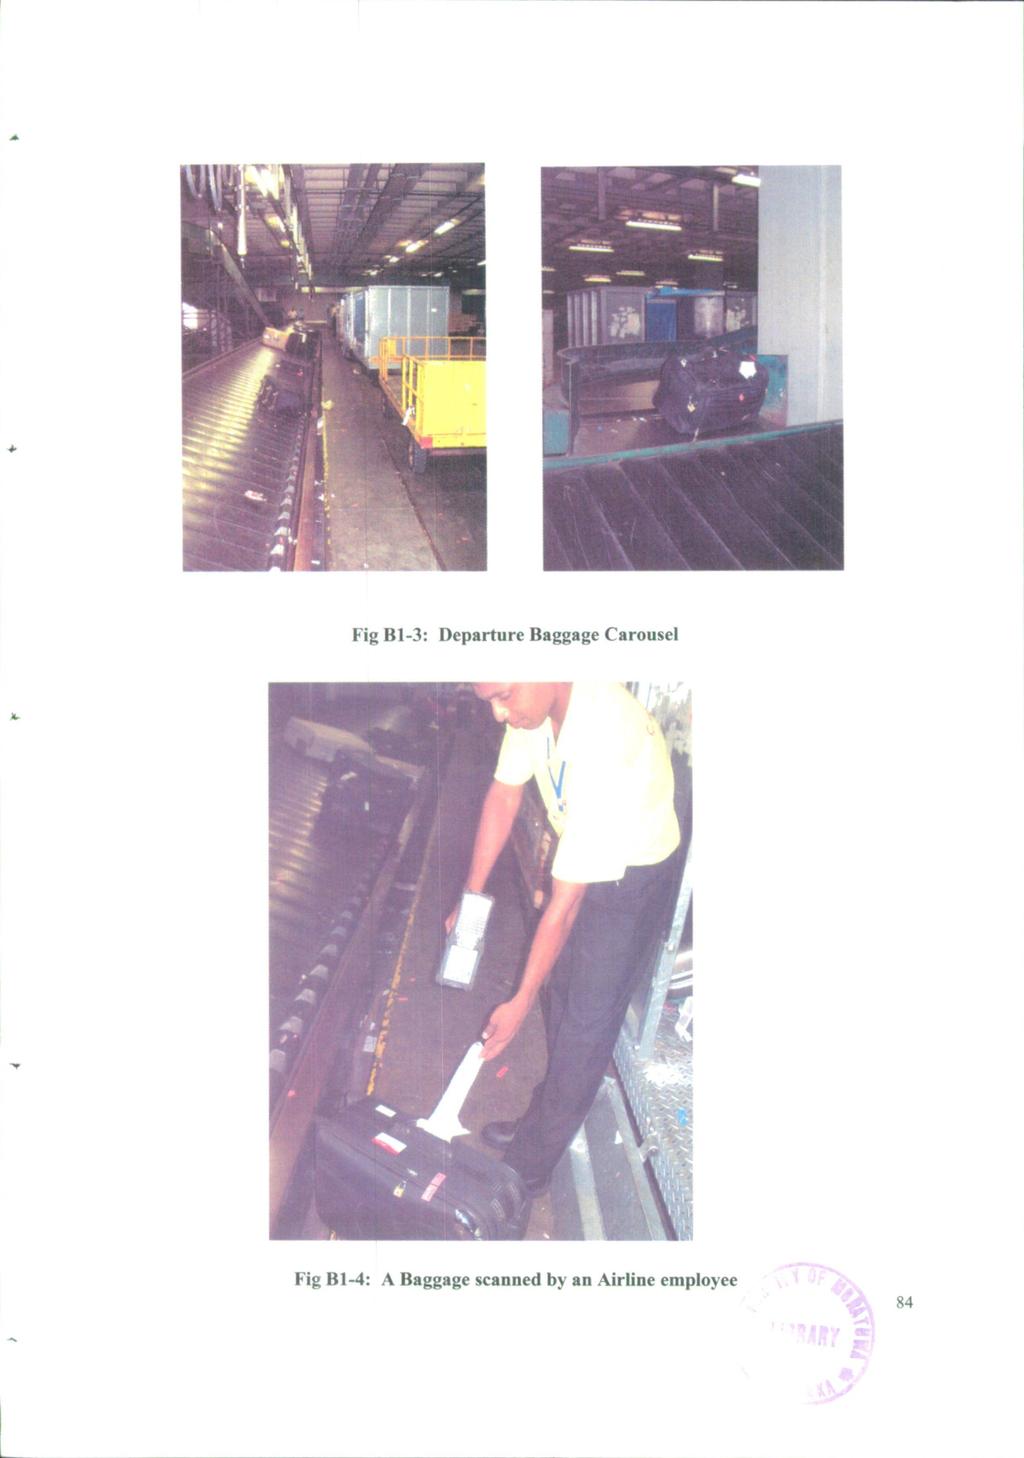
15
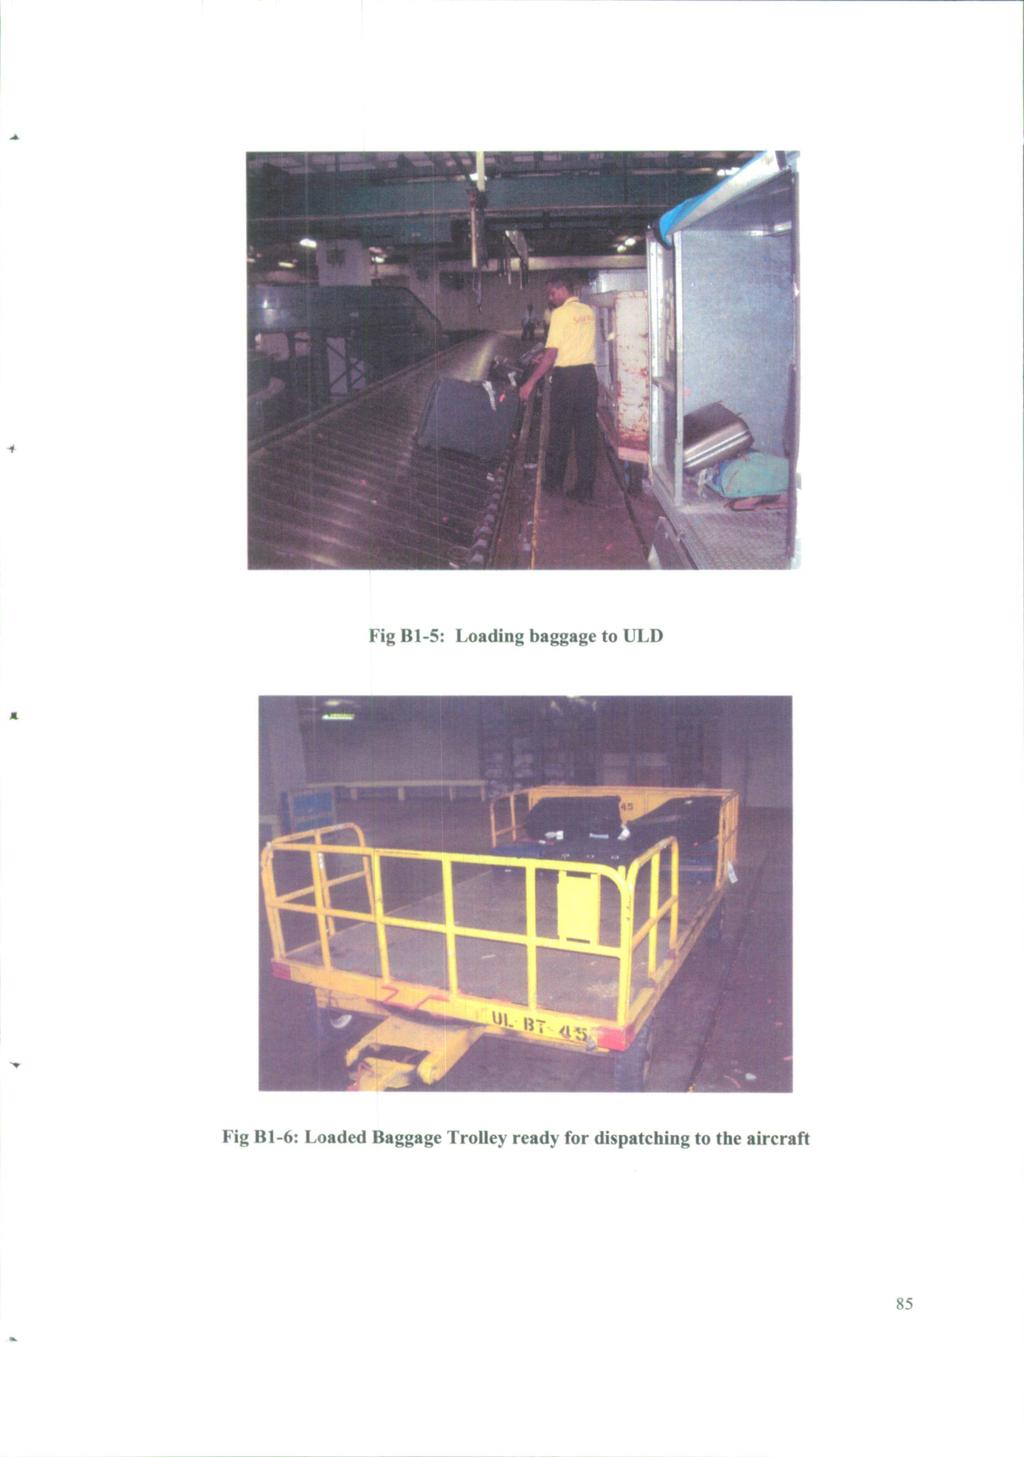
16
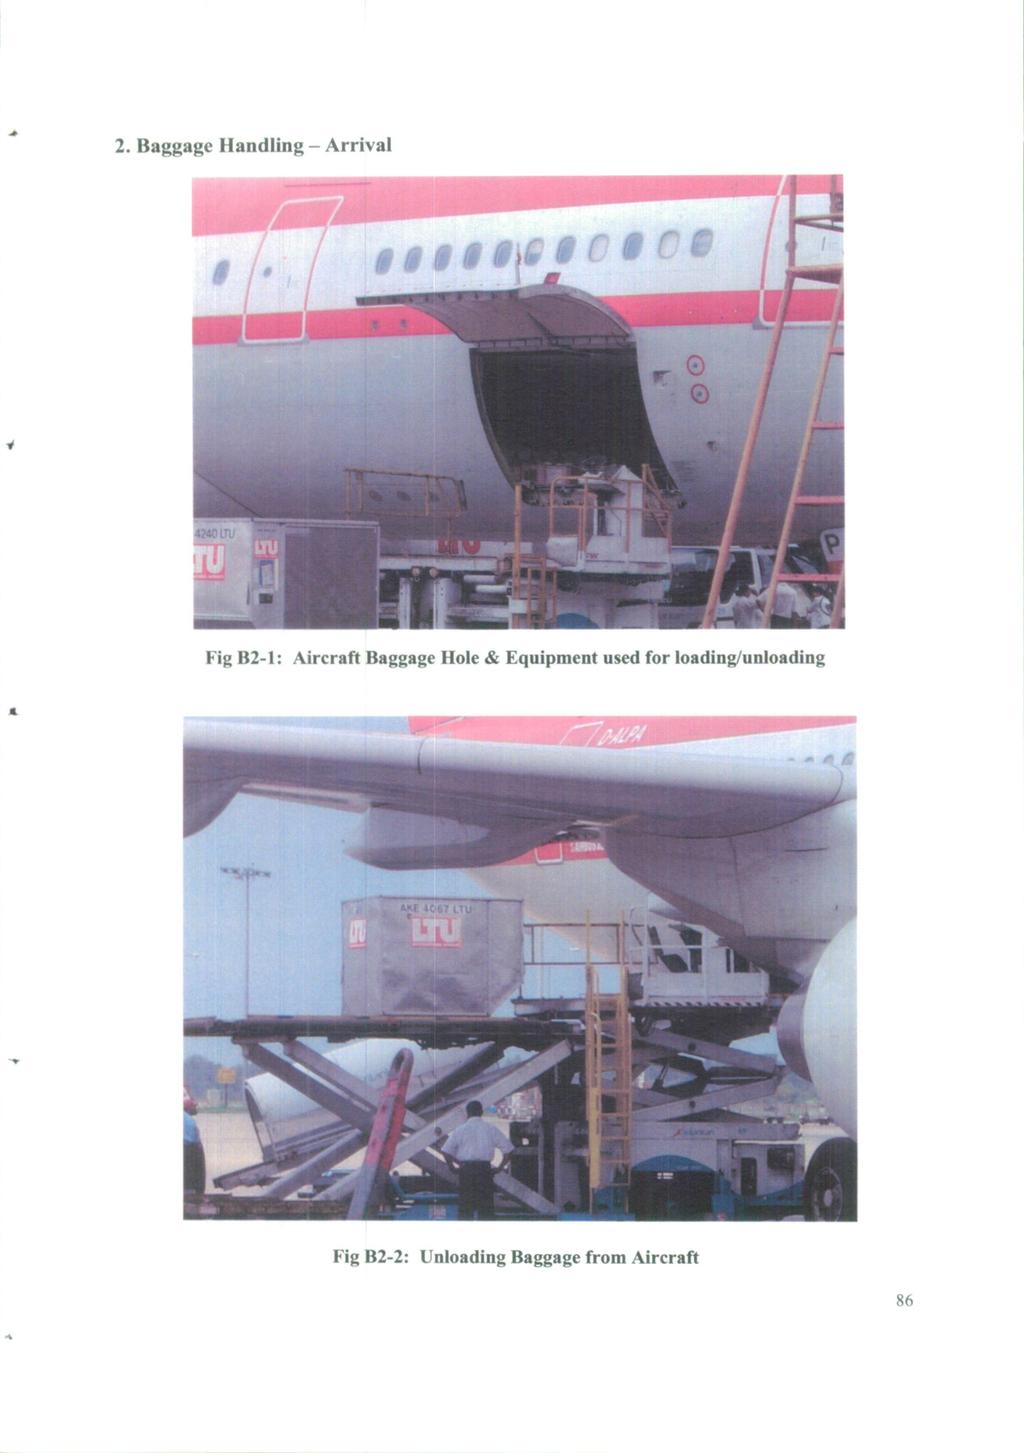
17
18 Fig B2-3: ULD unloaded to a baggage dolly for dispatching to the Arrival Baggage Carousel
19
20 Computer Based Calculation system using MS EXCEL Appendix - C Sample Calculation XI=3480 M1=0 X2=x 1 -w 1 m 1 =3480-0=3480 Al» * A B C o! E F G H 1 J! K L It 1 I - 2 Maximum Return 3 Total W 3537 n No. of stages 5 'ml s 6 Current Stage [Q 1 7 W1 660 n Ml Oft Previous Values ml v wl l> 660 JJ ml x ft tto T32U I7M 13 «2 O n.2 n « o 0 0 FALSE FALSE FALSE FALSE 15 1 of 0 o 1 0 FALSE FALSE FALSE FALSE Q o 2 0 FALSE FALSE FALSE FALSE m 3 Ol 0 o o 3 0 FALSE FALSE FALSE FALSE 4 Ol 0 o o 4 0 FALSE FALSE FALSE FALSE o o 5 0 FALSE FALSE FALSE FALSE A a l«l 1 M 4 M \ Sheet A \ St age B / x2=3480 O m2=2 O x3=x2-w2m2=3480-(480x2) = 2520 O x3=3480 r-.ior-.3 A1 D E F G 1 H 1 J K Total W 3537 No. of stages 5 Current Stage [1] 2 wl 300 rl 200 Maximum Return ml - 0 xt Get Previous Values « m 4» m\ Sheet A \stege E Ml mi x wi i too 0 0 FALSE FALSE FALSE FALSE 1 Q FALSE FALSE FALSE FALSE 2 0 FALSE FALSE FALSE FALSE 3 0 FALSE FALSE FALSE FALSE 4 0 FALSE FALSE FALSE FALSE 5 0 FALSE FALSE FALSE FALSE -~\r so
21 X O m3=0 O x4=x3-w3m3=2520-(360xo) O x4= A Maximum Return Total W 3537 n No. of stayes 5 ii L T Current Stage [U rj is n Get Previous Values M\Sheet A/Stage! 1 G 1., A m3 o J 2 J 4 ml x wi 0 m mi \ r3 0 no MO x3 o 0 0 FALSE FALSE FALSE FALSE o FALSE FALSE FALSE FALSE o FALSE FALSE FALSE FALSE o FALSE FALSE FALSE FALSE o FALSE FALSE FALSE FALSE 0 5., iri. 0 FALSE FALSE FALSE FALSE ir X4=2520 => m4=0 O x5=x4-w4m4=2520-(300x0) o x5=2520 Get Previous Values < I r> IN 4» N \ Stage A V Wage t Total W 3537 No. of stages 5 Current Stage [Q 4 w4 300 r4 200 > Maximum Return M mi- 2 x< I m 400 K L T FALSE FALSE FALSE 0 FALSE FALSE FALSE 0 FALSE FALSE FALSE 0 FALSE FALSE FALSE 0 FALSE FALSE FALSE 0 FALSE FALSE FALSE FALSE FALSE FALSE FALSE FALSE FALSE n r t or- r or- r i or- r i or»ir 90
22 X5=2520 O m5= G2534 A $. =IF(((G2S33+1 <=$G»3)" (G2533<>FALSE)),G FALSE) G I H Maximum Rattan Total W 3537 « No. of stages 5 'mi- Current Stage [i] 5 w5 180 r5 120 I (o ii « ME in6 x w ms x I "' 5 : 0 0 FALSE FALSE FALSE FALSE 1 0 FALSE FALSE FALSE FALSE 2 0 FALSE FALSE FALSE FALSE 3 0 FALSE FALSE FALSE FALSE 4 0 FALSE FALSE FALSE FALSE 5 0 FALSE FALSE FALSE FALSE r ( ( r. i cr r > i r*r- r i r*r r i or- (^i, 91
DTTAS Quarterly Aviation Statistics Snapshot Quarter Report
 Contents DTTAS Quarterly Aviation Statistics Snapshot Quarter 4 2015 Report 1.1 Dublin Airport Key Statistics... 1 1.2 Cork Airport Key Statistics... 3 1.3 Shannon Airport Key Statistics... 5 1.4 Total
January 2018 Air Traffic Activity Summary
 January 2018 Air Traffic Activity Summary Jan-2018 Jan-2017 CY-2018 CY-2017 Passengers 528,947 505,421 4.7% 528,947 505,421 4.7% Passengers 537,332 515,787 4.2% 537,332 515,787 4.2% Passengers 1,066,279
DTTAS Quarterly Aviation Statistics Snapshot Quarter Report
 Contents DTTAS Quarterly Aviation Statistics Snapshot Quarter 3 2018 Report 1.1 Dublin Airport Key Statistics... 1 1.2 Cork Airport Key Statistics... 3 1.3 Shannon Airport Key Statistics... 5 1.4 Total
DTTAS Quarterly Aviation Statistics Snapshot Quarter Report
 Contents DTTAS Quarterly Aviation Statistics Snapshot Quarter 1 2018 Report 1.1 Dublin Airport Key Statistics... 1 1.2 Cork Airport Key Statistics... 3 1.3 Shannon Airport Key Statistics... 5 1.4 Total
November 2013 Passenger and Cargo Traffic Statistics Reno-Tahoe International Airport
 November 2013 Passenger and Cargo Traffic Statistics Reno-Tahoe International Airport December 26, 2013 U.S. DOMESTIC INDUSTRY OVERVIEW FOR NOVEMBER 2013 All RNO Carriers Domestic Systemwide year over
October 2013 Passenger and Cargo Traffic Statistics Reno-Tahoe International Airport
 October 2013 Passenger and Cargo Traffic Statistics Reno-Tahoe International Airport December 4, 2013 U.S. DOMESTIC INDUSTRY OVERVIEW FOR OCTOBER 2013 All RNO Carriers Systemwide year over year comparison
August 2014 Passenger and Cargo Traffic Statistics Reno-Tahoe International Airport
 August 2014 Passenger and Cargo Traffic Statistics Reno-Tahoe International Airport October 8, 2014 U.S. DOMESTIC INDUSTRY OVERVIEW FOR AUGUST 2014 All RNO Carriers Domestic Systemwide year over year comparison
December 2013 Passenger and Cargo Traffic Statistics Reno-Tahoe International Airport
 December 2013 Passenger and Cargo Traffic Statistics Reno-Tahoe International Airport January 24, 2014 U.S. DOMESTIC INDUSTRY OVERVIEW FOR DECEMBER 2013 All RNO Carriers Domestic Systemwide year over year
Passenger and Cargo Statistics Report
 Passenger and Cargo Statistics Report RenoTahoe International Airport September 2017 U.S. DOMESTIC INDUSTRY OVERVIEW FOR SEPTEMBER 2017 Systemwide RNO Carriers Domestic Flights year over year comparison
Hector International Airport
 Hector International Airport Data Acquired via OAG on October 2, 216 Volume 3-17 April 216 thru March 217 (Scheduled Flights Only) October 2, 216 1.% 5.% 5.8% 5.% 3.5% 5.% 6.8%.5%.% -5.% -3.9% -1.4% -2.9%
Passenger and Cargo Statistics Report
 Passenger and Cargo Statistics Report RenoTahoe International Airport July 2017 U.S. DOMESTIC INDUSTRY OVERVIEW FOR JULY 2017 Systemwide RNO Carriers Domestic Flights year over year comparison Average
Passenger and Cargo Statistics Report
 Passenger and Cargo Statistics Report RenoTahoe International Airport June 2017 U.S. DOMESTIC INDUSTRY OVERVIEW FOR JUNE 2017 All RNO Carriers Domestic Systemwide year over year comparison Average Load
Greater Orlando Aviation Authority Board Meeting. Wednesday, January 17, 2018
 Greater Orlando Aviation Authority Board Meeting Wednesday, Award Recognition South Terminal Complex Phase 1 and Phase 2 Planning Overview Greater Orlando Aviation Authority AGENDA PASSENGER TRAFFIC
Passenger and Cargo Statistics Report
 Passenger and Cargo Statistics Report RenoTahoe International Airport April 2018 U.S. DOMESTIC INDUSTRY OVERVIEW FOR APRIL 2018 Systemwide RNO Carriers Domestic Flights year over year comparison Average
Passenger and Cargo Statistics Report
 Passenger and Cargo Statistics Report RenoTahoe International Airport May 2018 U.S. DOMESTIC INDUSTRY OVERVIEW FOR MAY 2018 Systemwide RNO Carriers Domestic Flights year over year comparison Average Load
March 2014 Passenger and Cargo Traffic Statistics Reno-Tahoe International Airport
 March 2014 Passenger and Cargo Traffic Statistics Reno-Tahoe International Airport April 25, 2014 U.S. DOMESTIC INDUSTRY OVERVIEW FOR MARCH 2014 All RNO Carriers Domestic Systemwide year over year comparison
Passenger and Cargo Statistics Report
 Passenger and Cargo Statistics Report RenoTahoe International Airport January 2018 U.S. DOMESTIC INDUSTRY OVERVIEW FOR JANUARY 2018 Systemwide RNO Carriers Domestic Flights year over year comparison Average
Passenger and Cargo Statistics Report
 Passenger and Cargo Statistics Report RenoTahoe International Airport February 2018 U.S. DOMESTIC INDUSTRY OVERVIEW FOR FEBRUARY 2018 Systemwide RNO Carriers Domestic Flights year over year comparison
Passenger and Cargo Statistics Report
 Passenger and Cargo Statistics Report RenoTahoe International Airport September 2015 U.S. DOMESTIC INDUSTRY OVERVIEW FOR SEPTEMBER 2015 All RNO Carriers Domestic Systemwide year over year comparison Average
Passenger and Cargo Statistics Report
 Passenger and Cargo Statistics Report RenoTahoe International Airport August 2015 U.S. DOMESTIC INDUSTRY OVERVIEW FOR AUGUST 2015 All RNO Carriers Domestic Systemwide year over year comparison Average
January 2014 Passenger and Cargo Traffic Statistics Reno-Tahoe International Airport
 January 2014 Passenger and Cargo Traffic Statistics Reno-Tahoe International Airport March 12, 2014 U.S. DOMESTIC INDUSTRY OVERVIEW FOR DECEMBER 2013 All RNO Carriers Domestic Systemwide year over year
LOUIS ARMSTRONG NEW ORLEANS INTERNATIONAL AIRPORT For the Period Ending September 30, Enplaned Passengers by Airline
 Domestic Scheduled Enplaned Passengers by Airline Alaska Airlines 7,070 4,331 63.2% 59,552 42,265 40.9% 1.2% 1.0% Virgin America 0 803-100.0% 12,231 803 1423.2% 0.3% 0.0% Allegiant Air 1,333 2,063-35.4%
ANNUAL REPORT AIR TRAFFIC STATISTICS 2010/11 FINANCIAL YEAR
 ANNUAL REPORT AIR TRAFFIC STATISTICS 2010/11 FINANCIAL YEAR Released by Civil Aviation Authority of Botswana Department of Air Transport August 2011 ANNUAL REPORT: AIR TRAFFIC STATISTICS FOR THE 2010/
Performance monitoring report 2017/18
 Performance monitoring report /18 Gatwick Airport Limited 1. Introduction Date of issue: 20 July 2018 This report provides an update on performance at Gatwick in the financial year /18, ending 31 March
Table of Contents PAGE
 April 2015 EL PASO INTERNATIONAL AIRPORT MONTHLY ACTIVITY REPORT April 2015 Table of Contents PAGE AIRPORT ACTIVITY OVERVIEW 1 NONSTOP DESTINATION ANALYSIS 2 MAP OF NONSTOP DESTINATIONS 3 FLIGHT SCHEDULE
Passenger and Cargo Statistics Report
 Passenger and Cargo Statistics Report RenoTahoe International Airport December 2015 U.S. DOMESTIC INDUSTRY OVERVIEW FOR DECEMBER 2015 All RNO Carriers Domestic Systemwide year over year comparison Average
Table of Contents PAGE
 FEBRUARY 2018 EL PASO INTERNATIONAL AIRPORT MONTHLY ACTIVITY REPORT February 2018 Table of Contents PAGE AIRPORT ACTIVITY OVERVIEW 1 NONSTOP DESTINATION ANALYSIS 2 MAP OF NONSTOP DESTINATIONS 3 FLIGHT
Update of the Airport Master Plan. Initial Runway & Land Use Alternatives
 Johannesburg International Airport Update of the Airport Master Plan Initial Runway & Land Use Alternatives 15 February 2006 BACKGROUND JNB current Master Plan Approved by ACSA Board in 1999 20-22 mppa?
May 2011 Passenger and Cargo Traffic Statistics Reno-Tahoe International Airport
 May 2011 Passenger and Cargo Traffic Statistics Reno-Tahoe International Airport July 5, 2011 U.S. DOMESTIC INDUSTRY OVERVIEW FOR MAY 2011 All RNO Carriers Systemwide year over year comparison Average
MAXIMIZING INVESTMENT AND UTILIZATION
 MAXIMIZING INVESTMENT AND UTILIZATION November 2013 Luis Ajamil Bermello, Ajamil & Partners Two perspectives How to increase use of the facility OPTIMIZATION How to improve the capacity of the facility
Passenger and Cargo Statistics Report
 Passenger and Cargo Statistics Report RenoTahoe International Airport November 2017 U.S. DOMESTIC INDUSTRY OVERVIEW FOR NOVEMBER 2017 Systemwide RNO Carriers Domestic Flights year over year comparison
September 2013 Passenger and Cargo Traffic Statistics Reno-Tahoe International Airport
 September 2013 Passenger and Cargo Traffic Statistics Reno-Tahoe International Airport October 31, 2013 U.S. DOMESTIC INDUSTRY OVERVIEW FOR SEPTEMBER 2013 All RNO Carriers Systemwide year over year comparison
Passenger and Cargo Statistics Report
 Passenger and Cargo Statistics Report RenoTahoe International Airport September 2018 U.S. DOMESTIC INDUSTRY OVERVIEW FOR SEPTEMBER 2018 Systemwide RNO Carriers Domestic Flights year over year comparison
Analysts Briefing. 24 June Cathay Pacific Airways Limited
 Analysts Briefing 24 June 2016 Cathay Pacific Airways Limited Operating performance - overview Challenging business environment. Load factor lower than expectations on weakening passenger demand. Strong
IATA FUEL EFFICIENCY CAMPAIGN
 IATA FUEL EFFICIENCY CAMPAIGN Juergen Haacker Director, Operations Montreal, IATA Fuel Efficiency Campaign Jet fuel price driving airline fuel efficiency Increased 5% from 2003-2005 Industry is on track
Oct-17 Nov-17. Travel is expected to grow over the coming 6 months; at a slower rate
 Analysis provided by TRAVEL TRENDS INDEX OCTOBER 2018 CTI reading of 51.6 in October 2018 indicates that travel to or within the U.S. grew 3.2% in October 2018 compared to October 2017. LTI predicts travel
Table of Contents PAGE
 DECEMBER 2018 EL PASO INTERNATIONAL AIRPORT MONTHLY ACTIVITY REPORT December 2018 Table of Contents PAGE AIRPORT ACTIVITY OVERVIEW 1 NONSTOP DESTINATION ANALYSIS 2 MAP OF NONSTOP DESTINATIONS 3 FLIGHT
Table of Contents PAGE
 NOVEMBER 2018 EL PASO INTERNATIONAL AIRPORT MONTHLY ACTIVITY REPORT November 2018 Table of Contents PAGE AIRPORT ACTIVITY OVERVIEW 1 NONSTOP DESTINATION ANALYSIS 2 MAP OF NONSTOP DESTINATIONS 3 FLIGHT
Table of Contents PAGE
 OCTOBER 2018 EL PASO INTERNATIONAL AIRPORT MONTHLY ACTIVITY REPORT October 2018 Table of Contents PAGE AIRPORT ACTIVITY OVERVIEW 1 NONSTOP DESTINATION ANALYSIS 2 MAP OF NONSTOP DESTINATIONS 3 FLIGHT SCHEDULE
December 2011 Passenger and Cargo Traffic Statistics Reno-Tahoe International Airport
 December 2011 Passenger and Cargo Traffic Statistics Reno-Tahoe International Airport January 27, 2012 U.S. DOMESTIC INDUSTRY OVERVIEW FOR DECEMBER 2011 All RNO Carriers Systemwide year over year comparison
F L I G H T S A F E T Y F O U N D A T I O N. For Everyone Concerned with the Safety of Flight
 F L I G H T S A F E T Y F O U N D A T I O N Airport Operations Vol. 2 No. 1 For Everyone Concerned with the Safety of Flight January/February 1994 U.S. Federal Aviation Administration Aviation System Indicators
Oct-17 Nov-17. Sep-17. Travel is expected to grow over the coming 6 months; at a slightly faster rate
 Analysis provided by TRAVEL TRENDS INDEX SEPTEMBER 2018 CTI reading of.8 in September 2018 indicates that travel to or within the U.S. grew 1.6% in September 2018 compared to September 2017. LTI predicts
Passenger and Cargo Statistics Report
 Passenger and Cargo Statistics Report Reno-Tahoe International Airport October 2018 U.S. DOMESTIC INDUSTRY OVERVIEW FOR OCTOBER 2018 Systemwide RNO Carriers Domestic Flights year over year comparison Average
Passenger and Cargo Statistics Report
 Passenger and Cargo Statistics Report RenoTahoe International Airport September 2016 U.S. DOMESTIC INDUSTRY OVERVIEW FOR SEPTEMBER 2016 All RNO Carriers Domestic Systemwide year over year comparison Average
Passenger and Cargo Statistics Report
 Passenger and Cargo Statistics Report RenoTahoe International Airport July 2018 U.S. DOMESTIC INDUSTRY OVERVIEW FOR JULY 2018 Systemwide RNO Carriers Domestic Flights year over year comparison Average
RFID based Airport Management System
 RFID based Airport Management System WHITE PAPER Ver 1.0 (April2013) Travel and transportation impacts a wide spectrum of industries. The airline industry handles more than 2 billion passengers annually.a
Passenger and Cargo Statistics Report
 Passenger and Cargo Statistics Report RenoTahoe International Airport June 2018 U.S. DOMESTIC INDUSTRY OVERVIEW FOR JUNE 2018 Systemwide RNO Carriers Domestic Flights year over year comparison Average
Passenger and Cargo Statistics Report
 Passenger and Cargo Statistics Report Reno-Tahoe International Airport December 2014 U.S. DOMESTIC INDUSTRY OVERVIEW FOR DECEMBER 2014 All RNO Carriers Domestic Systemwide year over year comparison Average
Passenger and Cargo Statistics Report
 Passenger and Cargo Statistics Report RenoTahoe International Airport January 2017 U.S. DOMESTIC INDUSTRY OVERVIEW FOR JANUARY 2017 All RNO Carriers Domestic Systemwide year over year comparison Average
July 2012 Passenger and Cargo Traffic Statistics Reno-Tahoe International Airport
 July 2012 Passenger and Cargo Traffic Statistics Reno-Tahoe International Airport August 31, 2012 U.S. DOMESTIC INDUSTRY OVERVIEW FOR JULY 2012 All RNO Carriers Systemwide year over year comparison Average
LOUIS ARMSTRONG NEW ORLEANS INTERNATIONAL AIRPORT For the Period Ending August 31, Enplaned Passengers by Airline
 Enplaned Passengers by Airline Domestic Scheduled Alaska Airlines 3,797 4,077-6.9% 36,538 35,188 3.8% 1.0% 1.0% Allegiant Air 5,698 743 666.9% 41,738 14,843 181.2% 1.1% 0.4% American Airlines (US Air)
Statistics of Air, Water, and Land Transport Statistics of Air, Water, and Land. Transport Released Date: August 2015
 Statistics of Air, Water, and Land Transport 2014 2013 1 Released Date: August 2015 Table of Contents Introduction... 4 Key Points... 5 1. Air Transport... 6 1.1 Aircraft movements... 6 1.2 Number of passengers...
Performance monitoring report for 2014/15
 Performance monitoring report for 20/15 Date of issue: August 2015 Gatwick Airport Limited Summary Gatwick Airport is performing well for passengers and airlines, and in many aspects is ahead of the performance
AF / KL. AM Airline Aeromexpress Cargo AeroMexico Cargo
 From Malaysia to Long ICA 11-Sep-12 RM3.93 AF / KL Air France / KLM From Malaysia to Long ICA 11-Sep-12 RM3.93 * SSC is based on " chargeable weight " RM0.58 AM Aeromexpress Cargo AeroMexico Cargo Effective
International Visitation to the Northern Territory. Year ending December 2017
 International Visitation to the Northern Territory Year ending December 2017 The following is a summary of information relevant to the Northern Territory (NT) tourism industry including visitation results
Jan-18. Dec-17. Travel is expected to grow over the coming 6 months; at a slower rate
 Analysis provided by TRAVEL TRENDS INDEX DECEMBER 2018 CTI reading of 51.8 in December 2018 indicates that travel to or within the U.S. grew 3.6% in December 2018 compared to December 2017. LTI predicts
International Visitation to the Northern Territory. Year ending September 2017
 International Visitation to the Northern Territory Year ending September 2017 The following is a summary of information relevant to the Northern Territory (NT) tourism industry including visitation results
International Visitation to the Northern Territory. Year ending June 2017
 International Visitation to the Northern Territory Year ending June 217 The following is a summary of information relevant to the Northern Territory tourism industry including visitation results from Tourism
Passenger and Cargo Statistics Report
 Passenger and Cargo Statistics Report RenoTahoe International Airport December 2016 U.S. DOMESTIC INDUSTRY OVERVIEW FOR DECEMBER 2016 All RNO Carriers Domestic Systemwide year over year comparison Average
International Visitation to the Northern Territory. Year ending March 2017
 International Visitation to the Northern Territory Year ending March 217 The following is a summary of information relevant to the Northern Territory tourism industry including visitation results from
State of the Aviation Industry
 State of the Aviation Industry Presentation to the ACI Airport Economics & Finance 10 th 11 th February London, United Kingdom Laurie N. Price Director of Aviation Strategy Mott MacDonald Aviation Current
I T N E T R E N R A N T A I T ON O AL A L A R A R R I R VA V L A S L S A N A D N D D E D PA
 INTERNATIONAL ARRIVALS AND DEPARTURES July 2015 Government of Tonga SD18M-36 Statistical Bulletin Month of Change from Change from July 2015 Number previous month previous year All Arrivals 8,252-28.0
O Hare Noise Compatibility Commission Technical Committee April 19, Proposed Interim Fly Quiet Runway Rotation Plan
 O Hare Noise Compatibility Commission Technical Committee April 19, 2016 Proposed Interim Fly Quiet Runway Rotation Plan O HARE MODERNIZATION ROD - FLY QUIET Record of Decision (ROD) was issued on September
PERFORMANCE MEASURE INFORMATION SHEET #16
 PERFORMANCE MEASURE INFORMATION SHEET #16 ARROW LAKES RESERVOIR: RECREATION Objective / Location Recreation/Arrow Lakes Reservoir Performance Measure Access Days Units Description MSIC 1) # Access Days
The NESCAUM Method of Estimating Aircraft Emissions
 The NESCAUM Method of Estimating Aircraft Emissions Presentation to the OTC Mobile Source Committee December 5, 2001 Baltimore-Washington International Airport Ingrid Ulbrich Environmental Analyst NESCAUM
49 May-17. Jun-17. Travel is expected to grow over the coming 6 months; at a slower rate
 Analysis provided by TRAVEL TRENDS INDEX MAY 2018 CTI reading of 51.7 in May 2018 shows that travel to or within the U.S. grew 3.4% in May 2018 compared to May 2017. LTI predicts moderating travel growth
December 2012 Passenger and Cargo Traffic Statistics Reno-Tahoe International Airport
 December 2012 Passenger and Cargo Traffic Statistics Reno-Tahoe International Airport January 29, 2013 U.S. DOMESTIC INDUSTRY OVERVIEW FOR DECEMBER 2012 All RNO Carriers Systemwide year over year comparison
Pacific Project. CPWG/8 - WP/6 Appendix A
 Pacific Project CPWG/8 - WP/6 Pacific Project Objective This project aims to substantially improve operational efficiency and environmental outcomes on the major air traffic flow between North America
Passenger Traffic Achieves Strong Growth of 4.8% for the Month of August
 Passenger Traffic Achieves Strong Growth of 4.8% for the Month of August Montréal, 7 October Passenger traffic experienced a slight surge in growth to almost +5% for August compared to previous months
LIST OF ZED / MIBA IET AGREEMENTS ZED SUBLOAD
 Listings have now become mandatory for all staff travelling on ID90 or ZED tickets. Failure to list will result in non acceptance of staff with most airlines. Please find below the updated list of ZED/MIBA
CORPORATE STEVE BOOKING SMITH CHANNELS
 JAPAN AIRLINES: NAVIGATING THE FUTURE Steve Myer, Tokyo September 30, 2016 CORPORATE STEVE BOOKING SMITH CHANNELS VICE PRESIDENT, GLOBAL & STRATEGIC SALES, THE AMERICAS SEPTEMBER 20, 2016 RENO, NEVADA
With the completion of this project, we would like to follow-up on the projections as well as highlight a few other items:
 TO: FROM: Mayor and Council Interim City Manager Rebecca Underhill, Director of Finance DATE: February 28, 2014 SUBJECT: Water Meter Project Analysis On March 28, 2012, Acting City Manager Mike Loftin
Cathay Pacific Airways 2011 Analyst Briefing 23 June 2011
 Cathay Pacific Airways 2011 Analyst Briefing 23 June 2011 1 Airline Strategy Grow our international network, expand frequencies and further develop Hong Kong as one of the world s leading aviation hubs
Performance monitoring report for first half of 2016
 Performance monitoring report for first half of 2016 Gatwick Airport Limited 1. Introduction Date of issue: 5 December 2016 This report provides an update on performance at Gatwick in the first half of
A-CDM A SUCCESS CASE OF COLLABORATION GRUAIRPORT & GOL. Capt Miguel Dau - COO
 A-CDM A SUCCESS CASE OF COLLABORATION GRUAIRPORT & GOL Capt Miguel Dau - COO 1 OLD STRUCTURE (CGA)- INFRAERO AIRPORT MANAGEMENT CENTER CENTRO DE GERENCIAMENTO AEROPORTUÁRIA The INFRAERO implemented the
Preliminary Operational Statistics for KIX and ITM for February 2016
 March 22, 2016 Preliminary Operational Statistics for KIX and ITM for February 2016 [Number of aircraft movements at KIX] Historical record high for February for the total number of aircraft movements
MARKET NEWSLETTER No 57 January 2012
 OVERVIEW OF INTRA-EUROPEAN UNION TRADING BETWEEN 2007/08 AND 2010/11 The data on intra-eu trade reported in this month s newsletter have been taken from the EUROSTAT database. However, it is important
Weekly Performance Update
 Pr. Rupert Vancouver Grain Monitoring Program Weekly Performance Update January, 19 For (1-19 CY) Summary 1. Stocks in Store (' tonnes) Country Elevators % of Working T his Week Last Week Var. fro m Last
U.S. DOMESTIC INDUSTRY OVERVIEW FOR OCTOBER 2010 All RNO Carriers Systemwide year over year comparison
 Inter-Office Memo Reno-Tahoe Airport Authority Date: November 22, 2010 To: Chairman and Board of Trustees From: Krys T. Bart, A.A.E., President/CEO Subject: RENO-TAHOE INTERNATIONAL AIRPORT OCTOBER 2010
2017/ Q1 Performance Measures Report
 2017/2018 - Q1 Performance Measures Report Contents Ridership & Revenue... 1 Historical Revenue & Ridership... 1 Revenue Actual vs. Planned... 3 Mean Distance Between Failures... 5 Maintenance Cost Quarter
Noise Oversight Committee
 Noise Oversight Committee May 8, 2014 Audio/Video recordings are made of this meeting 1 Item 1 Review and Approve Draft Meeting Minutes Minutes from March 19, 2014 2 Item 2 Review of Operations Report
AFTA Travel Trends. June 2017
 AFTA Travel Trends June 2017 AFTA Travel Trends Report 2017 Inbound and Outbound overview Introduction This snapshot provides an overview of the balance of trade between Inbound and Outbound Travel for
RENO-TAHOE INTERNATIONAL AIRPORT APRIL 2008 PASSENGER STATISTICS
 Inter-Office Memo Reno-Tahoe Airport Authority Date: June 5, 2008 To: Statistics Recipients From: Tom Medland, Director Air Service Business Development Subject: RENO-TAHOE INTERNATIONAL AIRPORT PASSENGER
Sawasdee Krup. Applications of RFID in Aviation. Symbol RFID Ecosystem Summit. Bangkok May Louis Kirk
 Sawasdee Krup Applications of RFID in Aviation Symbol RFID Ecosystem Summit Bangkok 10-11 May 2006 Louis Kirk Topics Symbol Products in Airports 2 Common Questions About RFID IATA Initiatives Standards
SIA GROUP FINANCIAL RESULTS
 FINANCIAL RESULTS For Ended 30 June 2018 197200078R Operating Result Q1 Q1 Better/ FY18/19 FY17/18 R1 (Worse) ($M) ($M) (%) Total Revenue 3,844 3,864 (0.5) Q1 Better/ FY17/18 R2 (Worse) ($M) (%) 3,689
EU banana sector Sarolta IDEI / Daniel VANDERELST / Lucie ZOLICHOVA
 EU banana sector Sarolta IDEI / Daniel VANDERELST / Lucie ZOLICHOVA European Commission DG Agriculture and Rural Development Unit C.2. Wine, spirits, horticultural products, specialised crops September
Technical Report. Aircraft Overflight and Noise Analysis. Brisbane, California. December Prepared by:
 Aircraft Noise Abatement Office Technical Report Aircraft Overflight and Noise Analysis Brisbane, California Prepared by: P.O. Box 8097 San Francisco, California 94128 (650) 821-5100 Introduction In response
SSP progress in Latvia. Overview
 SSP progress in Latvia CAA of Latvia: Ms. Ērika Neimane, Head of the ATM Section, ANS Division LGS: Mr. Jānis Lapiņš, Head of Safety, Quality, Security and Audit Management airbaltic: Mr. Lauris Miķelsons,
Analyst Briefing. 12 June Cathay Pacific Airways Limited
 Analyst Briefing 12 June 2015 Cathay Pacific Airways Limited Operating Performance The positive operating environment continues into the first half of 2015. Robust passenger demand and healthy cargo demand.
Fast Travel Now & What s next. Youn Kim Airport, Passenger, Cargo & Security, Asia-Pacific
 Fast Travel Now & What s next Youn Kim Airport, Passenger, Cargo & Security, Asia-Pacific IATA 2016 Global Passenger Survey I want everything to go smoothly on my day-of-travel I m willing to give more
Noise Oversight Committee
 Noise Oversight Committee July 22, 2015 Audio recordings are made of this meeting 1 Noise Oversight Committee July 22, 2015 Item 1 Review and Approve Draft Meeting Minutes Minutes from May 20, 2015 Noise
Watertown Airplane Noise Meeting
 Watertown Airplane Noise Meeting July 25, 2017 Myron Kassaraba Town of Belmont Rep, Massport CAC 1 Topics June Stats & Construction Update 33L RNAV SID & RNAV Study Runway Selection Overnight Procedure
U.S. DOMESTIC INDUSTRY OVERVIEW FOR MARCH
 Inter-Office Memo Reno-Tahoe Airport Authority Date: April 30, 2009 To: Statistics Recipients From: Krys T. Bart, A.A.E., President/CEO Subject: RENO-TAHOE INTERNATIONAL AIRPORT PASSENGER STATISTICS U.S.
AGENDA AIRPORTS BOARD Thursday June 21, :30 p.m. Beaufort County Government Building, County Council Chambers
 Page 2 AGENDA AIRPORTS BOARD Thursday June 21, 1:3 p.m. Beaufort County Government Building, County Council Chambers NO AUDIO/VIDEO WILL BE AVAILABLE AT THE HILTON HEAD ISLAND LIBRARY 1. CALL TO ORDER
U.S. DOMESTIC INDUSTRY OVERVIEW FOR MAY 2009
 Inter-Office Memo Reno-Tahoe Airport Authority Date: June 30, 2009 To: Statistics Recipients From: Krys T. Bart, A.A.E., President/CEO Subject: RENO-TAHOE INTERNATIONAL AIRPORT PASSENGER STATISTICS U.S.
Weekly Performance Update
 Pr. Rupert Vancouver Grain Monitoring Program Weekly Performance Update January, 19 For Grain (1-19 CY) Summary 1. Stocks in Store (' tonnes) Country Elevators % of Working T his Week Last Week Var. fro
MONTROSE REGIONAL AIRPORT
 MONTROSE REGIONAL AIRPORT FEBRUARY 25, 2016 DRAFT AGENDA READY FOR TAKE OFF WHAT ARE WE GOING TO DO TODAY? Introductions Why conduct an airport master plan? Master Plan Process Deliverables Schedule Identify
Weekly Performance Update
 Pr. Rupert Vancouver Grain Monitoring Program Weekly Performance Update February 19, 19 For Grain (18-19 CY) Summary 1. Stocks in Store (' tonnes) Country Elevators % of Working T his Week Last Week Var.
AUGUST 2008 MONTHLY PASSENGER AND CARGO STATISTICS
 Inter-Office Memo Reno-Tahoe Airport Authority Date: October 2, 2008 To: Statistics Recipients From: Tom Medland, Director Air Service Business Development Subject: RENO-TAHOE INTERNATIONAL AIRPORT PASSENGER
January Air Traffic Statistics. Prepared by the Office of Marketing & Consumer Strategy
 January 218 Air Traffic Statistics Prepared by the Office of Marketing & Consumer Strategy This report includes only data submitted by airlines as of the date of publication: March 21, 218. Reports are