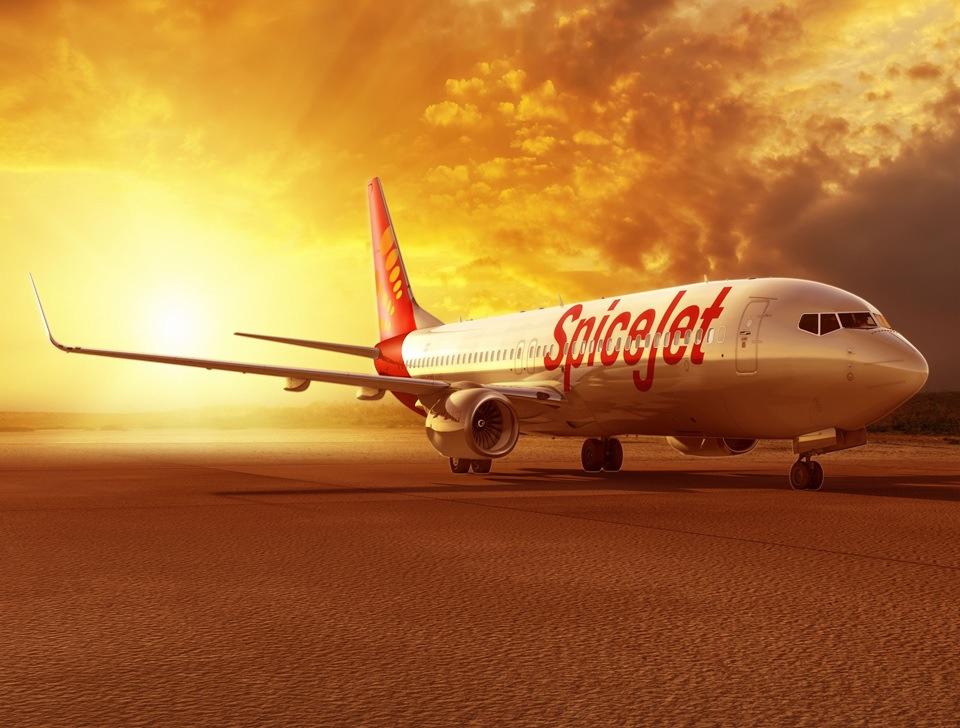
Operation snapshot. 7 International destinations
|
|
|
- Lillian Curtis
- 5 years ago
- Views:
Transcription

1 1
2 Disclaimer Information contained in our presentation is intended solely for your personal reference and is strictly confidential. Such information is subject to change without prior notice, its accuracy is not guaranteed and it may not contain all material information concerning the Company. Neither we nor our advisors make any representation regarding, and assumes no responsibility or liability for, the accuracy or completeness of, or any errors or omissions in, any information contained herein. In addition, certain statements contains our future growth prospects are forward-looking statements, which involve a number of risks and uncertainties that could cause actual results to differ materially from those in such forward-looking statements. The risks and uncertainties relating to these statements include, but are not limited to, risks and uncertainties regarding fluctuations in earnings, fluctuations in foreign exchange rates, our ability to manage growth, intense competition in aviation sector including those factors which may affect our cost advantage, wage fluctuations, our ability to attract and retain highly skilled professionals, time and cost overruns on various parameters, our ability to manage international operations, reduced demand for air travel, liability for damages, withdrawal or expiration of governmental fiscal incentives, political instability, legal restrictions on raising capital or general economic conditions affecting our industry. The words "anticipate", "believe", "estimate", "expect", "intend" and similar expressions, as they relate to us, are intended to identify certain of such forward-looking statements. The Company may, from time to time, make additional written and oral forward-looking statements, including statements contained in our reports to shareholders. The Company does not undertake to update any forward-looking statements that may be made from time to time by or on behalf of the Company unless it is required by law. 2

3 Operation snapshot 50,440 ~ Pax carried per day 35 Boeing 737 NG aircraft 20 Bombardier Q400 aircraft 380 ~ Flights per day 45 Domestic destinations 7 International destinations As on 31 st Oct 17 3
4 QUARTER HIGHLIGHTS Q2 FY18 4
5 Management Comments SpiceJet registers 11 th consecutive profitable quarter Reports highest-ever Q2 profit in its history Highest-ever Q2 profit Profits grow by 80%, Revenue by 30% Registers record Load Factor of over 90% for 30 successive months Domestic load factors in excess of 94% in Q2 Launched fourth daily flight under UDAN on the Jaisalmer-Jaipur sector Gurugram, November 13, 2017: SpiceJet reported a profit of INR crore for the three months ended September 30 th, 2017 as against INR 58.9 crore in the same quarter last year, making it the 11th successive profitable quarter for the airline. In the seasonal weak quarter, profits grew by 80% against a capacity growth of 22% during this period as against the same quarter last year. This is SpiceJet shighest Q2 profit in its history of operations. SpiceJet reported an operating revenue of INR crore in the quarter. On an EBITDA basis, SpiceJet reported a profit of INR180 crore. On an EBITDAR basis, the Company reported a profit of INR crore. SpiceJet yet again excelled on operational parameters to report the highest passenger load factor amongst all airlines in thecountry all through the quarter. The company witnessed a 7% increase in its passenger yields (Revenue per Available Seat Kilometer) while its average load factor across the network was 93.1%. SpiceJet has recorded more than 90% load factor for 30 successive months, afeat unparalleled globally. Significantly the quarter also marked the fifth consecutive month when the airline s domestic load factors have been in excess of 94%. Mr. Ajay Singh CMD, SpiceJetsaid, This has been yet another great quarter for us and I am very pleased with the exceptional performance of my team. Every quarter SpiceJet has a story which further underscores our extraordinary turnaround. ``We launched new flights on maiden routes and further emphasised our commitment for UDAN as we introduced our fourth daily flight under the scheme. Even with eleven successive profitable quarters, path-breaking initiatives, record aircraft orders and exploring new growth avenues through UDAN, I can say that we have just begun. 5
6 Management Comments The quarter also saw SpiceJet launch its 50th destination Dibrugarh further strengthening SpiceJet sfocus on North-East India as the airline now operates 26 daily flights in and out of North East, eight flights within the region besides launching a slew of flights to connect Rajasthan like never before. SpiceJet became the first airline to introduce direct flights on multiple routes like Guwahati-Dibrugarh, Jaisalmer-Delhi and Jaipur-Varanasi, and Chennai-Belagavi, besides launching its 4 th daily flight under UDAN on the Jaisalmer-Jaipur route. SpiceJet also confirmed its latest order for up to 50 Bombardier Q400 planes that was announced in the Paris Airshow, making it the largest single order ever for the Q400 turboprop aircraft program. Upon delivery, the airline may become the first in the world to operate a 90-seat turboprop, after certification by regulatory authorities. About SpiceJet Ltd SpiceJet is India s favouriteairline that has made flying affordable for more Indians than ever before. SpiceJet operates384 average daily flights to 52 destinations, including 45 domestic and 7 international ones. The airline connects its network with a fleet of 35 Boeing 737NG and 20 Bombardier Q-400s. The majority of the airline s fleet offers SpiceMax, the most spacious economy class seating in India. SpiceJet sstanding as the country s favouriteairline has been further reinforced by the multiple awards and recognitions received by the airline which includes, The CAPA Chairman s Order of Merit for fastest turnaround in FY 2016, 'Asia's Greatest Brands -2016', Global Asian of the Year Award & 'Asia's Greatest CFO 2016' at the AsiaOneAwards held in Singapore, World Travel Leaders Award at WTM London, Best Check-in Initiative award by Future Travel Experience global awards in Las Vegas, Best Domestic Airline award at the 10th ASSOCHAM International Conference & Awards (Civil Aviation & Tourism), Best Domestic Airline at the 4th South India Travel Awards held at Kochi. For more information on the release, please contact: Mr. Tushar Srivastava Ms. Sudipta Das Head, Corporate Communications Senior Manager tushar.srivastava@spicejet.com sudipta.das1@spicejet.com 6
7 Results 7
8 Results Contd 8
9 Results Contd 9
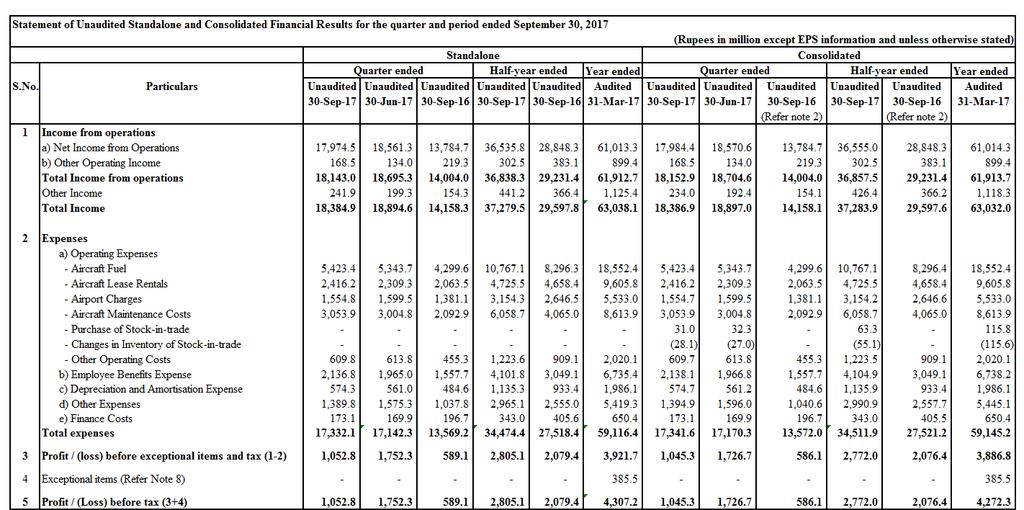
10 Results Contd 2. On July 18, 2016 and October 5, 2016 respectively, SpiceJet Merchandise Private Limited ('SMPL') and SpiceJet Technic PrivateLimited ('STPL') were incorporated as wholly owned subsidiaries of the Company. Both SMPL and STPL each have a paid-up share capital of Rs. 100,000 (10,000 equity shares of Rs.10 each) and are principally engaged in the business of trading of goods and provision of technological services relating to the aviation, aerospace and defenceindustry, respectively. As permitted by the SEBI (Listing obligations and disclosure requirements) Regulations, 2015 ( SEBI LODR ) the Company has opted to additionally submit quarterly and year-to-date consolidated results forthe current year. The comparative information in respect of the consolidated financial results for the quarter and half year ended September2016, that have been presented as a result of such option, have been prepared by the management and have not been subjected to limited review. (Also, refer note 10 below). 3. The standalone and consolidated financial results for the quarter and half year ended September 30, 2017 have been reviewedbythe Audit Committee and approved by the Board of Directors at their meeting held on November 13, The consolidated financial results includes the results of the Company and its subsidiaries SMPL and STPL (together referred to as 'the group'). 4. Based on internal reporting provided to the chief operating decision maker, the standalone financial results relate to Air transport services as the only segment of the Company. Consolidated segment information for the group is as follows: Particulars September 30, 2017 Quarter ended September 30, 2016 June 30, 2017 Half-year ended September 30, 2017 September 30, 2016 Year ended March 31, 2017 Segment Revenue a. Air transport services 18, , , , , ,912.7 b. Others Total 18, , , , , ,913.7 Segment Results a. Air transport services 1, , , , ,300.8 b. Others (3.9) (2.8) (20.7) (24.6) (2.7) (28.5) Total 1, , , , ,272.3 Segment Assets a. Air transport services 36, , , , , ,697.6 b. Others Total 37, , , , , ,880.1 Segment Liabilities a. Air transport services 40, , , , , ,999.5 b. Others Total 40, , , , , ,
11 Results Contd Segment revenue and expenses: Segment revenue and expenses represent relevant amounts that are either directly attributable to individual segment or are attributable to individual segment on a reasonable basis. Segment assets and liabilities: Segment assets and liabilities include all relevant amounts pertaining to a segment, which are directly attributable to individual segments or are attributable to individual segments on a reasonable basis. 5. The Company had in earlier financial years, received amounts aggregating Rs5,790.9 Million from Mr. Kalanithi Maran and M/S KAL Airways Private Limited ( erstwhile promoters ) as advance money towards proposed allotment of certain securities (189,091,378 share warrants and 3,750,000 non-convertible cumulative redeemable preference shares, issuable based on approvals obtained), to be adjusted at the time those securities were to be issued. Pursuant to the legal proceedings in this regard before the Hon ble High Court of Delhi ("Court") between the erstwhile promoters, the present promoter and the Company, the Court, in its order dated July 29, 2016, without expressing anything on the merits of the dispute, ordered the Company to deposit the amount of Rs. 5,790 Million as security with the Court, in 5 equal monthly instalments, and directed the parties to take necessary steps for the purpose of constitution of an Arbitral Tribunal. During the previous quarter, the Company s appeal against this order was dismissed by Hon'ble Division Bench of the Court ( Division Bench ). However the Division Bench modified the order of Hon ble Single Judge of the Court by ordering the Company to secure an amount of Rs. 3,290 Million through a bank guarantee in favourof the Registrar General of the Delhi High Court ( Registrar ) and to deposit the balance amount of Rs. 2,500 Million with the Registrar. The Company has accordingly secured Rs. 3,290 million through bank guarantee and has also deposited the amount of Rs. 2,500 million with the Registrar, within the permitted timelines. The parties to the aforementioned litigation have concurrently initiated arbitration proceedings which are ongoing before a 3member arbitral tribunal. The erstwhile promoters have made various claims against the Company and Mr. Ajay Singh ( current promoter ) citingvarious purported breaches / non-compliances with the terms of the Share Sale & Purchase Agreement ( SSPA ) dated January 29, The Company and the current promoter have disputed all such claims citing various grounds including non-compliances with the terms of the SSPA by the erstwhile promoters themselves. The arbitration is currently in progress, and the final outcome of the matter is currently not ascertainable. 11
12 Results Contd In view of the uncertainties involved as explained above, management believes that the manner, timing and other related aspects of adjustment of these amounts, are currently not determinable. The effects of this matter may attract the consequent provisions (includingpenal provisions) of applicable provisions of law, including deeming provisions, relating to acceptance of deposits. Based on their assessment andlegal advice obtained, management is of the view that any possible consequential effects, including penal consequences and any compoundingthereof, will not have a material impact on the financial results of the Company. Accordingly, no adjustments have been made for any such consequential penal effects in this regard. 6. As at September 30, 2017, the Company has total equity of (Rs. 3,326.8 Million), including accumulated losses of Rs. 19,250.1 Million. As of that date, the Company's total liabilities (including Rs. 5,790.9 million referred to in Note 5 above) exceed its total assets by Rs. 3,326.8 Million, as a result of historical market factors and the matter described in Note 5 above. These factors result in a material uncertainty that may cause significant doubt about the Company s ability to continue as a going concern. As a result of various operational, commercial and financial measures implemented over the last two years, the Company has significantly improved its liquidity position, and generated operating cash flows during that period. The Company has also earned profit after tax of Rs 4,307.2 million for the year ended March 31, 2017 and Rs2,805.1 million for the half-year ended September 30, In view of the foregoing, and having regard to industry outlook and also management's current assessment of the outcome of the matters stated in Note 5above, management is of the view that the Company will be able to maintain profitable operations and raise funds as necessary, in orderto meet its liabilities as they fall due. Accordingly, these financial results have been prepared on the basis that the Company will continue as a going concern for the foreseeable future. 7. Having regard to the status of the matters relating to the allotment and conversion of share warrants, as stated in Note 5, it is not possible to determine the dilutive effect, if any, of those on Diluted Earnings Per Share calculations. Accordingly, diluted earnings pershare for various periods presented in these financial results do not include the dilutive impact in respect of share warrants stated in Note 5 above. 8. Exceptional items in respect of the year ended March 31, 2017 relate to write-back of provision of Rs385.5 Million relating to vendor claims currently in arbitration, to the extent management believes such claims are not likely to subsist, having regard to the relevantcontractual terms, updates to arbitration proceedings, submissions thereat, and legal advice obtained by the Company. 12
13 Results, contd.. 9. Other non-current assets include, amounts aggregating Rs million representing Integrated Goods and Services Tax ( IGST ) paid under protest, on overseas repairs and replacement of various aircraft equipment, which in the opinion of management andlegal advise obtained, is not subject to such levy. Accordingly, no further adjustments have been made in this regard as at September 30, Previous periods' / year's figures have been regrouped / reclassified wherever considered necessary to conform to current periods' presentation. SMPL and STPL were incorporated as wholly owned subsidiaries of the Company on July 18, 2016 and October 5, 2016 respectively. Accordingly the figures for the current period are strictly not comparable with those of the previous periods. For SpiceJet Limited Place: Gurgaon, Haryana Date: November 13, 2017 Ajay Singh Chairman and Managing Director 13
14 Executive Summary Amt in INR million (Qtrly) CY LY FAV/-ADV Capacity(ASKM) 4,818 3,961 22% Profit & Loss summary Total Income from operations 18,143 14,004 30% Other Income % Expenses 17,332 13,569-28% EAT 1, % EBITDA 1,800 1,270 42% EBITDAR 4,216 3,334 26% Key Performance Indices Revenue / ASKM % Expenses / ASKM % EBITDAR margin 23% 24% -0.6 pps EBITDA margin 10% 9% 0.8 pps EAT margin 6% 4% 1.6 pps CY: Current year ; LY: Last year ; ASKM: Available seat kilometers ; RPKM: Revenue passenger kilometers ; RASK: Revenue per ASKM; CASK: Cost per ASKM 14
15 Revenue Breakup Amt in INR million (Qtrly) CY LY FAV/-ADV Capacity(ASKM) 4,818 3,961 22% Revenue details PAX Revenue 16,034 12,281 31% Ancillary Revenue 1,972 1,521 30% Other Operating Revenue % Other Income % Total 18,385 14,158 30% Key Performance Indices Load Factor (RPKM/ASKM) 93% 91% 1.8 pps Fare (Pax rev/pax) 3,460 3,354 3% Total RASK % PAX RASK % Other RASK % 15
16 Expense Breakup Amt in INR million (Qtrly) CY LY FAV/-ADV Capacity(ASKM) 4,818 3,961 22% Expense details Aircraft Fuel 5,423 4,300-26% Aircraft Lease Rentals 2,416 2,064-17% Airport Charges 1,555 1,381-13% Aircraft Maintenance 3,054 2,093-46% Other Operating Costs % Employee Benefits Expense 2,137 1,558-37% Depreciation and Amortisation Expense % Other Expenses 1,390 1,038-34% Finance Costs % Total Expenses 17,332 13,569-28% Key Performance Indices Total CASK % Fuel CASK % Other CASK % 16
17 Aviation Market (Domestic) 16% 29% Industry pax 21% SpiceJet pax 24% 24% 15% 31% 16,682 Industry pax 20,120 SpiceJet pax 25,023 28,747 3,283 2,480 3,077 4,037-24% FY15Q2 FY16Q2 FY17Q2 FY18Q2 % Passenger growth (YoY) FY15Q2 FY16Q2 FY17Q2 FY18Q2 Passenger in thousands 18.7% SpiceJet Market Share 12.3% 12.5% 13.8% Others 8.3% Air India 13.4% Jet 15.3% JetLite 2.3% Spicejet 13.8% FY15Q2 FY16Q2 FY17Q2 FY18Q2 Source: DGCA Statistics % Domestic market quarter ending Indigo 38.4% Go Air 8.5% As on Sep 17 17
18 Aviation Market (International) Industry pax SpiceJet pax 54% Industry pax SpiceJet pax 29% 4,155 4,550 5,128 5,843 9% 9% 13% 14% 17% -4% FY15Q2 FY16Q2 FY17Q2 FY18Q2 % Passenger growth (YoY) SpiceJet Market Share FY15Q2 FY16Q2 FY17Q2 FY18Q2 Passenger in thousands Air India 43.5% 8.3% 8.0% 6.4% 6.2% Indigo 13.3% FY15Q2 FY16Q2 FY17Q2 FY18Q2 Spicejet 8.0% % Domestic market quarter ending Jet 35.1% As on Sep 17 Source: DGCA Statistics 18
19 Financial Highlights Total Revenue Total Expenses 14,780 11,207 14,158 18,385 FY15Q2 FY16Q2 FY17Q2 FY18Q2 INR million 17,885 10,917 13,569 17,332 FY15Q2 FY16Q2 FY17Q2 FY18Q2 INR million EBITDAR EAT ,053 (3,104) 204 2,693 3,334 4,216 FY15Q2 FY16Q2 FY17Q2 FY18Q2 INR million FY15Q2 FY16Q2 FY17Q2 FY18Q2 INR million 19
20 Key Indicators Capacity Revenue Expenses Total RASK Passenger load factor 93% 91% 91% 7% 16% 2% 39% 38% 26% 22% 30% 82% -24% -24% -28% -34% FY15Q2 FY16Q2 FY17Q2 FY18Q FY15Q2 FY16Q2 FY17Q2 FY18Q2 % Growth (YoY) (Fav/-Adv) EBITDAR margin EAT margin CASK (Fuel) CASK (Others) 24% 24% 23% 1% 3% 4% 6% % FY15Q2 FY16Q2 FY17Q2 FY18Q FY15Q2 FY16Q2 FY17Q2 FY18Q2 % total revenue INR 20
21 HALF YEARLY HIGHLIGHTS YTD18 21
22 Executive Summary Amt in INR million (YTD) CY LY FAV/-ADV Capacity(ASKM) 9,387 7,844 20% Profit & Loss summary Total Income from operations 36,838 29,219 26% Other Income % Expenses 34,474 27,518-25% EAT 2,805 2,079 35% EBITDA 4,283 3,418 25% EBITDAR 9,009 8,077 12% Key Performance Indices Revenue / ASKM % Expenses / ASKM % EBITDAR margin 24% 27% -3.1 pps EBITDA margin 11% 12% -0.1 pps EAT margin 8% 7% 0.5 pps 22
23 Revenue Breakup Amt in INR million (YTD) CY LY FAV/-ADV Capacity(ASKM) 9,387 7,844 20% Revenue details PAX Revenue 32,954 25,715 28% Ancillary Revenue 3,641 3,156 15% Other Operating Revenue % Other Income % Total 37,279 29,598 26% Key Performance Indices Load Factor (RPKM/ASKM) 93% 91% 1.8 pps Fare (Pax rev/pax) 3,692 3,479 6% Total RASK % PAX RASK % Other RASK % 23
24 Expense Breakup Amt in INR million (YTD) CY LY FAV/-ADV Capacity(ASKM) 9,387 7,844 20% Expense details Aircraft Fuel 10,767 8,296-30% Aircraft Lease Rentals 4,725 4,658-1% Airport Charges 3,154 2,333-35% Aircraft Maintenance 6,059 4,065-49% Other Operating Costs 1,223 1,223 0% Employee Benefits Expense 4,102 3,049-35% Depreciation and Amortisation Expense 1, % Other Expenses 2,965 2,555-16% Finance Costs % Total Expenses 34,474 27,518-25% Key Performance Indices Total CASK % Fuel CASK % Other CASK % 24
25 Aviation Market (Domestic) Industry pax SpiceJet pax Industry pax SpiceJet pax 12% 13% 20% 23% 29% 16% 25% % YTD15 YTD16 YTD17 YTD18 % Passenger growth (YoY) YTD15 YTD16 YTD17 YTD18 Passenger in millions 18.7% SpiceJet Market Share 12.3% 12.5% 13.8% Others 8.3% Air India 13.4% Jet 15.3% JetLite 2.3% Spicejet 13.8% YTD15 YTD16 YTD17 YTD18 Source: DGCA Statistics % Domestic market year ending Indigo 38.4% Go Air 8.5% As on Sep 17 25
26 Aviation Market (International) 29% Industry pax SpiceJet pax 52% 8.4 Industry pax 9.2 SpiceJet pax % 12% 9% 14% 14% -8% YTD15 YTD16 YTD17 YTD18 % Passenger growth (YoY) SpiceJet Market Share YTD15 YTD16 YTD17 YTD18 Passenger in millions Air India 43.5% 8.3% 8.0% 6.4% 6.2% Indigo 13.3% YTD15 YTD16 YTD17 YTD18 Spicejet 8.0% Source: DGCA Statistics % Domestic market year ending Jet 35.1% As on Sep 17 26
27 Financial Highlights Total Revenue Total Expenses 31,856 22,545 29,598 37,279 YTD15 YTD16 YTD17 YTD18 INR million EBITDAR 36,201 21,525 27,518 34,474 YTD15 YTD16 YTD17 YTD18 INR million EAT 1,020 2,079 2,805 2,515 5,774 8,077 9,009 YTD15 YTD16 YTD17 YTD18 INR million (4,346) YTD15 YTD16 YTD17 YTD18 INR million 27
28 Key Indicators Capacity Revenue Expenses Total RASK Passenger load factor 41% 37% 31% 20% 26% 81% 90% 91% 93% 7% -1% -3% -29% -28% -25% -34% YTD15 YTD16 YTD17 YTD YTD15 YTD16 YTD17 YTD18 % Growth (YoY) EBITDAR margin 26% EAT margin 27% 24% CASK (Fuel) CASK (Others) 8% 5% 7% 8% % YTD15 YTD16 YTD17 YTD18 % total revenue YTD15 YTD16 YTD17 YTD18 INR 28
Operation snapshot. 7 International destinations
 1 Disclaimer Information contained in our presentation is intended solely for your personal reference and is strictly confidential. Such information is subject to change without prior notice, its accuracy
Operation snapshot. 7 International destinations
 1 Disclaimer Information contained in our presentation is intended solely for your personal reference and is strictly confidential. Such information is subject to change without prior notice, its accuracy
Financial Results Q1 FY September 2017
 Financial Results Q1 FY18 12 September 2017 2 Key Highlights Q1FY18 Net profit after tax of INR 58cr Ninth successive profitable quarter for the Group Gross debt reduced by INR 398cr and net debt almost
Financial Results Q3 FY16
 Financial Results Q3 FY16 6 February 2016 Agenda Key performance highlights Jet Airways performance highlights JetLite performance highlights 2 Key highlights Highest ever quarterly and period profit Jet
Financial Results Q2 FY December 2017
 Financial Results Q2 FY18 07 December 2017 2 Key Highlights Q2FY18 Net profit after tax of INR 71cr Ten successive profitable quarters for the Group Net debt reduced during the quarter by INR 194cr Continued
Key Highlights Q4FY18
 Key Highlights Q4FY18 Net loss after tax of INR 1,040cr Q4FY18 results adversely impacted on account of: Year-on-Year impact of increase in fuel prices of INR 366 crores; Mark-to-market adjustment due
Financial Results Q2 FY November 2016
 Financial Results Q2 FY17 11 November 2016 2 Agenda Key performance highlights Jet Airways performance highlights 3 Key highlights Net profit after tax of INR 84.9 crores - Sixth successive profitable
Financial Results Q2 FY December 2017
 Financial Results Q2 FY18 07 December 2017 2 Key Highlights Q2FY18 Net profit after tax of INR 71cr Ten successive profitable quarters for the Group Net debt reduced during the quarter by INR 194cr Continued
Certain statements in this release concerning Jet Airways future growth prospects are forward-looking statements, which involve a number of risks,
 Certain statements in this release concerning Jet Airways future growth prospects are forward-looking statements, which involve a number of risks, and uncertainties that could cause actual results to differ
SpiceJet announces Q2FY15 results: Year-on-year capacity up 7%, revenues up 15%, and expenses down 2% as turnaround efforts gain ground
 SpiceJet announces Q2FY15 results: Year-on-year capacity up 7%, revenues up 15%, and expenses down 2% as turnaround efforts gain ground SpiceJet is pleased to report significant year-over-year improvement
Financial Results Q3 FY February 2016
 Financial Results Q3 FY17 03 February 2016 2 Agenda Key performance highlights Jet Airways performance highlights 3 Key highlights Net profit after tax of INR 156.3 crores - Seventh successive profitable
Disclosure under Regulation 30 of the SEBI (Listing Obligations and Disclosure Requirements) Regulations, 2015
 Regulations, 2015") September 10, 2018 Department of Corporate Services, BSE Limited, Phiroz Jeejeebhoy Towers, Dalal Street, Mumbai - 400 001 Reference: Subject: Scrip Code: 500285 and Scrip ID: SPICEJET Disclosure under
September 10, 2018 Department of Corporate Services, BSE Limited, Phiroz Jeejeebhoy Towers, Dalal Street, Mumbai - 400 001 Reference: Subject: Scrip Code: 500285 and Scrip ID: SPICEJET Disclosure under
JET AIRWAYS (I) LTD. Presentation on Financial Results Q July 24, 2009
 LTD. Presentation on Financial Results Q July 24, 2009") JET AIRWAYS (I) LTD Presentation on Financial Results Q1 2010 July 24, 2009 1 1 1 Agenda Domestic operating environment Jet Airways performance highlights JetLite performance highlights Outlook 2 2 2 Domestic
JET AIRWAYS (I) LTD Presentation on Financial Results Q1 2010 July 24, 2009 1 1 1 Agenda Domestic operating environment Jet Airways performance highlights JetLite performance highlights Outlook 2 2 2 Domestic
Financial Results Q3FY February
 Financial Results Q3FY18 14 February Key Highlights Q3FY18 Net profit after tax of INR 186cr Eleven successive profitable quarters for the Group Operating revenue increased by 10.2% and PLF% by 4.4pts
Financial Results Q3 FY15. Financial Results Q3 FY 2015
 Financial Results Q3 FY15 Financial Results Q3 FY 2015 6-February-2015 Agenda Domestic operating environment Jet Airways performance highlights JetLite performance highlights Domestic Operating Environment
JET AIRWAYS (I) LTD. Presentation on Financial Results Q2 FY10
 LTD. Presentation on Financial Results Q2 FY10") JET AIRWAYS (I) LTD Presentation on Financial Results Q2 FY10 October 27, 2009 1 1 1 Agenda Domestic operating environment Jet Airways performance highlights JetLite performance highlights Outlook 2 2
JET AIRWAYS (I) LTD Presentation on Financial Results Q2 FY10 October 27, 2009 1 1 1 Agenda Domestic operating environment Jet Airways performance highlights JetLite performance highlights Outlook 2 2
JET AIRWAYS (I) LTD. Presentation on Financial Results Q4 FY08
 LTD. Presentation on Financial Results Q4 FY08") JET AIRWAYS (I) LTD Presentation on Financial Results Q4 FY08 June 24, 2008 1 1 1 Agenda Domestic operating environment Jet Airways performance highlights JetLite performance highlights Consolidated Jet
JET AIRWAYS (I) LTD Presentation on Financial Results Q4 FY08 June 24, 2008 1 1 1 Agenda Domestic operating environment Jet Airways performance highlights JetLite performance highlights Consolidated Jet
JET AIRWAYS (I) LTD. Presentation on Financial Results Q3 2012
 LTD. Presentation on Financial Results Q3 2012") JET AIRWAYS (I) LTD Presentation on Financial Results Q3 2012 20.01.2012 1 1 1 Domestic operating environment 2 2 2 Domestic industry. 8.00 7.00 6.00 5.00 4.00 3.00 Q3 12 vs Q3 11 Industry capacity 17%
JET AIRWAYS (I) LTD Presentation on Financial Results Q3 2012 20.01.2012 1 1 1 Domestic operating environment 2 2 2 Domestic industry. 8.00 7.00 6.00 5.00 4.00 3.00 Q3 12 vs Q3 11 Industry capacity 17%
Jet Airways (India) Ltd. Presentation on Financial Results Q3 FY th January 2008
 Ltd. Presentation on Financial Results Q3 FY th January 2008") Jet Airways (India) Ltd. Presentation on Financial Results Q3 FY08 28 th January 2008 1 1 1 Agenda Performance highlights Q3 FY08 Apr - Dec FY08 Outlook JetLite performance highlights 2 2 2 Performance
Jet Airways (India) Ltd. Presentation on Financial Results Q3 FY08 28 th January 2008 1 1 1 Agenda Performance highlights Q3 FY08 Apr - Dec FY08 Outlook JetLite performance highlights 2 2 2 Performance
Agenda. Domestic operating environment. Jet Airways performance highlights. JetLite performance highlights
 Agenda Domestic operating environment Jet Airways performance highlights JetLite performance highlights Domestic Operating Environment Domestic Industry Capacity & Market Market share Q2 FY2015 Jet Airways
JET AIRWAYS (I) LTD. Financial Results Q1 FY09
 LTD. Financial Results Q1 FY09") JET AIRWAYS (I) LTD Presentation on Financial Results Q1 FY09 July 29, 2008 1 1 1 Agenda Domestic operating environment Jet Airways performance highlights JetLite performance highlights Outlook 2 2 2 Domestic
JET AIRWAYS (I) LTD Presentation on Financial Results Q1 FY09 July 29, 2008 1 1 1 Agenda Domestic operating environment Jet Airways performance highlights JetLite performance highlights Outlook 2 2 2 Domestic
Jet Airways (India) Ltd. Presentation on Financial Results Q2 FY th October 2007
 Ltd. Presentation on Financial Results Q2 FY th October 2007") Jet Airways (India) Ltd. Presentation on Financial Results Q2 FY08 29 th October 2007 1 1 1 Agenda Performance highlights Q2 FY08 HI FY08 Outlook JetLite performance highlights 2 2 2 Performance highlights
Jet Airways (India) Ltd. Presentation on Financial Results Q2 FY08 29 th October 2007 1 1 1 Agenda Performance highlights Q2 FY08 HI FY08 Outlook JetLite performance highlights 2 2 2 Performance highlights
CONTACT: Investor Relations Corporate Communications
 NEWS RELEASE CONTACT: Investor Relations Corporate Communications 435.634.3200 435.634.3553 Investor.relations@skywest.com corporate.communications@skywest.com SkyWest, Inc. Announces Second Quarter 2016
Jet Airways (India) Ltd. Presentation on Annual Results FY06. May 2006
 Ltd. Presentation on Annual Results FY06. May 2006") Jet Airways (India) Ltd. Presentation on Annual Results FY06 May 2006 1 Agenda 1. Performance Highlights 2. Sahara Acquisition Update 3. Outlook 2 Performance Highlights 3 Domestic landscape capacity growth
Jet Airways (India) Ltd. Presentation on Annual Results FY06 May 2006 1 Agenda 1. Performance Highlights 2. Sahara Acquisition Update 3. Outlook 2 Performance Highlights 3 Domestic landscape capacity growth
CONTACT: Investor Relations Corporate Communications
 NEWS RELEASE CONTACT: Investor Relations Corporate Communications 435.634.3200 435.634.3553 Investor.relations@skywest.com corporate.communications@skywest.com SkyWest, Inc. Announces Second Quarter 2017
FOURTH QUARTER RESULTS 2017
 FOURTH QUARTER RESULTS 2017 KEY RESULTS In the 4Q17 Interjet total revenues added $5,824.8 million pesos that represented an increase of 10.8% over the revenue generated in the 4Q16. In the 4Q17, operating
CONTACT: Investor Relations Corporate Communications
 NEWS RELEASE CONTACT: Investor Relations Corporate Communications 435.634.3200 435.634.3553 Investor.relations@skywest.com corporate.communications@skywest.com SkyWest, Inc. Announces Fourth Quarter 2017
Cebu Air, Inc. 2Q2014 Results of Operation
 Cebu Air, Inc. 2Q2014 Results of Operation 1 Disclaimer This information provided in this presentation is provided only for your reference. Such information has not been independently verified and, as
THIRD QUARTER RESULTS 2017
 THIRD QUARTER RESULTS 2017 KEY RESULTS In the 3Q17 Interjet total revenues added $5,835.1 million pesos that represented an increase of 22.0% over the revenue generated in the 3Q16. In the 3Q17, operating
--- Disclosure A uirements) A~ulatlons October 24, 2018 IGAUSECT / /1 0
 A~ulatlons October 24, 2018 IGAUSECT / /1 0") October 24, 2018 IGAUSECT /1 0-1 8/1 0 To National Stock Exchange of India limited Exchange Plaza, C - 1, Block G Sandra Kurla Complex Sandra - (E) Mumbai - 400 051 Symbol: INDIGO To Department of Corporate
October 24, 2018 IGAUSECT /1 0-1 8/1 0 To National Stock Exchange of India limited Exchange Plaza, C - 1, Block G Sandra Kurla Complex Sandra - (E) Mumbai - 400 051 Symbol: INDIGO To Department of Corporate
Copa Holdings Reports Record Earnings of US$41.8 Million for 4Q06 and US$134.2 Million for Full Year 2006
 Copa Holdings Reports Record Earnings of US$41.8 Million for 4Q06 and US$134.2 Million for Full Year 2006 Panama City, Panama --- March 7, 2007. Copa Holdings, S.A. (NYSE: CPA), parent company of Copa
SkyWest, Inc. Announces First Quarter 2018 Profit
 NEWS RELEASE CONTACT: Investor Relations Corporate Communications 435.634.3200 435.634.3553 Investor.relations@skywest.com corporate.communications@skywest.com SkyWest, Inc. Announces First Quarter 2018
Cebu Air, Inc. 4 th Quarter and Full Year 2017 Results of Operations. cebupacificair.com
 Cebu Air, Inc. 4 th Quarter and Full Year 2017 Results of Operations cebupacificair.com Disclaimer The information provided in this presentation is provided only for your reference. Such information has
OPERATING AND FINANCIAL HIGHLIGHTS
 Copa Holdings Reports Financial Results for the Fourth Quarter of 2015 Excluding special items, adjusted net income came in at $31.7 million, or EPS of $0.73 per share Panama City, Panama --- February
THIRD QUARTER AND NINE MONTHS OF 2014 KEY RESULTS
 THIRD QUARTER AND NINE MONTHS OF 2014 KEY RESULTS In 3Q14 INTERJET total revenues were $ 3,643.4 million, representing an increase of 9.9% on revenues generated in the 3Q13. Accumulated 9M14 INTERJET total
SKYWEST, INC. ANNOUNCES THIRD QUARTER 2014 RESULTS
 NEWS RELEASE For Further Information Contact: Investor Relations Telephone: (435) 634-3203 Fax: (435) 634-3205 FOR IMMEDIATE RELEASE: October 29, 2014 SKYWEST, INC. ANNOUNCES THIRD QUARTER 2014 RESULTS
FIRST QUARTER RESULTS 2017
 FIRST QUARTER RESULTS 2017 KEY RESULTS In the 1Q17 Interjet total revenues added $4,421.5 million pesos that represented an increase of 14.8% over the income generated in the 1Q16. In the 1Q17, operating
Q3 FY18 Business Highlights
 Q3 FY18 RESULTS Q3 FY18 Business Highlights 1 2 3 4 5 6 7 Record passengers 7.1m, record revenues 423m Investing in growth 24% passenger growth in Q3 Disciplined cost management flat ex-fuel CASK Largest
VietJet Aviation Joint Stock Company Key Highlights Q1/2017 Business result. Apr 2017
 VietJet Aviation Joint Stock Company Key Highlights Q1/2017 Business result Apr 2017 Disclaimer INFORMATION CONTAINED IN OUR PRESENTATION IS INTENDED SOLELY FOR YOUR REFERENCE. SUCH INFORMATION IS SUBJECT
OPERATING AND FINANCIAL HIGHLIGHTS
 Copa Holdings Reports Financial Results for the Fourth Quarter of 2018 Excluding special items, adjusted net profit came in at $44.0 million, or Adjusted EPS of $1.04 Panama City, Panama --- February 13,
AIR CANADA REPORTS THIRD QUARTER RESULTS
 AIR CANADA REPORTS THIRD QUARTER RESULTS THIRD QUARTER OVERVIEW Operating income of $112 million compared to operating income of $351 million in the third quarter of 2007. Fuel expense increased 49 per
Adjusted net income of $115 million versus an adjusted net loss of $7 million in the second quarter of 2012, an improvement of $122 million
 Air Canada Reports Record Second Quarter 2013 Results Highest Adjusted Net Income, Operating Income and EBITDAR Results for Second Quarter in Air Canada s History Adjusted net income of $115 million versus
OPERATING AND FINANCIAL HIGHLIGHTS SUBSEQUENT EVENTS
 Copa Holdings Reports Net Income of US$6.2 Million and EPS of US$0.14 for the Third Quarter of 2015 Excluding special items, adjusted net income came in at $37.4 million, or EPS of $0.85 per share Panama
Investor Update September 2017 PARTNER OF CHOICE EMPLOYER OF CHOICE INVESTMENT OF CHOICE
 Investor Update September 2017 PARTNER OF CHOICE EMPLOYER OF CHOICE INVESTMENT OF CHOICE 1 Forward Looking Statements In addition to historical information, this presentation contains forward-looking statements
THIRD QUARTER RESULTS 2018
 THIRD QUARTER RESULTS 2018 KEY RESULTS In the 3Q18 Interjet total revenues added $ 6,244.8 million pesos that represented an increase of 7.0% over the revenue generated in the 3Q17. In the 3Q18, operating
OPERATING AND FINANCIAL HIGHLIGHTS
 Copa Holdings Reports Net Income of US$32.0 Million and EPS of US$0.72 for the Second Quarter of 2012 Excluding special items, adjusted net income came in at $58.6 million, or EPS of $1.32 per share Panama
Half Year F1 Results. November 4, 2015
 Half Year F1 Results November 4, 2015 F17 Q1 Results 20 JULY 2016 Q1 BUSINESS HIGHLIGHTS Passenger growth of 18% to 5.8m pax on 17% seat growth Record underlying profit of 38.6m (+14%) despite Easter effect
OPERATING AND FINANCIAL HIGHLIGHTS. Subsequent Events
 Copa Holdings Reports Net Income of $103.8 million and EPS of $2.45 for the Third Quarter of 2017 Excluding special items, adjusted net income came in at $100.8 million, or EPS of $2.38 per share Panama
Copa Holdings Reports Net Income of $49.9 million and EPS of $1.18 for the Second Quarter of 2018
 Copa Holdings Reports Net Income of $49.9 million and EPS of $1.18 for the Second Quarter of 2018 Panama City, Panama --- Aug 8, 2018. Copa Holdings, S.A. (NYSE: CPA), today announced financial results
Cathay Pacific Airways Limited Abridged Financial Statements
 To provide shareholders with information on the results and financial position of the Group s significant listed associated company, Cathay Pacific Airways Limited, the following is a summary of its audited
OPERATING AND FINANCIAL HIGHLIGHTS SUBSEQUENT EVENTS
 Copa Holdings Reports Financial Results for the Third Quarter of 2016 Excluding special items, adjusted net income came in at $55.3 million, or adjusted EPS of $1.30 per share Panama City, Panama --- November
FIRST QUARTER RESULTS 2016
 FIRST QUARTER RESULTS 2016 KEY RESULTS In 1Q16 Interjet total revenues added $3,850.8 million pesos that represented an increase of 21.9% over the income generated in the 1Q15. In 1Q16 total passengers
Copa Holdings Reports Fourth Quarter and Full Year 2007 Results
 Copa Holdings Reports Fourth Quarter and Full Year 2007 Results Panama City, Panama --- February 21, 2008. Copa Holdings, S.A. (NYSE: CPA), parent company of Copa Airlines and Aero Republica, today announced
Copa Holdings Reports Net Income of $57.7 million and EPS of $1.36 for the Third Quarter of 2018
 Copa Holdings Reports Net Income of $57.7 million and EPS of $1.36 for the Third Quarter of 2018 November 14, 2018 PANAMA CITY, Nov. 14, 2018 /PRNewswire/ -- Copa Holdings, S.A. (NYSE: CPA), today announced
Investor Update Issue Date: April 9, 2018
 Investor Update Issue Date: April 9, 2018 This investor update provides guidance and certain forward-looking statements about United Continental Holdings, Inc. (the Company or UAL ). The information in
Tiger Airways Holdings Limited FY11 Results
 Tiger Airways Holdings Limited FY11 Results May 2011 Financial Year Ended 31 March 2011 Disclaimer The information contained in this presentation (the "Information") is provided by Tiger Airways Holdings
PRESS RELEASE Financial Results. Rising passenger traffic at 12.5m Exceeding 1bn in consolidated revenue
 PRESS RELEASE 2016 Financial Results Rising passenger traffic at 12.5m Exceeding 1bn in consolidated revenue Kifissia, 23 March 2017 AEGEAN reports full year 2016 results with consolidated revenue at 1,020m,
AIR CANADA REPORTS 2010 THIRD QUARTER RESULTS; Operating Income improved $259 million or 381 per cent from previous year s quarter
 AIR CANADA REPORTS 2010 THIRD QUARTER RESULTS; Operating Income improved $259 million or 381 per cent from previous year s quarter MONTRÉAL, November 4, 2010 Air Canada today reported operating income
PRESS RELEASE. First Half 2017 Financial Results Higher Load Factors and traffic lead to a significant rebound in second quarter profitability
 PRESS RELEASE First Half 2017 Financial Results Higher Load Factors and traffic lead to a significant rebound in second quarter profitability Kifissia, 12 September 2017 AEGEAN announces first half 2017
NORWEGIAN AIR SHUTTLE ASA QUARTERLY REPORT SECOND QUARTER 2006 [This document is a translation from the original Norwegian version]
![NORWEGIAN AIR SHUTTLE ASA QUARTERLY REPORT SECOND QUARTER 2006 [This document is a translation from the original Norwegian version]](/thumbs/74/71229964.jpg "NORWEGIAN AIR SHUTTLE ASA QUARTERLY REPORT SECOND QUARTER 2006 [This document is a translation from the original Norwegian version]") NORWEGIAN AIR SHUTTLE ASA QUARTERLY REPORT SECOND QUARTER 2006 SECOND QUARTER IN BRIEF had earnings before tax of MNOK 24.8 (20.6) in the second quarter. The operating revenue increased by 44 % this quarter,
NORWEGIAN AIR SHUTTLE ASA QUARTERLY REPORT SECOND QUARTER 2006 SECOND QUARTER IN BRIEF had earnings before tax of MNOK 24.8 (20.6) in the second quarter. The operating revenue increased by 44 % this quarter,
Copa Holdings Reports Net Income of US$113.9 Million for the Fourth Quarter of 2013
 Copa Holdings Reports Net Income of US$113.9 Million for the Fourth Quarter of 2013 Panama City, Panama --- February 12, 2014. Copa Holdings, S.A. (NYSE: CPA), today announced financial results for the
SKYWEST, INC. ANNOUNCES THIRD QUARTER 2012 RESULTS
 NEWS RELEASE For Further Information Contact: Michael J. Kraupp Chief Financial Officer and Treasurer Telephone: (435) 634-3212 Fax: (435) 634-3205 FOR IMMEDIATE RELEASE: November 7, 2012 SKYWEST, INC.
OPERATING AND FINANCIAL HIGHLIGHTS. Subsequent Events
 Copa Holdings Reports Net Income of US$113.1 Million and EPS of US$2.57 for the First Quarter of 2015 Excluding special items, adjusted net income came in at US$106.0 million, or EPS of US$2.41 per share
Copa Holdings Reports Earnings of US$30.3 Million and EPS of US$0.70 for 3Q08
 Copa Holdings Reports Earnings of US$30.3 Million and EPS of US$0.70 for 3Q08 Panama City, Panama --- November 13, 2008. Copa Holdings, S.A. (NYSE: CPA), parent company of Copa Airlines and Aero Republica,
SECOND QUARTER RESULTS 2018
 SECOND QUARTER RESULTS 2018 KEY RESULTS In the 2Q18 Interjet total revenues added $ 5,781.9 million pesos that represented an increase of 9.6% over the revenue generated in the 2Q17. In the 2Q18, operating
Copa Holdings Reports Net Income of $136.5 million and EPS of $3.22 for the First Quarter of 2018
 Copa Holdings Reports Net Income of $136.5 million and EPS of $3.22 for the First Quarter of 2018 May 9, 2018 PANAMA CITY, May 9, 2018 /PRNewswire/ -- Copa Holdings, S.A. (NYSE: CPA), today announced financial
OPERATING AND FINANCIAL HIGHLIGHTS
 Copa Holdings Reports Net Income of US$18.6 Million and EPS of US$0.42 for the Second Quarter of 2010 Excluding special items, adjusted net income came in at $26.3 million, or $0.60 per share Panama City,
Cathay Pacific Airways Limited Abridged Financial Statements
 To provide shareholders with information on the results and financial position of the Group s significant listed associated company, Cathay Pacific Airways Limited, the following is a summary of its audited
Key Highlights Q2/2018 Business result. July 2018
 Key Highlights Q2/2018 Business result July 2018 Disclaimer INFORMATION CONTAINED IN OUR PRESENTATION IS INTENDED SOLELY FOR YOUR REFERENCE. SUCH INFORMATION IS SUBJECT TO CHANGE WITHOUT NOTICE, ITS ACCURACY
MIRAMAR, Fla., April 29, 2015 (GLOBE NEWSWIRE) -- Spirit Airlines, Inc. (Nasdaq:SAVE) today reported first quarter 2015 financial results.
 -- Spirit Airlines, Inc. (Nasdaq:SAVE) today reported first quarter 2015 financial results.") April 29, 2015 Spirit Airlines Announces First Quarter 2015 Results; Adjusted Net Income Increases 87.1 Percent to $70.7 Million and Pre-Tax Margin Increases 900 Basis Points to 22.7 Percent MIRAMAR, Fla.,
April 29, 2015 Spirit Airlines Announces First Quarter 2015 Results; Adjusted Net Income Increases 87.1 Percent to $70.7 Million and Pre-Tax Margin Increases 900 Basis Points to 22.7 Percent MIRAMAR, Fla.,
1Q13 R sults esentation
 1Q13 Results Presentation 14 May 2013 Disclaimer The presentation is dated the day it is given. The delivery of this presentation shall not, under any circumstances, create any implication that there has
1Q 2017 Earnings Call. April 18, 2017
 1Q 2017 Earnings Call April 18, 2017 Safe Harbor Statement Certain statements included in this presentation are forward-looking and thus reflect our current expectations and beliefs with respect to certain
Analyst and Investor Conference Call Q Ulrik Svensson, CFO and Member of the Executive Board
 Analyst and Investor Conference Call Q2 2017 Ulrik Svensson, CFO and Member of the Executive Board Frankfurt, 2 August 2017 Disclaimer The information herein is based on publicly available information.
Copa Holdings Reports Net Income of US$51.9 Million for the Fourth Quarter of 2008 and US$152.2 Million for Full Year 2008
 Copa Holdings Reports Net Income of US$51.9 Million for the Fourth Quarter of 2008 and US$152.2 Million for Full Year 2008 Panama City, Panama --- February 19, 2009. Copa Holdings, S.A. (NYSE: CPA), parent
44th Consecutive Profitable Quarter Fourth Quarter Fully Diluted Earnings per Share of $0.94 Full Year Fully Diluted Earnings per Share of $4.
 Allegiant Travel Company Fourth Quarter and Full Year 2013 Financial Results January 29, 2014 1:00 PM PT 44th Consecutive Profitable Quarter Fourth Quarter Fully Diluted Earnings per Share of $0.94 Full
OPERATING AND FINANCIAL HIGHLIGHTS. Subsequent Events
 Copa Holdings Reports Financial Results for the First Quarter of 2016 Excluding special items, adjusted net income came in at US$69.9 million, or EPS of US$1.66 per share Panama City, Panama --- May 5,
Criteria for an application for and grant of, or variation to, an ATOL: Financial
 Consumer Protection Group Air Travel Organisers Licensing Criteria for an application for and grant of, or variation to, an ATOL: Financial ATOL Policy and Regulations 2016/01 Contents Contents... 1 1.
Wizz Air aims to increase market share with F17 capacity growth of 20% Q3 passenger growth of 20%, Load Factor of 88% (+2.3ppt)
") Q3 F17 FINANCIAL RESULTS 1 FEBRUARY 2017 BUSINESS HIGHLIGHTS Current market conditions favour ULCCs Wizz Air aims to increase market share with F17 capacity growth of 20% Q3 passenger growth of 20%, Load
Q3 F17 FINANCIAL RESULTS 1 FEBRUARY 2017 BUSINESS HIGHLIGHTS Current market conditions favour ULCCs Wizz Air aims to increase market share with F17 capacity growth of 20% Q3 passenger growth of 20%, Load
Quarterly Interim Management Statement. Three Months to June 30, 2015
 Quarterly Interim Management Statement Three Months to June 30, 2015 BUSINESS HIGHLIGHTS FOR Q1 Record Q1 profitability despite negative Easter effect Lower unit costs further increasing our cost advantage
OVERSEAS REGULATORY ANNOUNCEMENT
 Hong Kong Exchanges and Clearing Limited and The Stock Exchange of Hong Kong Limited take no responsibility for the contents of this announcement, make no representation as to its accuracy or completeness
Thank you for participating in the financial results for fiscal 2014.
 Thank you for participating in the financial results for fiscal 2014. ANA HOLDINGS strongly believes that safety is the most important principle of our air transportation business. The expansion of slots
Air Arabia. Investor Presentation. 1 st Quarter 2015
 Air Arabia Investor Presentation 1 st Quarter 2015 Disclaimer Information contained in this presentation is subject to change without notice, its accuracy is not guaranteed and it may not contain all material
Fourth Quarter 2006 Results Presentation February 15, 2007
 Fourth Quarter 2006 Results Presentation February 15, 2007 This presentation may include forward-looking comments regarding the Company s business outlook and anticipated financial and operating results.
Earnings Report 1 st Quarter 2016 Grupo Viva Aerobus
 Earnings Report 1 st Quarter 2016 Grupo Viva Aerobus Grupo Viva Aerobus announces results for the first quarter of 2016 Mexico City, Mexico, April 29, 2016- Grupo Viva Aerobus S.A. de C.V. ( Grupo Viva
ANALYST MEETING 3Q2015
 ANALYST MEETING 3Q2015 November 12, 2015 DISCLAIMER The presentation is dated the day it is given. The delivery of this presentation shall not, under any circumstances, create any implication that there
Financial Results 1 st Quarter Mar/2016 (FY2015) 30 July, 2015
 30 July, 2015") Financial Results Mar/2016 (FY2015) 30 July, 2015 Today s Topics P.2 P.3 P.15 1 Overview of FY Mar/2016 Financial Results Operating Revenue Operating Profit 320 307.0 +4.9Bn (+1.6%) 312.0 50 +17.6Bn (+94.6%)
Financial Results Mar/2016 (FY2015) 30 July, 2015 Today s Topics P.2 P.3 P.15 1 Overview of FY Mar/2016 Financial Results Operating Revenue Operating Profit 320 307.0 +4.9Bn (+1.6%) 312.0 50 +17.6Bn (+94.6%)
AEROFLOT ANNOUNCES FY 2017 IFRS FINANCIAL RESULTS
 AEROFLOT ANNOUNCES FY 2017 IFRS FINANCIAL RESULTS Moscow, 1 March 2018 Aeroflot Group ( the Group, Moscow Exchange ticker: AFLT) today publishes its audited financial statements in accordance with International
Spirit Airlines Reports First Quarter 2017 Results
 Spirit Airlines Reports First Quarter 2017 Results MIRAMAR, Fla., April 28, 2017 - Spirit Airlines, Inc. (NASDAQ: SAVE) today reported first quarter 2017 financial results. GAAP net income for the first
NORWEGIAN AIR SHUTTLE ASA QUARTERLY REPORT FIRST QUARTER 2004 [This document is a translation from the original Norwegian version]
![NORWEGIAN AIR SHUTTLE ASA QUARTERLY REPORT FIRST QUARTER 2004 [This document is a translation from the original Norwegian version]](/thumbs/87/95085804.jpg "NORWEGIAN AIR SHUTTLE ASA QUARTERLY REPORT FIRST QUARTER 2004 [This document is a translation from the original Norwegian version]") NORWEGIAN AIR SHUTTLE ASA QUARTERLY REPORT 2004 IN BRIEF At the start of 2003, Norwegian has become a pure low-fare airline. The Fokker F-50 operations have been terminated, and during the quarter the
NORWEGIAN AIR SHUTTLE ASA QUARTERLY REPORT 2004 IN BRIEF At the start of 2003, Norwegian has become a pure low-fare airline. The Fokker F-50 operations have been terminated, and during the quarter the
Volaris Reports Strong First Quarter 2015: 32% Adjusted EBITDAR Margin, 9% Operating Margin
 Volaris Reports Strong First Quarter 2015: 32% Adjusted EBITDAR Margin, 9% Operating Margin Mexico City, Mexico, April 22, 2015 Volaris* (NYSE: VLRS and BMV: VOLAR), the ultra-low-cost airline serving
Air Arabia. Investor Presentation. Sharjah, UAE: September 2013
 Air Arabia Investor Presentation Sharjah, UAE: September 2013 Disclaimer Information contained in this presentation is subject to change without notice, its accuracy is not guaranteed and it may not contain
Passenger: 17.2 Million (+3.9% yoy) OTP: 85.8% SLF: 73.3% Subsidiaries Operating Revenues US$415.2 Million Cargo Carried 219.4K ton (+10.
 OTP: 85.8% SLF: 73.3% Subsidiaries Operating Revenues US$415.2 Million Cargo Carried 219.4K ton (+10.") Value* 14.78 3.36 4.97 Volume** 32.85 9.59 13.43 Last Price 423 342 348 Market Cap.*** 8.74 8.85 9.01 Note: * Average Value in Billion Rupiah ** Average Volume in Million *** Market Capitalization in Trillion
Value* 14.78 3.36 4.97 Volume** 32.85 9.59 13.43 Last Price 423 342 348 Market Cap.*** 8.74 8.85 9.01 Note: * Average Value in Billion Rupiah ** Average Volume in Million *** Market Capitalization in Trillion
J.P. Morgan Aviation, Transportation and Industrials Conference
 J.P. Morgan Aviation, Transportation and Industrials Conference March 3, 08 Scott Kirby President Safe Harbor Statement Certain statements included in this presentation are forward-looking and thus reflect
Vietjet Aviation Joint Stock Company Key Highlights Q1/2018 Business result. April 2018
 Vietjet Aviation Joint Stock Company Key Highlights Q1/2018 Business result April 2018 Disclaimer INFORMATION CONTAINED IN OUR PRESENTATION IS INTENDED SOLELY FOR YOUR REFERENCE. SUCH INFORMATION IS SUBJECT
Financial Results 3 rd Quarter MAR/2016 (FY2015)
") Financial Results MAR/2016 (FY2015) January 29 th, 2016 CONTENTS P.1 P.2 P.3 P.4~ Overview of FY MAR/16 Results Operating Revenue Operating Profit 1,030 1,020 1,010 +1.0Bn 1,022.3 1,023.4 (+0.1%) 180 160
Financial Results MAR/2016 (FY2015) January 29 th, 2016 CONTENTS P.1 P.2 P.3 P.4~ Overview of FY MAR/16 Results Operating Revenue Operating Profit 1,030 1,020 1,010 +1.0Bn 1,022.3 1,023.4 (+0.1%) 180 160
Ref. PE004/ May Subject: Management Discussion and Analysis for the First Quarter of 2018
 Ref. PE004/2561 10 May 2018 Subject: Management Discussion and Analysis for the First Quarter of 2018 Attention: President The Stock Exchange of Thailand According to the financial reports of Nok Airlines
EASYJET INTERIM MANAGEMENT STATEMENT FOR THE QUARTER ENDED 31 DECEMBER 2010
 20 January 2011 easyjet Interim Management Statement Page 1 of 5 20 January 2011 EASYJET INTERIM MANAGEMENT STATEMENT FOR THE QUARTER ENDED 31 DECEMBER 2010 Highlights: Total revenue up by 7.5% to 654
JAPAN AIRLINES Co., Ltd. Financial Results 1 st Quarter Mar/2017(FY2016) July 29, 2016
 July 29, 2016") JAPAN AIRLINES Co., Ltd. Financial Results Mar/2017(FY2016) July 29, 2016 Today s Topics P.1 P.2 P.13 From the first quarter of this fiscal year, figures for Revenue Passengers Carried, ASK, RPK and Load
JAPAN AIRLINES Co., Ltd. Financial Results Mar/2017(FY2016) July 29, 2016 Today s Topics P.1 P.2 P.13 From the first quarter of this fiscal year, figures for Revenue Passengers Carried, ASK, RPK and Load
Citi Industrials Conference
 Citi Industrials Conference June 13, 2017 Andrew Levy Executive Vice President and Chief Financial Officer Safe Harbor Statement Certain statements included in this presentation are forward-looking and
AIR CANADA REPORTS FULL YEAR AND FOURTH QUARTER 2010 RESULTS
 AIR CANADA REPORTS FULL YEAR AND FOURTH QUARTER 2010 RESULTS Record annual EBITDAR of $1.386 billion, 104 per cent improvement Operating income improvement of $677 million Employees to receive special