DEPARTMENT OF AIRPORTS BOARD MEETING. 17 January 2018 AGENDA
|
|
|
- Oscar Patrick
- 5 years ago
- Views:
Transcription
1 DEPARTMENT OF AIRPORTS BOARD MEETING 17 January 2018 AGENDA
2 SALT LAKE CITY DEPARTMENT OF AIRPORTS BOARD MEETING AGENDA 17 January :00 A.M. CONSENT AGENDA A. Minutes of the 13 December 2017 Meeting DISCUSSION ITEMS B. Director s Report Bill Wyatt, Executive Director, SLCDA C. Airport Redevelopment Program (ARP) Update Mike Williams, ARP Director, SLCDA D. Year-End Financial Audit Ryan Tesch, Director of Finance, SLCDA E. Election of Board Chair and Vice-Chair INFORMATION ITEMS A. Financial Report November 2017 B. Air Traffic Statistics November 2017 C. Comparison of On-Time Operations October 2017 D. Construction Report January 2018 E. Media Clippings January 2018 The next meeting will be held on Wednesday, February 21, 2018, at 8:00 a.m. Meetings are held in the Board Room located on the third level of the short-term parking garage. People with disabilities may make requests for reasonable accommodations no later than 48 hours in advance in order to attend this Airport Board Meeting. Accommodations may include alternate formats, interpreters, and other auxiliary aids. This is an accessible facility. For questions or additional information, please contact LuJean Christensen at
3 DEPARTMENT OF AIRPORTS BOARD MEETING 17 January 2018 MINUTES
4 SALT LAKE CITY DEPARTMENT OF AIRPORTS MINUTES OF ADVISORY BOARD MEETING 13 December 2017 Members Present: Excused: Mayor s Office: City Council Office: Department of Airports: J.T. Martin, Chair Larry Pinnock, Vice-Chair Igor Best-Devereux Mickey Gallivan Sam Granato Senator Karen Mayne Cyndy Miller Steven Price Kim Rolfe Wade Bitner Natalie Gochnour Mayor Jacqueline M. Biskupski Patrick Leary James Rogers Russell Weeks Bill Wyatt, Executive Director Eddie Clayson, Director of Maintenance Kristen Elder, Management Analyst Pete Higgins, Director of Operations Marco Kunz, Attorney Allen McCandless, Director of Planning Kevin Robins, Director of Engineering Ryan Tesch, Director of Finance Craig Vargo, Police Chief Nancy Volmer, Director of Public Relations & Marketing Mike Williams, TRP Program Director J.T. Martin called the meeting to order at 8:08 am. Martin welcomed Executive Director Bill Wyatt, Councilman James Rogers, and Mayor Jacqueline Biskupski. AGENDA A. Minutes The motion was made by Igor Best-Devereux and seconded by Cyndy Miller to approve the minutes of October 18, 2017 as presented. All votes were affirmative; motion passed.
5 Airport Advisory Board Meeting Minutes 13 December 2017 B. Director s Report Bill Wyatt, Executive Director, updated the Airport Advisory Board regarding current events. Wyatt thanked Airport staff for bringing him up to speed on current issues and stated that he has spent a great deal of time learning about the scope, schedule and budget of the Airport Redevelopment Program (ARP). He also stated his intention to characterize the big picture of the project and what it will mean for our community at the next meeting. Wyatt reported on his recent meeting in Atlanta with Delta Air Lines network planning group. He acknowledged the value of Delta s partnership and their perspective on the ARP since they are involved with several large construction projects around the country. Delta s growth remains steady, with most of the growth in SLC coming from the local O&D market, reflecting Utah s strong economy. The upgauging of their equipment accounts for the increased passenger volume and service to more distant markets. This year, Delta will have fewer than 40 regional jet daily departures from SLC, as compared to 250 a decade ago. Today s assessment of the triangle between SLC, SEA and LAX has strengthened our position as a hub airport because we are a very strong collector for communities in the Intermountain West. Wyatt remarked that understanding how these networks function is critically important to the success of SLC and our role within the community. He emphasized that Delta is unequivocally committed to the redevelopment project and that the construction schedule is of great importance to them. Wyatt stated the ARP construction continues to go well and incredible progress is seen each month. The completion of the first phase is still scheduled for August Weekly meetings between the Airport and the ARP team will be shifting to a new format, discussing construction and operational transition on alternating weeks. Wyatt announced the grand opening of the new convenience store on December 19 th, referring to a flyer in the Board packet with additional details. Wyatt described the convenience store as a great asset which remains very accessible in spite of the traffic pattern changes on northbound Terminal Drive. Steven Price arrived at the meeting at 8:13 am. Martin asked if Wyatt s meeting with Delta included any discussion on adding international service. Wyatt stated that Delta is very pleased with the flights to Amsterdam and Paris, although adding frequency is unlikely. The seasonal flight to London is constrained by the fact that few passengers connect beyond London because that market is pretty well owned by British Airways. Although Delta has a partnership with Virgin Atlantic, expanding service to London would also have a negative impact on the existing Paris and Amsterdam routes. Delta has a very strong joint venture with Aeromexico, which will begin service from SLC to Mexico City on December 23 rd and to Guadalajara in January. The South America market is also under consideration. Delta s current Asian hub is in Narita, approximately 90 minutes from Tokyo. This hub is slowly dwindling because Delta does not have any Japanese partners to carry traffic beyond Narita to other Asian countries. 2
6 Airport Advisory Board Meeting Minutes 13 December 2017 Delta has added new service from Seattle to Hong Kong and also to Incheon (Seoul, South Korea), where they have recently partnered with Korean Air. An eventual hub in Incheon would allow passengers to connect to an additional 60 cities throughout Asia. Wyatt intends to focus on expanding the number international flights out of SLC in the future. In addition to working with community organizations and business which have a lot of international travel, he will be acquiring data which will detail the number of passengers originating in SLC with a final destination in various Asian cities. Best-Devereux encouraged Airport staff to work with various tourism organizations to promote SLC as a destination for international travelers. C. Airport Redevelopment Program Update Mike Williams, Airport Redevelopment Program (ARP) Director, presented an update on the ARP (presentation on file). Main points included were: CGMP #4 Landside and Airside Enabling status CGMP #5 Terminal/South Concourse West/Gateway status CGMP #6 Roadways/Parking Garage/Central Utility Plant status CGMP #7 Baggage Handling System status CGMP #9 Apron Paving Taxilane 20/21 status North Concourse Project status Project statistics Overall program construction and paving sequence Near term schedule Overall capital equipment costs Job progress photos North Concourse secure area boundary and fencing North Concourse site access Larry Pinnock asked Williams to describe the size of the new parking structure relative to the current one. Williams explained that the new parking structure will have 3,600 public spaces as compared to 1,200 in the existing structure. Each of the five levels of the new structure is the approximate size of three football fields. Mickey Gallivan asked for a definition of clerestory windows. Williams explained they are windows near the roofline to bring natural light into the concourses. Pinnock congratulated Williams and his team for the reported 867 days without a lost time injury. Miller wondered at what point delays with the steel erection would be cause for concern. Williams acknowledged that there had been some start-up delays on steel erection and it will be an area of continual focus, but they have resequenced plans with the contractor and there is no cause for concern at this time. 3
7 Airport Advisory Board Meeting Minutes 13 December 2017 Senator Karen Mayne inquired where the steel for the project came from. Williams indicated most of it is fabricated in Montana by ADF International, with some of the specialized columns made in Canada. Mayne asked if Nucor bid for the steel contract. Kevin Robins reported that Nucor has placed bids, but their bids have been very high. Martin asked what type of dust mitigation was being used for the concrete crushing process on the apron paving projects. Williams explained that the pile is kept wet and debris is contained during the crushing process. Best-Devereux asked if the refined costs for the North Concourse would be presented during the January meeting. Wyatt replied in the affirmative. Best-Devereux inquired if pricing would be reevaluated for the new parking garage to maximize revenue. Wyatt answered that the pricing would be carefully examined. Pinnock asked Williams to outline the timing of the transition. Approximately nine months prior to the opening of the first phase, Concourse E will be demolished and a hard stand operation will be established. This will allow crews to perform work which is necessary to have all of the international gates operational on opening day. When the North Concourse opens near the end of December 2020, 15 of the 20 gates will be operational. The project team is working closely with Delta on phasing for apron paving and other work which needs to be done before the remaining five gates on the North Concourse will open. After opening day, work will begin on the central tunnel and demolition of the existing garage, terminals and concourses. Wyatt recognized the foresight of Airport staff to build the first tunnel 20 years ago at a cost of $8-10 million, stressing the importance of always thinking about the future. Councilman James Rogers asked who will oversee the transition for airside operations. Williams explained that he and his team would begin the initial transition planning in January, noting that several individuals on the project team have experience in this area, as does Thom Lang of Delta Air Lines. Wyatt acknowledged that this transition period between opening day and completion of the South Concourse East would be the most challenging part of the project. The Airport will be spending a great deal of time working to minimize inconvenience while keeping passengers focused on the future. Martin asked Mayor Biskupski for comments. Mayor Biskupski asked that discussion of the report done on the inland port be added to the agenda for a future meeting. Best-Devereux and Martin also asked to discuss the Northwest Quadrant and the possibility of an additional runway at a future meeting. D. Public Meetings Training 4
8 Airport Advisory Board Meeting Minutes 13 December 2017 Marco Kunz, Senior City Attorney, presented the Open and Public Meetings Training which is required by the State law to the Board (presentation on file). Main points included were: Notice of meetings annual schedule, and posting requirements. Records of open meetings, both written minutes and a recording, are required. Many situations are fact specific. If issues arise, please contact Kunz or someone at the City Attorney s office for specific advice. All communications s, letters, etc. are subject to GRAMA requests. GRAMA is all inclusive and extensive. Martin requested clarification regarding discussion of matters not on the agenda. Kunz explained that the Board may listen to (but not ask questions regarding) matters not on the agenda if they allow public comment and someone from the public brings it up. If the topic is of interest to the Board, it may be scheduled on the agenda for a future meeting. The Act is intended to prevent a lengthy discussion about a topic which hasn t been noticed to the public. Martin asked Councilman Rogers how discussion of matters not on the agenda is handled during City Council meetings. Rogers responded that the Council meetings always stay on topic. A City attorney is present to stop the discussion if it begins to go off-topic. Martin inquired about the type of response which would be given to someone bringing a sign or banner to a Board meeting. Although not specifically addressed in the Utah Open and Public Meetings Act, displaying a sign or banner would fall under provisions of the First Amendment. Kunz reiterated that individuals willfully disrupting or seriously compromising a meeting would be asked to leave. Time, place and manner restrictions may be placed upon peaceful and orderly protests if there are safety or logistical concerns. Airport staff would speak with individuals wishing to protest during a Board meeting to determine the type and location of their intended activity. Airport police may also be consulted if needed. Wyatt noted there is an enormous body of law around airports and the First Amendment, and that this remains a fluid area of the law. Martin asked if the Utah Open and Public Meetings Act would apply to Board members attending the grand opening of the convenience store. Kunz answered that because Board members are not convening as a meeting, the gathering is not subject to the Act. E. Nominations for Board Chair and Vice-Chair The motion was made by Igor Best-Devereux and seconded by Sam Granato to nominate Larry Pinnock as Airport Advisory Board Chair for All votes were affirmative; motion passed. The motion was made by Mayor Biskupski and seconded by Igor Best-Devereux to nominate Cynthia Miller as Airport Advisory Board Vice-Chair for All votes were affirmative; motion passed. 5
9 Airport Advisory Board Meeting Minutes 13 December 2017 Voting by acclamation will be conducted at the January Advisory Board meeting, scheduled on 17 January The next Board meeting will be held on January 17, J.T. Martin adjourned the meeting at 9:28 a.m. J.T. Martin, Chair Date Jacqueline M. Biskupski, Mayor Date 6
10 DEPARTMENT OF AIRPORTS BOARD MEETING 17 January 2018 DISCUSSION ITEMS
11 SALT LAKE CITY AIRPORT BOARD AGENDA: DISCUSSION ITEM (B) DATE: 17 January 2018 TO: FROM: SUBJECT: Airport Board Bill Wyatt, Executive Director Executive Director s Report Bill Wyatt will present a monthly informational report to the Board, may include: 1. ARP progress 2. Ground transportation update 3. Concessions and rental cars 4. Airport safety and security 5. Airport facilities and operations 6. General aviation 7. Passenger and airport users 8. Environmental matters 9. Financial condition 10. Legislative issues 11. Airlines 12. Communications and marketing
12 SALT LAKE CITY AIRPORT BOARD AGENDA: DISCUSSION ITEM (C) DATE: 17 January 2018 TO: FROM: SUBJECT: Airport Board Bill Wyatt, Executive Director Airport Redevelopment Program Update Mike Williams, Airport Redevelopment Program (ARP) Director, will present an update on the SLC Airport Redevelopment Program (presentation on file).
13 Salt Lake City International Airport Airport Redevelopment Program Status Update:

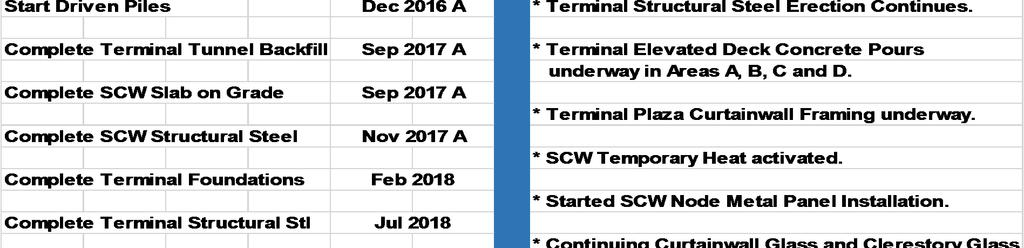
14 CGMP# 4 Landside and Airside Enabling Project: CGMP# 4 - Landside and Airside Enabling Budget: $81.09M EAC: $77.42M Terminal/South Concourse West/Gateway/Roadways/Airside and Landside Enabling and Central Utility Plant Hydronic Piping Current Status Schedule Recent Milestones Achieved Activity Target Date Complete Seq 2 Tunnel Excavation Complete SCW Surcharge Complete West Lift Station Pumps Complete SCW Ductbank Complete Gateway Hydronic Piping Substantial Completion Dec 2016 A Dec 2016 A Mar 2017 A Mar 2017 A May 2017 A Apr 2017 * Mid-Concourse Tunnel Tie-in Lid Forming Underway * Mid-Concourse Tunnel Tie-in first Lid Concrete Pour scheduled for week of 1/8/2018. * Close-out Process Underway * Final CGMP Close-out Dependent on Mid- Concourse Tunnel Construction Completion Concerns/Issues/Risks * None at this time Salt Lake City International Airport 2


15 CGMP# 5 Terminal/South Concourse West/Gateway Salt Lake City International Airport 3


16 CGMP# 6 Roadways/Parking Garage/Central Utility Plant Salt Lake City International Airport 4


17 CGMP# 7 Baggage Handling System Salt Lake City International Airport 5

18 CGMP# 9 Apron Paving Taxilane 20/21 Salt Lake City International Airport 6


19 CGMP# 9A SCW Apron Paving and Hydrant Fueling Salt Lake City International Airport 7

20 North Concourse Project Project: North Concourse Project Budget: As CGMPs are Approved North Concourse Phase 1 and Phase 2 and Associated Airfield Scope of Work Current Status Schedule Recent Milestones Achieved Activity Target Date Issued Design Documents May 2017 A * AOJV Continued Sitework for Construction Field Offices. Submit 5/12 Deliverable Comments June 2017 A * AOJV Submitted Recommendations to Award for Receive Enabling Design Package June 2017 A DP15 - Enabling Phase 1 Scopes of Work. Receive CMAR/Consultant Estimates July 2017 A * AOJV Submitted CGMP# 14 - General Conditions Phase 1 for Committee Approval. Complete Estimate Reconciliation Oct 2017 A * AOJV Submitted CGMP# 15 - Enabling Phase 1 Start Enabling Construction Jan 2018 for Committee Approval. Concerns/Issues/Risks Sessions * Trade Contractor Capacity to Bid. Salt Lake City International Airport 8
21 Project Statistics Safety Statistics Through 1/05/ Days without a Lost Time Injury 1,885,443 Hours Worked to Date Trade Staffing 1/05/ Trade Workers on Site Local Trades Contract Local/Non-Local Awarded Statistics Dollar Value Trade Count Percentage Total Local (Wasatch Front) Contractors $750,562, % Total Out of State Contractors $377,144, % Total Contract Awards $1,127,707, % Contract Union/Merit Shop Awarded Statistics Union Trades Dollar Value Trade Count Percentage Total Union Contractors Total Merit Shop Contractors $369,591, % $758,116, % Total Contract Awards $1,127,707, % Salt Lake City International Airport 9

22 Overall Program Construction & Paving Sequence South Concourse West Metal Deck Completed Q South Concourse West BHS Started Q Terminal Steel Erection Started Q Airfield Taxiway and Taxilane Demo, Lighting & Paving Completed Q4-17 South Concourse - West Exterior Wall System Started Q Terminal Floor Slab Pours Started Q Terminal Level 0 MEP Started Q Terminal Level 1 U/G MEP Started Q Elevated Roadway West Ramp Construction Started Q CUP Hydronic Piping Started Q2-16 Elevated Roadway Column and East Ramp Construction Started Q Parking Garage Structural Columns, Pile Caps and Grade Beams Started Q Central Utility Plant (CUP) Foundation Construction Started Q1-17 Central Utility Plant (CUP) Steel Erection and Equipment Setting Started Q3-17 Salt Lake City International Airport 10


23 Near Term Schedule Overall the Program Schedule Critical Path Reflects that the Program is on Schedule. Salt Lake City International Airport 11
24 Overall Airport Redevelopment Program Budget Total ARP Construction Cost CGMP 01 HDJV Preconstruction Services $ 9,575,407 CGMP 02 HDJV General Conditions Services $ 105,983,964 CGMP 03 QTA / RSS Site Work, Utilities, Civil Enabling Work Phase 1 $ 88,721,327 CGMP 04 Terminal / SCW / Roadways Enabling & CUP Hydronic Lines $ 81,096,441 CGMP 05 Terminal / SCW / Gateway $ 788,346,442 CGMP 06 Parking Garage & Elevated Roadways $ 363,855,782 CGMP 07 TRP Baggage Handling System $ 87,585,765 CGMP 09 Taxilanes 20 & 21 / Taxiways A & B $ 26,761,610 CGMP 09A Apron Paving Terminal / SCW $ 76,135,399 CGMP 10 South Concourse East $ 395,174,615 CGMP 11 Apron Paving SCE $ 201,388,791 CGMP 12 Existing Structure Demolition $ 20,788,411 CGMP 13 AOJV Preconstruction Services $ 15,483,607 CGMP 14 AOJV General Conditions $ 87,131,131 CGMP 15 NCP Enabling Phase 1 $ 28,222,187 CGMP 16 North Concourse Phase 1 and Mid Concourse Tunnel $ 297,192,031 CGMP 17 NCP Baggage Handling System $ 56,071,065 CGMP 18 NCP Apron Paving and Fueling Phase 1 $ 83,323,433 CGMP 19 North Concourse Phase 2 and Central Tunnel $ 212,535,351 CGMP 20 NCP Apron Paving and Fueling Phase 2 $ 42,110,130 CGMP 21 NCP FF&E/Furniture $ 4,121,026 Total Program Construction Cost $ 3,071,603,915 ARP Soft Cost Terminal Redevelopment Program Soft Cost $271,316,222 North Concourse Program Soft Cost $153,950,554 Total Program Soft Cost $425,266,776 Owner Reserve Terminal Redevelopment Program Owner Reserve $38,482,957 North Concourse Program Owner Reserve $40,617,352 Total Program Owner Reserve $79,100,309 Total Airport Redevelopment Program Budget $ 3,575,971,000 Salt Lake City International Airport 12


25 Job Progress Photos Terminal Building Terminal structural steel and metal decking, viewed from the north Baggage Trapeze steel installation begun in Terminal Salt Lake City International Airport Ramp Tower Structural Steel Erected 13


26 Job Progress Photos South Concourse West SCW curtain wall, sheathing, insulation and masonry SCW south sloped curtain wall from the interior SCW baggage conveyor installation Salt Lake City International Airport Construction at Mid-Concourse Tunnel 14


 Salt Lake City")

27 Job Progress Photos Parking Garage, Roadways, CUP Level 2 deck poured Forms and supports for Level 3 deck Forms and supports for Level 2 deck Level 1 slab-on-grade Parking Garage progress Large diameter Chiller piping installation progress (CUP) Salt Lake City International Airport Roadway columns constructed between exit roads 15


28 Job Progress Aerial South Concourse West Terminal structural steel erection Elevated Roadways columns & bents Parking Deck elevated slabs N Terminal / Gateway Area Salt Lake City International Airport 16


29 North Concourse Secure Area Salt Lake City International Airport 17


30 North Concourse Construction Site Fencing Salt Lake City International Airport 18

31 Phase 1 Complete and Start of Demolition Demolition Construction complete Salt Lake City International Airport 20

32 Current Program Final Phase Completed Salt Lake City International Airport 21
33 SALT LAKE CITY AIRPORT BOARD AGENDA: DISCUSSION ITEM (D) DATE: 17 January 2018 TO: FROM: SUBJECT: Airport Board Bill Wyatt, Executive Director Year-End Financial Audit Ryan Tesch, Director of Finance, will present the FY2017 Year-End Financial Audit to the Board (presentation on file).

34 Salt Lake City International Airport Salt Lake City Department of Airports Review of Financial Audit as of June 30, 2017 SLC Airport Board January 17, 2018 Page 1

35 Salt Lake City International Airport FY 2017 Financial & Operational Highlights Passenger traffic increased 4.9% over FY 2016 Landed weights increased 6.3% over FY 2016 Operating Revenue increased 9.5% over FY 2016 Issued $1 Billion of 2017 GARBS Bonds TRP/NCP spent to date over $660m Page 2
36 Salt Lake City International Airport Total Passenger Traffic 24,000,000 23,691,200 23,000,000 22,594,800 22,000,000 21,674,200 21,000,000 20,585,600 20,000,000 20,083,600 19,000,000 FY2013 FY2014 FY2015 FY2016 FY2017 Page 3
37 Salt Lake City International Airport 2400 Total Passengers (000 s) Jul Aug Sep Oct Nov Dec Jan Feb Mar Apr May Jun FY 15 FY 16 FY 17 FY 18 Page 4
 $30.00 $27.00 $24.00 $21.00 $18.00 $15.")

38 Salt Lake City International Airport SLC s airline costs per enplaned passenger (CPE) have remained lower than other airports. (FY 2016) $30.00 $27.00 $24.00 $21.00 $18.00 $15.00 $12.00 $9.00 $6.00 $3.00 $0.00 $3.69 $6.35 $10.10 $10.28 $11.05 $11.05 $14.83 $16.53 $18.68 $25.45 $28.05 SLC MSP SEA PDX LAS DEN LAX SFO LGA JFK EWR Source: Industry survey. Page 5
39 Salt Lake City International Airport Cost Per Enplaned Passenger (CPE) Ten Year History - SLC Airline CPE is the industry s standard performance indicator. $4.50 $4.00 $3.50 $3.41 $3.41 $3.58 $3.83 $3.84 $3.90 $3.65 $3.69 $3.56 $3.00 $3.17 $2.50 FY08 FY09 FY10 FY11 FY12 FY13 FY14 FY15 FY16 FY17 Source: Airport records. Page 6
 (12,169,200) (1,098,200) Operating Expense (97,539,400) (99,459,900) (1,920,500) Net Operating Income $ 46,781,600 $ 55,346,200 $ 8,253,700 Page")
40 Salt Lake City International Airport Budget Comparison Description FY 2017 Budget FY 2017 Actual Favorable / (Unfavorable) Operating Revenue $155,392,000 $ 166,975,300 $ 11,583,300 Airline Revenue Sharing (11,071,000) (12,169,200) (1,098,200) Operating Expense (97,539,400) (99,459,900) (1,920,500) Net Operating Income $ 46,781,600 $ 55,346,200 $ 8,253,700 Page 7
41 Salt Lake City International Airport Airline Use Agreement Rates and Charges FY17 Due or (Owe) Calculation Amount LANDING FEES Due $ 24,896,400 Less Net Billed (24,905,300) Net Owed to Airlines ($8,900) TERMINAL RENTS Due $ 29,230,000 Less Net Billed (30,145,600) Net Owed to Airlines ($915,600) Net Owed to Airlines for the FY17 Reconciliation ($924,500*) * Amount owed to Airlines will be rolled forward into the FY19 rates. Page 8

42 Salt Lake City International Airport Comparison of Actual Operating Revenues $160,000 $140,000 $132,270,100 $ 141,032,600 $ 154,806,100 Thousands $120,000 $100,000 $80,000 $60,000 $40,000 $20,000 $0 FY 2015 FY 2016 FY 2017 Airline Revenue $ 49,481,200 $ 51,512,800 $ 54,469,900 Concessions $ 68,566,200 $ 74,623,000 $ 83,355,300 Leases / Cost Recovery $ 11,677,700 $ 12,101,000 $ 13,997,500 State Aviation Fuel Tax $ 2,545,100 $ 2,795,800 $ 2,983,400 Page 9
43 Salt Lake City International Airport $110,000 Airline and Non-Airline Revenues (000 s) $100,000 $90,000 $89,520 $100,336 % Increase Airline Revenues FY10 to FY17 26% % Increase Non- Airline Revenues FY10 to FY17 57% $80,000 $70,000 $60,000 $50,000 $64,105 $43,393 $67,765 $45,612 $82,789 $78,379 $75,657 $69,699 $47,761 $48,199 $48,620 $49,481 $51,513 $54,470 $120,000 $100,000 $80,000 $60,000 $40,000 $43,393 $ 54,470 $ 100,336 $ 64,105 $40,000 $20,000 $30, Airline Revenues Non-Airline Revenues $0 Airline Revenues FY 08 Actual Non-Airline Revenues Page 10

44 Salt Lake City International Airport Comparison of Concession Revenue Revenue Category FY 2015 Actual FY 2016 Actual FY 2017 Actual Auto Parking / Ground Transportation $ 33,209,600 $ 35,844,100 $ 37,221,900 Car Rental 19,340,900 22,142,200 27,186,200 Restaurants 9,715,700 9,994,500 10,989,500 Retail 5,308,600 5,538,500 5,984,800 Advertising 991,400 1,103,600 1,145,600 TOTAL CONCESSION REVENUE: $ 68,566,200 $ 74,622,900 $ 82,528,000 Page 11


45 Salt Lake City International Airport Gross Sales per Enplaned Passenger (EPAX) Five Year History - SLC Thousands $105,000 $90,000 $75,000 $60,000 $45,000 $30,000 $15,000 $0 FY 13 FY 14 FY 15 FY 16 FY 17 Restaurants $44,661,100 $49,468,100 $55,233,200 $60,203,600 $63,133,600 Retail $20,615,800 $26,424,900 $29,325,400 $30,749,000 $32,000,300 EPAX 10,044,100 10,294,700 10,833,700 11,293,000 11,850,200 Page 12


46 Salt Lake City International Airport Comparison of Actual Operating Expenses $ 99,459,800 Thousands $100,000 $90,000 $80,000 $70,000 $60,000 $50,000 $40,000 $30,000 $20,000 $10,000 $0 $ 86,664,500 $ 90,065,100 FY 2015 FY 2016 FY 2017 Salaries & Benefits $ 44,336,300* $ 45,096,200 $ 49,350,100 Materials & Supplies $ 9,486,900 $ 10,939,900 $ 11,725,300 Charges & Services $ 32,841,300 $ 34,029,000 $ 38,384,400 *$10.5 million in expenses reduced for OPEB and GASB 68. With adjustment was $33,880,500 Page 13
47 Salt Lake City International Airport Sources and uses of funds for the Series 2017 Bonds Sources of Funds Bond Par Amount $1,000,000,000 Original Issue Premium 126,480,830 Total Sources of Funds $1,126,480,830 Uses of Funds Project Fund Deposit $884,074,072 Capitalized Interest 165,225,778 Debt Service Reserve Fund 73,664,500 Issuance Costs 3,516,481 Total Uses of Funds $1,126,480,830 Page 14


48 Salt Lake City International Airport Thank You Page 15
49 SALT LAKE CITY AIRPORT BOARD AGENDA: DISCUSSION ITEM (E) DATE: 17 January 2018 TO: FROM: SUBJECT: Airport Board Bill Wyatt, Executive Director Election of Board Chair and Vice-Chair The Board will be asked to elect the Chair and Vice-Chair for At the last meeting, the Board nominated Larry Pinnock as Chair and Cynthia Miller as Vice-Chair.
50 DEPARTMENT OF AIRPORTS BOARD MEETING 17 January 2018 INFORMATIONAL ITEMS
51 SALT LAKE CITY DEPARTMENT OF AIRPORTS (An Enterprise Fund of Salt Lake City Corporation) Statements of Net Position (Amounts in Thousands) November 30, ASSETS Current Assets Cash and cash equivalents $ 262,162 $ 150,036 Restricted cash and cash equivalents 51,841 - Investments 11, Airline and rental fees receivable 19,523 17,525 Other assets 4,463 4,263 Total current assets 349, ,174 Noncurrent Assets Restricted cash and cash equivalents 848, ,109 Restricted investments 39,465 - Investments 32,765 44,600 Other assets 2,000 2,851 Total noncurrent assets and investments 922, ,560 Capital assets Land 104,590 99,347 Building and improvements 1,369,273 1,278,012 Equipment 141, ,191 Construction in progress 579, ,649 Total capital assets - at cost 2,194,594 1,816,199 Less accumulated depreciation 950, ,666 Net capital assets 1,244, ,533 Total noncurrent assets 2,167,169 1,129,093 Total Assets 2,517,057 1,301,267 Deferred Outflows of Resources 11,948 10,182 Total Assets and Deferred Ouflows of Resources $ 2,529,005 $ 1,311,449
52 SALT LAKE CITY DEPARTMENT OF AIRPORTS (An Enterprise Fund of Salt Lake City Corporation) Statements of Net Position (Amounts in Thousands) November 30, LIABILITIES Current Liabilities Accounts payable $ 14,566 $ 10,298 Accrued compensation 2,565 2,378 Interest payable 20,833 - Other accrued liabilities 4,363 5,823 Total current liabilities 42,327 18,499 Noncurrent Liabilities Revenue bonds payable 1,123,247 - Noncurrent compensation liability 3,790 3,629 Net pension liability 27,424 25,465 Other accrued liabilities 14,116 3,878 Total noncurrent liabilities 1,168,577 32,972 Total Liabilities 1,210,904 51,471 Deferred Inflows of Resources 6,781 5,627 NET POSITION Net investment in capital assets 801, ,533 Restricted for Capital projects 69, ,757 Debt service 189,503 - Unrestricted 250, ,061 Net Position 1,311,320 1,254,351 Total Liabilities, Deferred Inflows of Resources, and Net Position $ 2,529,005 $ 1,311,449
53 SALT LAKE CITY DEPARTMENT OF AIRPORTS (An Enterprise fund of Salt Lake City Corporation) Statements of Revenues, Expenses, and Changes in Fund Net Position (Amounts in Thousands) for the five month period ended November, Operating Revenues Airline revenue $ 30,789 $ 28,385 Terminal concessions 7,754 7,370 Landside concessions 28,566 26,003 Lease revenue 2,505 2,272 General aviation 1,144 1,124 State aviation tax 1,313 1,294 Other revenue 3,096 1,952 Operating revenues 75,167 68,400 Less airline revenue sharing (5,381) (4,928) Total operating revenues 69,786 63,472 Operating Expenses Salaries and benefits 21,181 20,095 Materials and supplies 3,688 3,511 Maintenance contracts 3,759 3,560 Charges and services 3,694 3,643 Utilities 2,737 2,759 Inter-governmental 2,601 2,553 Other expense 1,851 1,851 Total operating expenses before depreciation 39,511 37,972 Operating Income Before Depreciation 30,275 25,500 Depreciation Expense 26,944 27,247 Operating Income/(Loss) 3,331 (1,747) Non-Operating Revenues (Expenses) Passenger facility charges 20,275 18,722 Customer facility charges 6,353 6,894 Interest income 7, Interest expense (19,268) - Gain on disposition of property and equipment Net non-operating income 14,487 26,586 Capital Contributions Contributions and grants, principally Airport Improvement Program 5,694 7,276 Total capital contributions 5,694 7,276 Net Position Increase in net position 23,512 32,115 Net Position, beginning of period 1,287,808 1,222,235 Net Position, end of period $ 1,311,320 $ 1,254,350
54 SALT LAKE CITY DEPARTMENT OF AIRPORTS (An Enterprise fund of Salt Lake City Corporation) OPERATING REVENUES AND EXPENDITURES TO BUDGET (Unaudited) (Amounts in thousands) JUL - NOV 2017 JUL - NOV 2017 SURPLUS/ PERCENT ACTUALS BUDGET DEFICIT CHANGE Revenues Landing Fees $ 13,524 $ 13,455 $ % Fuel Farm % Aircraft Remain Overnight Fees % Cargo Bldg. & Ramp Use Fee (11) -1.7% Security Charges to TSA % Extraordinary Service Charges (10) -29.2% Passenger Boarding Bridges (33) -4.5% Tenant Telephone Fees (6) -4.7% Terminal Rents 14,524 14, % General Aviation Hangars % FBO Hangars/Fuel Oil Royalty % Flight Kitchens % Other Buildings & Office Space 2,257 2, % Food Service & Vending 4,673 4, % News/Gift Shop 2,692 2, % Car Rental 12,609 10,677 1, % Leased Site Areas 1, % Auto Parking/Ground Transportation 15,940 15, % Advertising (112) -22.3% State Aviation Fuel Tax 1,313 1, % Military % Glycol Recycling Sales % ARFF Training % Auxiliary Airport Fuel Sales % Other 1, % Less: Airline Revenue Sharing (5,381) (5,078) (303) 5.97% Total Operating Revenues 69,786 65,158 4, % Expenses Salary & Wages 14,698 14,635 (63) -0.4% Employee Benefits 6,976 7, % Maintenance Supplies 1,990 4,052 2, % Automotive Supplies 1,070 1, % Other Supplies % Insurance Premiums 1, (361) -37.0% Janitorial Service 2,998 3, % Maintenance Contracts % Other Contractual Services 2,752 3, % Professional & Tech Service 942 2,152 1, % Utilities 2,737 3, % Administrative Service Fee % Aircraft Rescue Fire Fighting 2,054 1,895 (159) -8.4% Other Expenses 513 1, % Operating Expenses Before Capitalized Salaries 40,003 45,737 5, % Capitalized Salaries % Total Operating Expenses 39,511 45,245 5, % Operating Income $ 30,275 $ 19,913 $ 10, %
55 SALT LAKE CITY DEPARTMENT OF AIRPORTS (An Enterprise fund of Salt Lake City Corporation) OPERATING REVENUES AND EXPENDITURES TO PRIOR YEAR (Unaudited) (Amounts in thousands) SURPLUS/ PERCENT JUL-NOV 2017 JUL-NOV 2016 (DEFICIT) CHANGE Revenues Landing Fees $ 13,524 $ 12,258 $ 1, % Fuel Farm % Aircraft Remain Overnight Fees (10) -6.6% Cargo Bldg. & Ramp Use Fee (11) -1.6% Security Charges to TSA % Extraordinary Service Charges (7) -21.3% Passenger Boarding Bridges % Tenant Telephone Fees (4) -2.9% Terminal Rents 14,524 13,291 1, % General Aviation Hangars (58) -10.2% FBO Hangars/Fuel Oil Royalty % Flight Kitchens % Other Buildings & Office Space 2,257 2,261 (4) -0.2% Food Service & Vending 4,673 4, % News/Gift Shops 2,692 2, % Car Rental 12,609 11,022 1, % Leased Site Areas 1, % Auto Parking/Ground Transportation 15,940 14, % Advertising (82) -17.5% State Aviation Fuel Tax 1,313 1, % Military % Glycol Recycling Sales (2) -0.9% ARFF Training % Auxiliary Airport Fuel Sales % Other 1, % Less: Airline Revenue Sharing (5,381) (4,928) (453) 0.0% Operating Revenues 69,786 63,472 6, % Expenses Salary & Wages $ 14,698 13, % Employee Benefits 6,976 6, % Maintenance Supplies 1,990 2,029 (39) -1.9% Automotive Supplies 1, % Other Supplies % Insurance Premiums 1,338 1, % Janitorial Service 2,998 2, % Maintenance Contracts (2) -0.2% Other Contractual Services 2,752 2, % Professional & Tech Service 942 1,016 (74) -7.3% Utilities 2,737 2,759 (22) -0.8% Administrative Service Fee (49) -8.2% Aircraft Rescue Fire Fighting 2,054 1, % Other Expenses (38) -7.0% Operating Expenses Before Capitalized Salaries 40,003 38,428 1, % Capitalized Salaries % Total Operating Expenses 39,511 37,972 1, % Operating Income $ 30,275 $ 25,500 $ 4, %

56 SALT LAKE CITY INTERNATIONAL AIRPORT AIR TRAFFIC STATISTICS AND ACTIVITY REPORT ELEVEN MONTHS ENDED NOVEMBER 2017 NOVEMBER YTD 12 MO ROLLING 2017 CHANGE 2017 CHANGE Ending 11/2017 CHANGE PASSENGERS DOMESTIC Enplaned - Local 566, % 6,935, % 7,511, % Enplaned - Connections 373, % 4,216, % 4,569, % Less International -25, , ,278 Enplaned 914, % 10,735, % 11,634, % Deplaned - Local 558, % 6,898, % 7,504, % Deplaned - Connection 373, % 4,216, % 4,569, % Less International -24, , ,004 Deplaned 906, % 10,676, % 11,605, % TOTAL DOMESTIC 1,820, % 21,412, % 23,239, % INTERNATIONAL Enplaned 25, % 416, % 447, % Deplaned 24, % 438, % 468, % TOTAL INTERNATIONAL 50, % 854, % 915, % TOTAL PASSENGERS 1,871, % 22,266, % 24,155, % LANDED WEIGHT Air Carriers 1,047,577, % 12,393,295, % 13,480,380, % Cargo Carriers 97,800, % 1,000,492, % 1,125,331, % TOTAL LANDED WEIGHT (LBS) 1,145,378, % 13,393,787, % 14,605,712, % MAIL Enplaned 2,004, % 22,202, % 23,503, % Deplaned 1,192, % 12,482, % 13,625, % TOTAL MAIL (LBS) 3,196, % 34,684, % 37,128, % CARGO Enplaned 15,386, % 161,377, % 178,126, % Deplaned 18,443, % 183,728, % 203,487, % TOTAL CARGO (LBS) 33,829, % 345,105, % 381,613, % MAIL & CARGO Enplaned 7, % 80, % 89, % Deplaned 9, % 91, % 101, % TOTAL MAIL & CARGO (TONS) 16, % 172, % 190, % AIRCRAFT OPERATIONS Passenger Aircraft 19, % 228, % 248, % All-Cargo Aircraft 1, % 18, % 20, % General Aviation 4, % 43, % 46, % Military % 6, % 6, % TOTAL AIRCRAFT OPERATIONS 25, % 295, % 322, %
57 NOVEMBER NOVEMBER % YTD YTD % 12 MO ROLLING % CHANGE CHANGE Ending 11/2017 CHANGE ENPLANED PASSENGERS AIR CANADA % 12,346 17, % 18, % ALASKA 23,012 21, % 257, , % 291, % Horizon Air / Alaska 3,418 1, % 55,141 32, % 36, % Skywest / Alaska 5,501 5, % 75,600 68, % 73, % AMERICAN 33,812 46, % 551, , % 626, % American Eagle/Republic % 6, % % Compass 7,173 1, % 57,869 34, % 38, % Envoy Air % 21,246 1, % 3, % American/Mesa Air % 2, % % SkyWest (American) 5,744 4, % 45,591 86, % 90, % DELTA 478, , % 5,338,638 5,850, % 6,313, % SkyWest (Delta Connection) 167, , % 1,994,920 1,865, % 2,050, % Compass (Delta Connection) 2,624 15, % 116,856 92, % 96, % FRONTIER 20,196 21, % 212, , % 233, % JETBLUE 21,167 26, % 235, , % 320, % KLM ROYAL DUTCH AIRLINES % 13,431 19, % 19, % SOUTHWEST 93,068 95, % 1,133,681 1,147, % 1,241, % UNITED 16,814 13, % 205, , % 294, % Express Jet % % % Mesa Airlines (United Express) 360 4, % 2,372 14, % 15, % Republic Airways (United) 1,880 1, % 12,908 35, % 38, % Shuttle America (United Express) % 9, % % SkyWest (United Express) 21,720 21, % 281, , % 269, % Trans States % 3, % % US AIRWAYS % % % Charters % 5,191 7, % 8, % TOTAL ENPLANED PASSENGERS 904, , % 10,652,846 11,151, % 12,081, % AeroMexico % % % AIR CANADA % 13,041 16, % 17, % ALASKA AIR 21,373 20, % 250, , % 285, % Horizon Air / Alaska 3,281 1, % 53,211 29, % 33, % Skywest / Alaska 5,484 5, % 76,712 71, % 77, % AMERICAN 34,445 45, % 547, , % 621, % American Eagle/Republic % 6, % % Compass 3,623 1, % 52,680 33, % 37, % Envoy Air (American) % 19,700 1, % 4, % American/Mesa Air % 3, % % SkyWest (American) 5,613 4, % 44,526 83, % 87, % DELTA 475, , % 5,328,316 5,834, % 6,313, % SkyWest (Delta Connection) 167, , % 1,996,998 1,855, % 2,041, % Compass (Delta Connection) 2,591 14, % 115,010 90, % 95, % FRONTIER 20,322 21, % 211, , % 238, % JETBLUE 21,345 26, % 234, , % 318, % KLM ROYAL DUTCH AIRLINES % 15,864 39, % 39, % SOUTHWEST 92,575 95, % 1,130,343 1,144, % 1,242, % UNITED 15,689 12, % 199, , % 282, % Express Jet % % % Mesa Airlines / United Express 333 3, % 2,386 15, % 16, % Republic Airways (United) 2,052 1, % 13,719 37, % 40, % Shuttle America (United Express) % 9, % % SkyWest (United Express) 21,769 21, % 277, , % 270, % Trans States % 3, % % US AIRWAYS % 0.0% % Charters % 6,992 7, % 8, % TOTAL DEPLANED PASSENGERS 895, , % 10,614,129 11,114, % 12,073, % TOTAL PASSENGERS* 1,800,066 1,871, % 21,266,975 22,266, % 24,155, % INTERNATIONAL - ENPLANED AIR CANADA % 12,346 17, % 18, % DELTA 18,235 18, % 237, , % 316, % SkyWest (Delta Connection) 5,578 4, % 70,508 77, % 83, % Compass 73 2, % 11,132 9, % 9, % KLM ROYAL DUTCH AIRLINES % 13,431 19, % 19, % Charters % % % TOTAL ENPLANED INTERNATIONAL 24,516 25, % 344, , % 447, % AeroMexico % % % AIR CANADA % 13,041 16, % 17, % DELTA 18,427 18, % 239, , % 319, % SkyWest (Delta Connection) 4,927 4, % 75,183 75, % 80, % Compass 95 1, % 10,148 9, % 9, % KLM ROYAL DUTCH AIRLINES % 15,864 39, % 39, % Charters % % % TOTAL DEPLANED INTERNATIONAL 24,305 24, % 354, , % 468, % TOTAL INTERNATIONAL PASSENGERS 48,821 50, % 699, , % 915, % *Includes International SALT LAKE CITY INTERNATIONAL AIRPORT PASSENGER TRAFFIC REPORT ELEVEN MONTHS ENDED NOVEMBER 2017
58 SALT LAKE CITY INTERNATIONAL AIRPORT ELEVEN MONTHS ENDED NOVEMBER 2017 Based on Total Enplanements MARKET SHARE NOVEMBER MARKET NOVEMBER MARKET YTD MARKET YTD MARKET 12 MO ROLLING 12 MO ROLLING MARKET 2016 SHARE 2017 SHARE 2016 SHARE 2017 SHARE Ending 11/2016 Ending 11/2017 SHARE AIR CANADA % % 12, % 17, % 12,346 18, % ALASKA 31, % 28, % 388, % 368, % 419, , % AMERICAN 46, % 53, % 685, % 701, % 718, , % DELTA 648, % 672, % 7,450, % 7,808, % 8,066,844 8,460, % FRONTIER 20, % 21, % 212, % 214, % 226, , % JETBLUE 21, % 26, % 235, % 298, % 252, , % KLM ROYAL DUTCH % % 13, % 19, % 13,431 19, % SOUTHWEST 93, % 95, % 1,133, % 1,147, % 1,227,275 1,241, % UNITED 41, % 41, % 516, % 568, % 561, , % US AIRWAYS % % % % 23, % Charters % % 5, % 7, % 5,598 8, % TOTAL ENPLANEMENTS 904, % 939, % 10,652, % 11,151, % 11,526,564 12,081, % PERCENT CHANGE YOY NOVEMBER NOVEMBER PERCENT YTD YTD PERCENT 12 MO ROLLING 12 MO ROLLING PERCENT CHANGE CHANGE Ending 11/2016 Ending 11/2017 CHANGE AIR CANADA % 12,346 17, % 12,346 18, % ALASKA 31,931 28, % 388, , % # 419, , % AMERICAN 46,972 53, % 685, , % # 718, , % DELTA 648, , % 7,450,414 7,808, % # 8,066,844 8,460, % FRONTIER 20,196 21, % 212, , % # 226, , % JETBLUE 21,167 26, % 235, , % # 252, , % KLM ROYAL DUTCH % 13,431 19, % 13,431 19, % SOUTHWEST 93,068 95, % 1,133,681 1,147, % # 1,227,275 1,241, % UNITED 41,436 41, % 516, , % # 561, , % US AIRWAYS % % # 23, % Charters % 5,191 7, % # 5,598 8, % TOTAL ENPLANEMENTS 904, , % 10,652,846 11,151, % # 11,526,564 12,081, %
59 SALT LAKE CITY INTERNATIONAL AIRPORT LANDING ACTIVITY ELEVEN MONTHS ENDED NOVEMBER 2017 NOVEMBER NOVEMBER YTD YTD 12 MO ROLLING % CHANGE CHANGE Ending 11/2017 CHANGE TOTAL NUMBER OF LANDINGS SCHEDULED CARRIERS AEROMEXICO % % % AIR CANADA % % % ALASKA % 2,177 2, % 2, % Horizon Air / Alaska % % % Skywest / Alaska % 1,297 1, % 1, % AMERICAN % 4,064 4, % 4, % Compass % % % American Eagle/Republic % % % American/Mesa Air % % % Envoy Air (American) % % % SkyWest (American) % 881 1, % 1, % DELTA 3,454 3, % 38,265 42, % 46, % SkyWest (Delta Connection) 3,192 2, % 38,125 35, % 38, % Compass (Delta Connection) % 1,798 1, % 1, % FRONTIER % 1,489 1, % 1, % JETBLUE % 1,665 2, % 2, % KLM ROYAL DUTCH AIRLINES % % % SOUTHWEST % 8,943 10, % 10, % UNITED % 1,575 1, % 2, % Express Jet % % % Mesa / United Express % % % Republic Airways Holdings % % % SkyWest (United Express) % 4,458 4, % 4, % Shuttle America (United Express) % % % Trans States % % % US AIRWAYS % % % SUBTOTAL SCHEDULED CARRIERS: 9,112 9, % 107, , % 119, % CHARTER CARRIERS ALLEGIANT AIR % % % BIGHORN AIRWAYS % % % BOMBARDIER BUSINESS JETS % % % BOUTIQUE AIR % 1,018 1, % 1, % D&D AVIATION % % % DELTA PRIVATE JETS % % % EXECUTIVE JET MANAGEMENT % % % FLIGHT OPTIONS % % % KEYLIME AIR % % % NETJETS % 1,090 1, % 1, % SIERRA PACIFIC % % % SUNSET AVIATION % % % SWIFT AIR % % % XOJET % % % OTHER CHARTER % 842 1, % 1, % SUBTOTAL CHARTER CARRIERS: % 3,821 4, % 4, % CARGO CARRIERS ABX AIR (DHL) % % % AERO CHARTER & TRANSPORT % % % AIR TRANSPORT INTERNATIONAL % % % AMERIFLIGHT % 3,572 2, % 3, % CORPORATE AIR (BILLINGS) % 1,162 1, % 1, % EMPIRE % % % FEDERAL EXPRESS % 1,545 1, % 1, % SOUTHERN AIR % % % UPS % 1,019 1, % 1, % WESTERN AIR EXPRESS % % % OTHER CARGO % 350 1, % 1, % SUBTOTAL CARGO CARRIERS: % 8,968 9, % 10, % TOTAL LANDINGS 10,131 10, % 120, , % 134, % TOTAL LANDED WEIGHT SCHEDULED CARRIERS AEROMEXICO % 94, % % AIR CANADA 1,649, % 16,975,000 22,310, % 23,862, % ALASKA 30,551,900 25,302, % 307,568, ,598, % 348,517, % Horizon Air / Alaska 3,766,750 1,852, % 56,624,750 33,502, % 37,331, % Skywest / Alaska 6,746,130 6,615, % 91,592,340 79,652, % 86,307, % AMERICAN 37,450,900 51,078, % 588,771, ,464, % 671,770, % Compass 4,422,050 2,248, % 58,760,800 41,522, % 46,019, % American Eagle/Republic % 7,420, % % Envoy Air (American) 309,220 74, % 24,344,340 1,341, % 4,601, % American/Mesa Air 73, % 3,895, % 73, % SkyWest (American) 6,379,000 5,896, % 50,387,000 96,836, % 100,923, %
60 SALT LAKE CITY INTERNATIONAL AIRPORT LANDING ACTIVITY ELEVEN MONTHS ENDED NOVEMBER 2017 NOVEMBER NOVEMBER YTD YTD 12 MO ROLLING % CHANGE CHANGE Ending 11/2017 CHANGE DELTA 529,219, ,958, % 5,952,064,820 6,374,714, % 6,909,289, % SkyWest (Delta Connection) 190,361, ,533, % 2,272,461,031 2,100,632, % 2,314,273, % Compass (Delta Connection) 2,917,573 16,839, % 134,600,778 99,367, % 104,317, % FRONTIER 19,216,320 19,781, % 206,025, ,199, % 211,690, % JETBLUE 22,041,000 31,568, % 236,761, ,509, % 348,674, % KLM ROYAL DUTCH AIRLINES % 27,669,000 39,576, % 39,576, % SOUTHWEST 104,256, ,527, % 1,161,830,000 1,318,822, % 1,423,740, % UNITED 20,028,000 16,123, % 227,298, ,880, % 317,524, % Express Jet 44, % 692,288 88, % 88, % Mesa / United Express 375,000 4,125, % 2,475,000 15,675, % 16,725, % Republic Airways Holdings 2,241,300 1,676, % 15,043,575 40,642, % 42,886, % SkyWest (United Express) 24,153,819 24,259, % 297,833, ,749, % 299,350, % Shuttle America (United Express) 506, % 10,629, % % Trans States 176,400 53, % 3,209, , % 723, % US AIRWAYS % % % SUBTOTAL SCHEDULED CARRIERS: 1,006,884,878 1,038,515, % 11,755,030,446 12,280,412, % 13,348,265, % CHARTER CARRIERS ALLEGIANT AIR 396, , % 2,142,000 1,395, % 1,593, % BIGHORN AIRWAYS % 27, % % BOUTIQUE AIR 1,165, , % 10,930,580 13,143, % 14,301, % D&D AVIATION % 840, % % DELTA PRIVATE JETS 323, , % 3,972,815 5,183, % 5,829, % EXECUTIVE JET MANAGEMENT 196, , % 4,137,885 5,480, % 6,251, % FLIGHT OPTIONS 82,395 33, % 2,578,290 2,085, % 2,317, % KEYLIME AIR 63, % 729, , % 285, % NETJETS 1,853,629 2,403, % 31,319,837 35,707, % 40,155, % SIERRA PACIFIC % 743, , % 855, % SUN COUNTRY 438, , % 1,462,700 2,047, % 2,193, % SWIFT AIR - 242, % 2,541,000 1,008, % 1,897, % XOJET 323, , % 5,274,450 5,655, % 6,597, % OTHER CHARTER 1,986,004 3,849, % 27,902,482 38,935, % 48,704, % SUBTOTAL CHARTER CARRIERS: 6,829,396 9,090, % 94,602, ,751, % 130,983, % CARGO CARRIERS ABX AIR (DHL) % 320, % % AERO CHARTER & TRANSPORT 143, , % 1,575,500 1,647, % 1,797, % AIR TRANSPORT INTERNATIONAL 55,500 36, % 73, , % 186, % ALPINE AVIATION 466,900 1,022, % 1,336,300 9,358, % 10,018, % AMERIFLIGHT 4,109,080 3,861, % 47,020,374 41,491, % 46,351, % CORPORATE AIR (BILLINGS) 875, , % 9,877,000 10,200, % 11,347, % EMPIRE 614, , % 6,733,405 6,797, % 7,532, % FEDEX EXPRESS 47,856,900 47,381, % 507,819, ,677, % 556,469, % SOUTHERN AIR INC 5,324,000 5,249, % 62,305,255 58,058, % 63,990, % UPS 33,408,220 36,681, % 314,271, ,527, % 407,822, % WESTERN AIR EXPRESS 542, , % 4,994,600 3,796, % 4,251, % OTHER CARGO 283,515 1,645, % 3,167,142 14,948, % 15,724, % SUBTOTAL CARGO CARRIERS: 93,681,000 97,773, % 959,493,356 1,000,651, % 1,125,490, % TOTAL LANDINGS 1,107,395,274 1,145,378, % 12,809,336,466 13,393,787, % 14,605,712, %
61 NOVEMBER NOVEMBER YTD YTD 12 MO ROLLING % CHANGE CHANGE Ending 11/2017 CHANGE ENPLANED CARGO PASSENGER CARRIERS ALASKA 8,691 19, % 127, , % 166, % Horizon Air / Alaska % 1, % % Skywest / Alaska 1, % 12,789 1, % 1, % AMERICAN 40,792 50, % 417, , % 247, % American Eagle/Republic % % % Compass % % % Envoy Air (American) % % % Mesa % % % SkyWest (American) % 2, % % DELTA 814,268 1,264, % 8,145,913 12,171, % 13,269, % KLM ROYAL DUTCH % 346, , % 400, % SOUTHWEST 327, , % 3,942,743 3,468, % 3,730, % UNITED 7,458 9, % 104,435 59, % 64, % US AIRWAYS % % % Others % 20, % % CARGO CARRIERS ABX AIR (DHL) 0.00% 16, % % FEDEX EXPRESS* 7,409,459 7,852, % 83,617,020 82,708, % 91,281, % GEM AIR 16,560 45, % 169, , % 429, % SOUTHERN AIR 350, , % 3,985,972 4,207, % 4,555, % UPS 4,120,555 4,404, % 40,033,052 42,844, % 48,278, % MISC CARGO 691, , % 8,113,972 14,737, % 15,688, % TOTAL ENPLANED CARGO 13,789,610 15,386, % 149,057, ,367, % 178,116, % DEPLANED CARGO PASSENGER CARRIERS ALASKA 18,952 27, % 230, , % 289, % Horizon Air / Alaska % 3,589 5, % 5, % Skywest / Alaska 454 1, % 20,174 6, % 7, % AMERICAN 43,315 33, % 366, , % 419, % American Eagle/Republic % 1, % % Compass % 694 6, % 6, % Envoy Air (American) % % % SkyWest (American) % 4,023 6, % 6, % DELTA 1,492,789 1,516, % 12,626,162 16,096, % 17,715, % KLM ROYAL DUTCH % 491, , % 894, % SOUTHWEST 341, , % 4,432,436 4,255, % 4,587, % UNITED 24,683 29, % 284, , % 332, % US AIRWAYS % % % Others % - 32, % 44, % CARGO CARRIERS ABX AIR (DHL) % 1, % % FEDEX EXPRESS* 8,155,361 8,926, % 84,942,293 91,113, % 100,807, % GEM AIR 12,039 21, % 149, , % 211, % SOUTHERN AIR 465, , % 5,087,028 4,836, % 5,474, % UPS 5,620,009 6,697, % 55,400,315 61,887, % 68,768, % MISC CARGO 382, , % 4,139,564 3,422, % 3,905, % TOTAL DEPLANED CARGO 16,557,518 18,443, % 168,182, ,717, % 203,477, % TOTAL CARGO 30,347,128 33,829, % 317,239, ,085, % 381,593, % *FEDEX EXPRESS includes mail SALT LAKE CITY INTERNATIONAL AIRPORT CARGO ACTIVITY REPORT ELEVEN MONTHS ENDED NOVEMBER 2017
62 COMPARISON OF ON TIME OPERATIONS OCTOBER 2017 ARRIVALS DEPARTURES Airport Flights % On % On Rank Airport Flights Time Time Rank SLC SALT LAKE CITY INTL 9, SLC SALT LAKE CITY INTL 9, IAD WASHINGTON DULLES 3, IAD WASHINGTON DULLES 3, BWI BALTIMORE/WASHINGTON INTL 8, MSP MINNEAPOLIS-ST. PAUL INTL 12, MSP MINNEAPOLIS-ST. PAUL INTL 12, CVG CINCINNATI NORTHERN INT. KY 1, DTW DETROIT METRO WAYNE CNTY 11, IAH HOUSTON GEORGE BUSH 10, ATL HARTSFIELD-JACKSON ATLANTA INTL 29, PHX PHOENIX SKY HARBOR INTL 12, DFW DALLAS-FT. WORTH REGIONAL 15, DTW DETROIT METRO WAYNE CNTY 11, IAH HOUSTON GEORGE BUSH 10, BWI BALTIMORE/WASHINGTON INTL 8, PHX PHOENIX SKY HARBOR INTL 12, DFW DALLAS-FT. WORTH REGIONAL 15, CLT CHARLOTTE DOUGLAS 9, DCA RONALD REAGAN NATIONAL 6, DEN DENVER INTL 19, CLT CHARLOTTE DOUGLAS 9, MDW CHICAGO MIDWAY 7, ATL HARTSFIELD-JACKSON ATLANTA INTL 29, STL ST. LOUIS LAMBERT INTL 4, STL ST. LOUIS LAMBERT INTL 4, SAN SAN DIEGO LINDBERGH FIELD 7, SEA SEATTLE-TACOMA INTL 11, TPA TAMPA INTL 5, PDX PORTLAND INTERNATIONAL 5, DCA RONALD REAGAN NATIONAL 6, PHL PHILADELPHIA INTL 6, LAS LAS VEGAS MCCARRAN INTL 13, SAN SAN DIEGO LINDBERGH FIELD 7, FLL FT. LAUDERDALE 6, TPA TAMPA INTERNATIONAL 5, ORD CHICAGO O HARE 23, DEN DENVER INTERNATIONAL 19, MCO ORLANDO INTL 10, ORD CHICAGO O HARE 23, MIA MIAMI INTL 5, MIA MIAMI INTL 5, PHL PHILADELPHIA INTL 6, FLL FT. LAUDERDALE 6, PDX PORTLAND INTL 5, MCO ORLANDO INTL 10, LAX LOS ANGELES INTL 18, BOS BOSTON LOGAN INTERNATIONAL 10, SEA SEATTLE-TACOMA INTL 11, LAX LOS ANGELES INTL 18, CVG CINCINNATI NORTHERN INT. KY 1, LAS LAS VEGAS MCCARRAN INTL 13, BOS BOSTON LOGAN INTL 10, MDW CHICAGO MIDWAY 7, LGA NEW YORK LAGUARDIA 8, JFK NEW YORK JFK INTL 7, JFK NEW YORK JFK INTL 7, EWR NEWARK LIBERTY INTERNATIONAL 9, EWR NEWARK LIBERTY INTERNATIONAL 9, LGA NEW YORK LAGUARDIA 8, SFO SAN FRANCISCO INTL 15, SFO SAN FRANCISCO INTL 15, AVERAGES 10, AVERAGES 10, ON TIME ARRIVAL PERFORMANCE AT SLC By Carrier Air Carrier Flights % On Time DL DELTA 3, % OO SKYWEST 3, % AA AMERICAN % B6 JETBLUE % AS ALASKA % F9 FRONTIER % WN SOUTHWEST % UA UNITED % 9, % Source: DOT Air Travel Consumer Report - Issued December 12, 2017
63 DESIGN AND CONSTRUCTION REPORT TABLE OF CONTENTS I. Area Map of Project Locations II. Project Schedule III. Construction Analysis IV. Design and Construction Report SALT LAKE CITY DEPARTMENT OF AIRPORTS January 8, 2018


64 !( 3!( 3!( Project Legend!( 6!(!( 7 6!( 6!( 4!( 7!( 7!( 3!( 3!( 3!( 3!( 2!( 3!( 5!( 5 Airfield 1. R/W and T/W P & R Pavement Rehabilitation 2. R/W Pavement Rehabilitation 3. Airfield Signage Replacement Landside 4. Airport Operations Center 5. Fiber Run 2200 W and 2200 N to North Vault 6. Electric Vehicle Charging Stations Terminal 7. Carpet Replacement - Concourse A, B, & TU3!( 3!( 2!( 3!( 3!( 3!( 1!( 1!( 3!( 1!( 1!( 5!( 5!( 5!( 5 Page 1 1/8/2018
The Conference Board Consumer Confidence Index decreased in July The Index now stands at 96.7 down from 97.4 in June.
 Interoffice Memo Date: August 31, 2016 To: Distribution From: Brian Baker Re: Air Traffic Statistics July 2016 Please review the attached report and return any comments or questions to Brian Baker. Reports
The Conference Board Consumer Confidence Index increased in August The Index now stands at up from 96.7 in July.
 Interoffice Memo Date: October 3, 2016 To: Distribution From: Brian Baker Re: Air Traffic Statistics August 2016 Please review the attached report and return any comments or questions to Brian Baker. Reports
SALT LAKE CITY DEPARTMENT OF AIRPORTS MINUTES OF ADVISORY BOARD MEETING
 SALT LAKE CITY DEPARTMENT OF AIRPORTS MINUTES OF ADVISORY BOARD MEETING Members Present: Mickey Gallivan - Chair Christine Botosan Senator Karen Mayne Larry Pinnock Conference Call: Excused: Mayor s Office:
SALT LAKE CITY DEPARTMENT OF AIRPORTS MINUTES OF ADVISORY BOARD MEETING
 SALT LAKE CITY DEPARTMENT OF AIRPORTS MINUTES OF ADVISORY BOARD MEETING 21 October - 2015 Members Present: Excused: Mayor s Office: Department of Airports: Mickey Gallivan Chair Igor Best-Devereux Christine
JANUARY 2018 BOARD INFORMATION PACKAGE
 JANUARY 2018 BOARD INFORMATION PACKAGE MEMORANDUM TO: Members of the Airport Authority FROM: Lew Bleiweis, Executive Director DATE: January 19, 2018 Financial Report (document) Informational Reports: A.
Columbus Regional Airport Authority. Financial Statements. March 31, Respectfully Submitted. Randy Bush, CPA, CIA. Chief Financial Officer
 Columbus Regional Airport Authority Financial Statements March 31, 2018 Respectfully Submitted Randy Bush, CPA, CIA Chief Financial Officer Unaudited for internal purposes CRAA Operating Revenue & Expenses
Columbus Regional Airport Authority. Financial Statements. August 31, Respectfully Submitted. Randy Bush, CPA, CIA. Chief Financial Officer
 Columbus Regional Airport Authority Financial Statements August 31, 2018 Respectfully Submitted Randy Bush, CPA, CIA Chief Financial Officer Unaudited for internal purposes CRAA Operating Revenue & Expenses
Columbus Regional Airport Authority. Financial Statements. September 30, Respectfully Submitted. Randy Bush, CPA, CIA. Chief Financial Officer
 Columbus Regional Airport Authority Financial Statements September 30, 2018 Respectfully Submitted Randy Bush, CPA, CIA Chief Financial Officer Unaudited for internal purposes CRAA Operating Revenue &
JANUARY 2017 BOARD INFORMATION PACKAGE
 JANUARY 2017 BOARD INFORMATION PACKAGE MEMORANDUM TO: Members of the Airport Authority FROM: Lew Bleiweis, Executive Director DATE: January 13, 2017 Financial Report (document) Informational Reports: A.
Columbus Regional Airport Authority. Financial Statements. July 31, Respectfully Submitted. Randy Bush, CPA, CIA. Chief Financial Officer
 Columbus Regional Airport Authority Financial Statements July 31, 2018 Respectfully Submitted Randy Bush, CPA, CIA Chief Financial Officer Unaudited for internal purposes CRAA Operating Revenue & Expenses
Columbus Regional Airport Authority. Financial Statements. April 30, Respectfully Submitted. Randy Bush, CPA, CIA. Chief Financial Officer
 Columbus Regional Airport Authority Financial Statements April 30, 2018 Respectfully Submitted Randy Bush, CPA, CIA Chief Financial Officer Unaudited for internal purposes CRAA Operating Revenue & Expenses
APRIL 2016 BOARD INFORMATION PACKAGE
 APRIL 2016 BOARD INFORMATION PACKAGE MEMORANDUM TO: Members of the Airport Authority FROM: Lew Bleiweis, Executive Director DATE: April 8, 2016 Financial Report (document) Informational Reports: A. February,
SEPTEMBER 2015 BOARD INFORMATION PACKAGE
 SEPTEMBER 2015 BOARD INFORMATION PACKAGE MEMORANDUM TO: Members of the Airport Authority FROM: Lew Bleiweis, Executive Director DATE: September 11, 2015 Financial Report (document) Informational Reports:
LOUIS ARMSTRONG NEW ORLEANS INTERNATIONAL AIRPORT For the Period Ending September 30, Enplaned Passengers by Airline
 Domestic Scheduled Enplaned Passengers by Airline Alaska Airlines 7,070 4,331 63.2% 59,552 42,265 40.9% 1.2% 1.0% Virgin America 0 803-100.0% 12,231 803 1423.2% 0.3% 0.0% Allegiant Air 1,333 2,063-35.4%
U.S. DOMESTIC INDUSTRY OVERVIEW FOR MARCH
 Inter-Office Memo Reno-Tahoe Airport Authority Date: April 30, 2009 To: Statistics Recipients From: Krys T. Bart, A.A.E., President/CEO Subject: RENO-TAHOE INTERNATIONAL AIRPORT PASSENGER STATISTICS U.S.
Jacksonville Aviation Authority Annual Report The Power Within.
 Jacksonville Aviation Authority Annual Report 2007 The Power Within. Board of Directors & Executive Team Cyrus Jollivette Chairman 1 John D. Clark Executive Director / CEO Jim McCollum Vice-Chairman 2
RENO-TAHOE INTERNATIONAL AIRPORT APRIL 2008 PASSENGER STATISTICS
 Inter-Office Memo Reno-Tahoe Airport Authority Date: June 5, 2008 To: Statistics Recipients From: Tom Medland, Director Air Service Business Development Subject: RENO-TAHOE INTERNATIONAL AIRPORT PASSENGER
COUNTY OF ORANGE, CALIFORNIA AIRPORT REVENUE BONDS, SERIES 2009 A & B ANNUAL REPORT FOR FISCAL YEAR ENDED JUNE 30, 2013
 COUNTY OF ORANGE, CALIFORNIA AIRPORT REVENUE BONDS, SERIES 2009 A & B ANNUAL REPORT FOR FISCAL YEAR ENDED JUNE 30, 2013 Dated: January 28, 2014 COUNTY OF ORANGE, CALIFORNIA AIRPORT REVENUE BONDS, SERIES
Salt Lake City International Airport April 23, 2013 Budget Briefing. Page 1
 Budget Briefing Fiscal Year 2014 Budget Honorable Members of the City Council April 23, 2013 Page 1 FY 2014 Budget Goals and Objectives Develop and implement a plan of execution for the terminal redevelopment
Passenger and Cargo Statistics Report
 Passenger and Cargo Statistics Report RenoTahoe International Airport November 2017 U.S. DOMESTIC INDUSTRY OVERVIEW FOR NOVEMBER 2017 Systemwide RNO Carriers Domestic Flights year over year comparison
Passenger and Cargo Statistics Report
 Passenger and Cargo Statistics Report RenoTahoe International Airport September 2015 U.S. DOMESTIC INDUSTRY OVERVIEW FOR SEPTEMBER 2015 All RNO Carriers Domestic Systemwide year over year comparison Average
October 2013 Passenger and Cargo Traffic Statistics Reno-Tahoe International Airport
 October 2013 Passenger and Cargo Traffic Statistics Reno-Tahoe International Airport December 4, 2013 U.S. DOMESTIC INDUSTRY OVERVIEW FOR OCTOBER 2013 All RNO Carriers Systemwide year over year comparison
Inter-Office Memo Reno-Tahoe Airport Authority
 Inter-Office Memo Reno-Tahoe Airport Authority Date: November 30, 2009 To: Statistics Recipients From: Krys T. Bart, A.A.E., President/CEO Subject: RENO-TAHOE INTERNATIONAL AIRPORT PASSENGER STATISTICS
PORTLAND INTERNATIONAL AIRPORT (PDX)
") Monthly Traffic Report This Month Calendar Year to Date 20 20 %Chg 20 20 %Chg Total PDX Flight Operations * 15,731 15,520 1.4% 33,326 32,280 3.2% Military 211 0.2% 478 381 25.5% General Aviation 942 926
Monthly Traffic Report This Month Calendar Year to Date 20 20 %Chg 20 20 %Chg Total PDX Flight Operations * 15,731 15,520 1.4% 33,326 32,280 3.2% Military 211 0.2% 478 381 25.5% General Aviation 942 926
SAN FRANCISCO INTERNATIONAL AIRPORT
 SAN FRANCISCO INTERNATIONAL AIRPORT COMPARATIVE TRAFFIC REPORT December 2004 Fiscal Year-To-Date Dec 2004 Dec 2003 % Change 2004 2003 % Change Flight Operations - Total * Air Carrier Air Taxi Civil Military
January 2014 Passenger and Cargo Traffic Statistics Reno-Tahoe International Airport
 January 2014 Passenger and Cargo Traffic Statistics Reno-Tahoe International Airport March 12, 2014 U.S. DOMESTIC INDUSTRY OVERVIEW FOR DECEMBER 2013 All RNO Carriers Domestic Systemwide year over year
MONTHLY AIRPORT TRAFFIC REPORT December 2018
 MONTHLY AIRPORT TRAFFIC REPORT AIRCRAFT OPERATIONS 2018 2017 Change Domestic Air Carrier 58,905 55,828 5.51% Air Taxi 6,948 6,810 2.03% General Aviation 499 565-11.68% Military 24 25-4.00% Subtotal 66,376
Passenger and Cargo Statistics Report
 Passenger and Cargo Statistics Report RenoTahoe International Airport August 2015 U.S. DOMESTIC INDUSTRY OVERVIEW FOR AUGUST 2015 All RNO Carriers Domestic Systemwide year over year comparison Average
May 2011 Passenger and Cargo Traffic Statistics Reno-Tahoe International Airport
 May 2011 Passenger and Cargo Traffic Statistics Reno-Tahoe International Airport July 5, 2011 U.S. DOMESTIC INDUSTRY OVERVIEW FOR MAY 2011 All RNO Carriers Systemwide year over year comparison Average
MONTHLY AIRPORT TRAFFIC REPORT September 2018
 MONTHLY AIRPORT TRAFFIC REPORT AIRCRAFT OPERATIONS 2018 2017 Change Domestic Air Carrier 58,763 55,902 5.12% Air Taxi 6,537 6,689-2.27% General Aviation 605 658-8.05% Military 14 17-17.65% Subtotal 65,919
PORTLAND INTERNATIONAL AIRPORT (PDX)
") Monthly Traffic Report This Month Calendar Year to Date 20 20 %Chg 20 20 %Chg Total PDX Flight Operations * 19,211,625 3.1% 233,993 228,949 2.2% Military 9 310-42.3% 3,520 4,144-15.1% General Aviation
Monthly Traffic Report This Month Calendar Year to Date 20 20 %Chg 20 20 %Chg Total PDX Flight Operations * 19,211,625 3.1% 233,993 228,949 2.2% Military 9 310-42.3% 3,520 4,144-15.1% General Aviation
MONTHLY AIRPORT TRAFFIC REPORT August 2018
 MONTHLY AIRPORT TRAFFIC REPORT AIRCRAFT OPERATIONS 2018 2017 Change Domestic Air Carrier 65,465 63,201 3.58% Air Taxi 7,607 7,533 0.98% General Aviation 594 609-2.46% Military 15 3 400.00% Subtotal 73,681
November 2013 Passenger and Cargo Traffic Statistics Reno-Tahoe International Airport
 November 2013 Passenger and Cargo Traffic Statistics Reno-Tahoe International Airport December 26, 2013 U.S. DOMESTIC INDUSTRY OVERVIEW FOR NOVEMBER 2013 All RNO Carriers Domestic Systemwide year over
AUGUST 2008 MONTHLY PASSENGER AND CARGO STATISTICS
 Inter-Office Memo Reno-Tahoe Airport Authority Date: October 2, 2008 To: Statistics Recipients From: Tom Medland, Director Air Service Business Development Subject: RENO-TAHOE INTERNATIONAL AIRPORT PASSENGER
December 2013 Passenger and Cargo Traffic Statistics Reno-Tahoe International Airport
 December 2013 Passenger and Cargo Traffic Statistics Reno-Tahoe International Airport January 24, 2014 U.S. DOMESTIC INDUSTRY OVERVIEW FOR DECEMBER 2013 All RNO Carriers Domestic Systemwide year over year
FY 2018 Rates, Fees, and Charges Year End Reconciliation. Finance Department P.O. Box DFW Airport, Texas
 FY Rates, Fees, and Charges Year End Reconciliation Finance Department P.O. Box 619428 DFW Airport, Texas 75261-9428 Business Units Executive Summary Summary of FY Year-End Reconciliation Landing Fee Terminal
PETER O. KNIGHT, PLANT CITY & TAMPA EXECUTIVE AIRPORTS HILLSBOROUGH COUNTY AVIATION AUTHORITY
 PETER O. KNIGHT, PLANT CITY & TAMPA EXECUTIVE AIRPORTS HILLSBOROUGH COUNTY AVIATION AUTHORITY FISCAL YEAR 2018 OCTOBER 17 - SEPTEMBER 18 UNAUDITED OPERATING RESULTS (IN THOUSANDS) Summary Actual Results
Passenger and Cargo Statistics Report
 Passenger and Cargo Statistics Report RenoTahoe International Airport July 2017 U.S. DOMESTIC INDUSTRY OVERVIEW FOR JULY 2017 Systemwide RNO Carriers Domestic Flights year over year comparison Average
SAN FRANCISCO INTERNATIONAL AIRPORT
 SAN FRANCISCO INTERNATIONAL AIRPORT COMPARATIVE TRAFFIC REPORT March 2005 Fiscal Year-To-Date Mar 2005 Mar 2004 % Change 2005 2004 % Change Flight Operations - Total * Air Carrier Air Taxi Civil Military
Table of Contents PAGE
 DECEMBER 2018 EL PASO INTERNATIONAL AIRPORT MONTHLY ACTIVITY REPORT December 2018 Table of Contents PAGE AIRPORT ACTIVITY OVERVIEW 1 NONSTOP DESTINATION ANALYSIS 2 MAP OF NONSTOP DESTINATIONS 3 FLIGHT
Table of Contents PAGE
 OCTOBER 2018 EL PASO INTERNATIONAL AIRPORT MONTHLY ACTIVITY REPORT October 2018 Table of Contents PAGE AIRPORT ACTIVITY OVERVIEW 1 NONSTOP DESTINATION ANALYSIS 2 MAP OF NONSTOP DESTINATIONS 3 FLIGHT SCHEDULE
Table of Contents PAGE
 NOVEMBER 2018 EL PASO INTERNATIONAL AIRPORT MONTHLY ACTIVITY REPORT November 2018 Table of Contents PAGE AIRPORT ACTIVITY OVERVIEW 1 NONSTOP DESTINATION ANALYSIS 2 MAP OF NONSTOP DESTINATIONS 3 FLIGHT
Passenger and Cargo Statistics Report
 Passenger and Cargo Statistics Report RenoTahoe International Airport December 2015 U.S. DOMESTIC INDUSTRY OVERVIEW FOR DECEMBER 2015 All RNO Carriers Domestic Systemwide year over year comparison Average
Passenger and Cargo Statistics Report
 Passenger and Cargo Statistics Report RenoTahoe International Airport September 2017 U.S. DOMESTIC INDUSTRY OVERVIEW FOR SEPTEMBER 2017 Systemwide RNO Carriers Domestic Flights year over year comparison
September 2013 Passenger and Cargo Traffic Statistics Reno-Tahoe International Airport
 September 2013 Passenger and Cargo Traffic Statistics Reno-Tahoe International Airport October 31, 2013 U.S. DOMESTIC INDUSTRY OVERVIEW FOR SEPTEMBER 2013 All RNO Carriers Systemwide year over year comparison
PORTLAND INTERNATIONAL AIRPORT (PDX)
") Monthly Traffic Report uary, 20 This Month Calendar Year to Date 20 20 %Chg 20 20 %Chg Total PDX Flight Operations * 17,502 17,957-2.5% 17,502 17,957-2.5% Military 373 298 25.2% 373 298 25.2% General Aviation
Monthly Traffic Report uary, 20 This Month Calendar Year to Date 20 20 %Chg 20 20 %Chg Total PDX Flight Operations * 17,502 17,957-2.5% 17,502 17,957-2.5% Military 373 298 25.2% 373 298 25.2% General Aviation
PORTLAND INTERNATIONAL AIRPORT (PDX)
") Monthly Traffic Report ember, 20: Calendar Year Report This Month Calendar Year to Date 20 20 %Chg 20 20 %Chg Total PDX Flight Operations * 18,625 18,586 0.2% 228,949 227,709 0.5% Military 310 254 22.0%
Monthly Traffic Report ember, 20: Calendar Year Report This Month Calendar Year to Date 20 20 %Chg 20 20 %Chg Total PDX Flight Operations * 18,625 18,586 0.2% 228,949 227,709 0.5% Military 310 254 22.0%
MONTHLY AIRPORT TRAFFIC REPORT February 2018
 MONTHLY AIRPORT TRAFFIC REPORT AIRCRAFT OPERATIONS 2018 2017 Change Domestic Air Carrier 51,809 51,854-0.09% Air Taxi 6,659 6,988-4.71% General Aviation 651 540 20.56% Military 6 9-33.33% Subtotal 59,125
SLC Airport Project Adds New Scope; Teams Scramble to Stay on Schedule
 SLC Airport Project Adds New Scope; Teams Scramble to Stay on Schedule Two sky bridges will connect the parking garage to the second level of the terminal, while an elevated roadway for depa will access
PORTLAND INTERNATIONAL AIRPORT (PDX)
") Monthly Traffic Report e, 20: Fiscal Year Report This Month Fiscal Year to Date 20 20 %Chg 20 20 %Chg Total PDX Flight Operations * 21,213 20,651 2.7% 228,846 222,979 2.6% Military 334 374-10.7% 3,829
Monthly Traffic Report e, 20: Fiscal Year Report This Month Fiscal Year to Date 20 20 %Chg 20 20 %Chg Total PDX Flight Operations * 21,213 20,651 2.7% 228,846 222,979 2.6% Military 334 374-10.7% 3,829
August 2014 Passenger and Cargo Traffic Statistics Reno-Tahoe International Airport
 August 2014 Passenger and Cargo Traffic Statistics Reno-Tahoe International Airport October 8, 2014 U.S. DOMESTIC INDUSTRY OVERVIEW FOR AUGUST 2014 All RNO Carriers Domestic Systemwide year over year comparison
MONTHLY AIRPORT TRAFFIC REPORT July 2018-(Revised)
") MONTHLY AIRPORT TRAFFIC REPORT AIRCRAFT OPERATIONS 2018 2017 Change Domestic Air Carrier 64,066 63,535 0.84% Air Taxi 7,468 7,291 2.43% General Aviation 550 630-12.70% Military 5 15-66.67% Subtotal 72,089
MONTHLY AIRPORT TRAFFIC REPORT AIRCRAFT OPERATIONS 2018 2017 Change Domestic Air Carrier 64,066 63,535 0.84% Air Taxi 7,468 7,291 2.43% General Aviation 550 630-12.70% Military 5 15-66.67% Subtotal 72,089
MONTHLY AIRPORT TRAFFIC REPORT February 2014
 MONTHLY AIRPORT TRAFFIC REPORT AIRCRAFT OPERATIONS 2014 2013 Change Domestic Air Carrier 44,741 48,627-7.99% Air Taxi 11,144 13,003-14.30% General Aviation 569 543 4.79% Military 17 15 13.33% Subtotal
LOUIS ARMSTRONG NEW ORLEANS INTERNATIONAL AIRPORT For the Period Ending August 31, Enplaned Passengers by Airline
 Enplaned Passengers by Airline Domestic Scheduled Alaska Airlines 3,797 4,077-6.9% 36,538 35,188 3.8% 1.0% 1.0% Allegiant Air 5,698 743 666.9% 41,738 14,843 181.2% 1.1% 0.4% American Airlines (US Air)
March 2014 Passenger and Cargo Traffic Statistics Reno-Tahoe International Airport
 March 2014 Passenger and Cargo Traffic Statistics Reno-Tahoe International Airport April 25, 2014 U.S. DOMESTIC INDUSTRY OVERVIEW FOR MARCH 2014 All RNO Carriers Domestic Systemwide year over year comparison
SAN FRANCISCO INTERNATIONAL AIRPORT
 SAN FRANCISCO INTERNATIONAL AIRPORT COMPARATIVE TRAFFIC REPORT February 2005 Fiscal Year-To-Date Feb 2005 Feb 2004 % Change 2005 2004 % Change Flight Operations - Total * Air Carrier Air Taxi Civil Military
CONTACT: Investor Relations Corporate Communications
 NEWS RELEASE CONTACT: Investor Relations Corporate Communications 435.634.3200 435.634.3553 Investor.relations@skywest.com corporate.communications@skywest.com SkyWest, Inc. Announces Second Quarter 2016
PORTLAND INTERNATIONAL AIRPORT (PDX)
") Monthly Traffic Report This Month Calendar Year to Date 2006 2005 %Chg 2006 2005 %Chg Total PDX Flight Operations * 21,304 22,342-4.6% 61,057 63,232-3.4% Military 564 564 0.0% 1,503 1,443 4.2% General
Monthly Traffic Report This Month Calendar Year to Date 2006 2005 %Chg 2006 2005 %Chg Total PDX Flight Operations * 21,304 22,342-4.6% 61,057 63,232-3.4% Military 564 564 0.0% 1,503 1,443 4.2% General
MONTHLY AIRPORT TRAFFIC REPORT April 2018
 MONTHLY AIRPORT TRAFFIC REPORT AIRCRAFT OPERATIONS 2018 2017 Change Domestic Air Carrier 60,928 56,570 7.70% Air Taxi 6,995 7,771-9.99% General Aviation 654 833-21.49% Military 9 23-60.87% Subtotal 68,586
U.S. DOMESTIC INDUSTRY OVERVIEW FOR OCTOBER 2010 All RNO Carriers Systemwide year over year comparison
 Inter-Office Memo Reno-Tahoe Airport Authority Date: November 22, 2010 To: Chairman and Board of Trustees From: Krys T. Bart, A.A.E., President/CEO Subject: RENO-TAHOE INTERNATIONAL AIRPORT OCTOBER 2010
MONTHLY AIRPORT TRAFFIC REPORT November 2013
 MONTHLY AIRPORT TRAFFIC REPORT AIRCRAFT OPERATIONS 2013 2012 Change Domestic Air Carrier 52,937 54,739-3.29% Air Taxi 13,964 13,566 2.93% General Aviation 504 515-2.14% Military 25 28-10.71% Subtotal 67,430
PORTLAND INTERNATIONAL AIRPORT (PDX)
") Monthly Traffic Report This Month Calendar Year to Date 2007 2006 %Chg 2007 2006 %Chg Total PDX Flight Operations * 21,618 21,633-0.1% 264,518 260,510 1.5% Military 97 328-70.4% 3,707 5,023-26.2% General
Monthly Traffic Report This Month Calendar Year to Date 2007 2006 %Chg 2007 2006 %Chg Total PDX Flight Operations * 21,618 21,633-0.1% 264,518 260,510 1.5% Military 97 328-70.4% 3,707 5,023-26.2% General
PORTLAND INTERNATIONAL AIRPORT (PDX)
") Monthly Traffic Report ember, 20: Calendar Year Report This Month Calendar Year to Date 20 20 %Chg 20 20 %Chg Total PDX Flight Operations * 18,0 21,618-16.7% 252,572 264,518-4.5% Military 238 97 145.4%
Monthly Traffic Report ember, 20: Calendar Year Report This Month Calendar Year to Date 20 20 %Chg 20 20 %Chg Total PDX Flight Operations * 18,0 21,618-16.7% 252,572 264,518-4.5% Military 238 97 145.4%
Passenger and Cargo Statistics Report
 Passenger and Cargo Statistics Report RenoTahoe International Airport September 2018 U.S. DOMESTIC INDUSTRY OVERVIEW FOR SEPTEMBER 2018 Systemwide RNO Carriers Domestic Flights year over year comparison
PORTLAND INTERNATIONAL AIRPORT (PDX)
") Monthly Traffic Report This Month Calendar Year to Date 2005 2004 %Chg 2005 2004 %Chg Total PDX Flight Operations * 20,800 18,649 11.5% 20,800 18,649 11.5% Military 524 530-1.1% 524 530-1.1% General Aviation
Monthly Traffic Report This Month Calendar Year to Date 2005 2004 %Chg 2005 2004 %Chg Total PDX Flight Operations * 20,800 18,649 11.5% 20,800 18,649 11.5% Military 524 530-1.1% 524 530-1.1% General Aviation
MONTHLY AIRPORT TRAFFIC REPORT January 2018
 MONTHLY AIRPORT TRAFFIC REPORT AIRCRAFT OPERATIONS 2018 2017 Change Domestic Air Carrier 55,461 55,980-0.93% Air Taxi 7,166 7,330-2.24% General Aviation 690 625 10.40% Military 6 11-45.45% Subtotal 63,323
VIRGIN ISLANDS PORT AUTHORITY (VIPA) 2016 PUBLIC HEARING ON PROPOSED TARIFF INCREASE. ! July
 2016 PUBLIC HEARING ON PROPOSED TARIFF INCREASE. ! July") VIRGIN ISLANDS PORT! July AUTHORITY (VIPA) 2016 2016 PUBLIC HEARING ON PROPOSED TARIFF INCREASE FINANCIAL OPERATIONS VIPA AVIATION DIVISION VIRGIN ISLANDS PORT AUTHORITY 2 5-YEAR INCOME STATEMENT SNAPSHOT-
VIRGIN ISLANDS PORT! July AUTHORITY (VIPA) 2016 2016 PUBLIC HEARING ON PROPOSED TARIFF INCREASE FINANCIAL OPERATIONS VIPA AVIATION DIVISION VIRGIN ISLANDS PORT AUTHORITY 2 5-YEAR INCOME STATEMENT SNAPSHOT-
MONTHLY AIRPORT TRAFFIC REPORT. April 2014
 MONTHLY AIRPORT TRAFFIC REPORT AIRCRAFT OPERATIONS 2014 2013 Change Domestic Air Carrier 55,529 55,119 0.74% Air Taxi 11,149 15,077-26.05% General Aviation 639 723-11.62% Military 13 14-7.14% Subtotal
Passenger and Cargo Statistics Report
 Passenger and Cargo Statistics Report RenoTahoe International Airport June 2017 U.S. DOMESTIC INDUSTRY OVERVIEW FOR JUNE 2017 All RNO Carriers Domestic Systemwide year over year comparison Average Load
CONTACT: Investor Relations Corporate Communications
 NEWS RELEASE CONTACT: Investor Relations Corporate Communications 435.634.3200 435.634.3553 Investor.relations@skywest.com corporate.communications@skywest.com SkyWest, Inc. Announces Second Quarter 2017
Passenger and Cargo Statistics Report
 Passenger and Cargo Statistics Report RenoTahoe International Airport September 2016 U.S. DOMESTIC INDUSTRY OVERVIEW FOR SEPTEMBER 2016 All RNO Carriers Domestic Systemwide year over year comparison Average
MONTHLY AIRPORT TRAFFIC REPORT September 2016
 MONTHLY AIRPORT TRAFFIC REPORT AIRCRAFT OPERATIONS 2016 2015 Change Domestic Air Carrier 59,030 59,038-0.01% Air Taxi 7,779 7,201 8.03% General Aviation 704 571 23.29% Military 21 12 75.00% Subtotal 67,534
MONTHLY AIRPORT TRAFFIC REPORT May 2015
 MONTHLY AIRPORT TRAFFIC REPORT AIRCRAFT OPERATIONS 2015 2014 Change Domestic Air Carrier 60,427 57,339 5.39% Air Taxi 7,825 10,967-28.65% General Aviation 547 635-13.86% Military 135 27 400.00% Subtotal
Reno-Tahoe Airport Authority U.S. DOMESTIC INDUSTRY OVERVIEW FOR FEBRUARY
 Inter-Office Memo Reno-Tahoe Airport Authority Date: March 30, 2009 To: Statistics Recipients From: Krys T. Bart, A.A.E., President/CEO Subject: RENO-TAHOE INTERNATIONAL AIRPORT PASSENGER STATISTICS U.S.
Table of Contents PAGE
 FEBRUARY 2018 EL PASO INTERNATIONAL AIRPORT MONTHLY ACTIVITY REPORT February 2018 Table of Contents PAGE AIRPORT ACTIVITY OVERVIEW 1 NONSTOP DESTINATION ANALYSIS 2 MAP OF NONSTOP DESTINATIONS 3 FLIGHT
TABLE OF CONTENTS 2016 ANNUAL REPORT AIRLINES SERVING SAVANNAH IN 2016 A WORD FROM INITIATIVES NOW BOARDING CAMPAIGN PASSENGER AIRPORT
 ANNUAL 2016 REPORT TABLE OF CONTENTS 2016 ANNUAL REPORT 03 A WORD FROM 14 05 INTRODUCTION 17 06 PASSENGER 19 08 AIRPORT 20 09 AIR SERVICE 22 AIRLINES SERVING SAVANNAH IN 2016 GREEN INITIATIVES NOW BOARDING
December 2012 Passenger and Cargo Traffic Statistics Reno-Tahoe International Airport
 December 2012 Passenger and Cargo Traffic Statistics Reno-Tahoe International Airport January 29, 2013 U.S. DOMESTIC INDUSTRY OVERVIEW FOR DECEMBER 2012 All RNO Carriers Systemwide year over year comparison
Current and Forecast Demand
 Existing Facilities Jacksonville International Airport (JIA) is served by a number of airside and landside facilities. There are two runways that serve the airport in an open V configuration. The Annual
Passenger and Cargo Statistics Report
 Passenger and Cargo Statistics Report Reno-Tahoe International Airport October 2018 U.S. DOMESTIC INDUSTRY OVERVIEW FOR OCTOBER 2018 Systemwide RNO Carriers Domestic Flights year over year comparison Average
Passenger and Cargo Statistics Report
 Passenger and Cargo Statistics Report RenoTahoe International Airport January 2018 U.S. DOMESTIC INDUSTRY OVERVIEW FOR JANUARY 2018 Systemwide RNO Carriers Domestic Flights year over year comparison Average
Sacramento International Airport Airline Passenger Statistics August 2013
 Sacramento International Airport Airline Passenger Statistics August 2013 CURRENT MONTH FISCAL YEAR TO DATE CALENDAR YEAR TO DATE THIS YEAR LAST YEAR % + / ( - ) 2013/14 2012/13 % + / ( - ) 2013 2012 %
Monthly Airport Passenger Activity Summary
 T F Green Airport Monthly Airport Passenger Activity Summary January 2018 Calendar Year Basis Year Year Jan Jan Percent to Date to Date Percent 2018 2017 Change 2018 2017 Change Total Enplaned 148,452
Passenger and Cargo Statistics Report
 Passenger and Cargo Statistics Report RenoTahoe International Airport February 2018 U.S. DOMESTIC INDUSTRY OVERVIEW FOR FEBRUARY 2018 Systemwide RNO Carriers Domestic Flights year over year comparison
Calendar Year Basis Year Year Apr Apr Percent to Date to Date Percent Change Change
 T F Green Airport Monthly Airport Passenger Activity Summary April 2018 Calendar Year Basis Year Year Apr Apr Percent to Date to Date Percent 2018 2017 Change 2018 2017 Change Total Enplaned 194,510 157,788
Statistical Report Calendar Year 2013
 Statistical Report Year 213 Houston Airports P.O. Box 616 Houston, TX 7725-16 Request for User Input The intent of the monthly and annual statistical reports is to provide data that is both relevant and
Passenger and Cargo Statistics Report
 Passenger and Cargo Statistics Report RenoTahoe International Airport June 2018 U.S. DOMESTIC INDUSTRY OVERVIEW FOR JUNE 2018 Systemwide RNO Carriers Domestic Flights year over year comparison Average
Passenger and Cargo Statistics Report
 Passenger and Cargo Statistics Report RenoTahoe International Airport July 2018 U.S. DOMESTIC INDUSTRY OVERVIEW FOR JULY 2018 Systemwide RNO Carriers Domestic Flights year over year comparison Average
Passenger and Cargo Statistics Report
 Passenger and Cargo Statistics Report RenoTahoe International Airport April 2018 U.S. DOMESTIC INDUSTRY OVERVIEW FOR APRIL 2018 Systemwide RNO Carriers Domestic Flights year over year comparison Average
Passenger and Cargo Statistics Report
 Passenger and Cargo Statistics Report RenoTahoe International Airport May 2018 U.S. DOMESTIC INDUSTRY OVERVIEW FOR MAY 2018 Systemwide RNO Carriers Domestic Flights year over year comparison Average Load
RAPID CITY REGIONAL AIRPORT
 RAPID CITY REGIONAL AIRPORT Budget: $16,232,274 Full time Employees: 24 Mission Statement It is the mission of the Rapid City Regional Airport Board to provide safe, efficient, environmentally sensitive,
Passenger and Cargo Statistics Report
 Passenger and Cargo Statistics Report RenoTahoe International Airport January 2017 U.S. DOMESTIC INDUSTRY OVERVIEW FOR JANUARY 2017 All RNO Carriers Domestic Systemwide year over year comparison Average
Airline Market Shares of Enplaned Passengers. Scheduled Average Daily Aircraft Departures by Airline. Average Domestic One-Way Airline Fares
 December 31, 2009 Mr. Mark Brewer Airport Director Manchester-Boston Regional Airport One Airport Road, Suite 300 Manchester, New Hampshire 03103 Re: Continuing Disclosure Certificate Dear Mr. Brewer:
PORTLAND INTERNATIONAL AIRPORT (PDX) Monthly Traffic Report November, 2006
 Monthly Traffic Report November, 2006") Monthly Traffic Report This Month Calendar Year to Date 2006 2005 %Chg 2006 2005 %Chg Total PDX Flight Operations * 20,714 21,257-2.6% 238,877 241,667-1.2% Military 355 476-25.4% 4,695 6,127-23.4% General
Monthly Traffic Report This Month Calendar Year to Date 2006 2005 %Chg 2006 2005 %Chg Total PDX Flight Operations * 20,714 21,257-2.6% 238,877 241,667-1.2% Military 355 476-25.4% 4,695 6,127-23.4% General
Calendar Year Basis Year Year August August Percent to Date to Date Percent Change Change
 T F Green Airport Monthly Airport Passenger Activity Summary August 2018 Calendar Year Basis Year Year August August Percent to Date to Date Percent 2018 2017 Change 2018 2017 Change Total Enplaned 202,148
2017 Appropriation Budget Table of Contents Board Approved August 19, 2016
 INDIANAPOLIS AIRPORT AUTHORITY 2017 APPROPRIATION BUDGET ORDINANCE NO. 2-2016 BOARD APPROVED AUGUST 19, 2016 2017 Appropriation Budget Table of Contents Board Approved August 19, 2016 1 Appropriation Summary
PORTLAND INTERNATIONAL AIRPORT (PDX)
") Monthly Traffic Report il, 20 This Month Calendar Year to Date 20 20 %Chg 20 20 %Chg Total PDX Flight Operations * 21,262 20,818 2.1% 84,051 81,875 2.7% Military 354 419-15.5% 1,481 1,922-22.9% General
Monthly Traffic Report il, 20 This Month Calendar Year to Date 20 20 %Chg 20 20 %Chg Total PDX Flight Operations * 21,262 20,818 2.1% 84,051 81,875 2.7% Military 354 419-15.5% 1,481 1,922-22.9% General
DENVER INTERNATIONAL AIRPORT
 DENVER INTERNATIONAL AIRPORT TOTAL OPERATIONS AND TRAFFIC December YEAR TO DATE % of % of % Grand % Grand cr./ cr./ Total cr./ cr./ Total 2011 2010 Decr. Decr. 2011 2011 (9) 2010 (10) Decr. Decr. 2011
DENVER INTERNATIONAL AIRPORT. TOTAL OPERATIONS AND TRAFFIC December 2014
 DENVER INTERNATIONAL AIRPORT TOTAL OPERATIONS AND TRAFFIC December 2014 December YEAR TO DATE % of % of % Grand % Grand cr./ cr./ cr./ cr./ 2014 2013 Decr. Decr. 2014 2014 2013 Decr. Decr. 2014 OPERATIONS
Q3 Fiscal 2018 Statistics
 Q3 Fiscal 2018 Statistics FedEx Corporation Financial and Operating Statistics Third Quarter Fiscal 2018 March 20, 2018 This report is a statistical supplement to FedEx s interim financial reports and
Financial Feasibility Analysis Terminal Programming Study Des Moines Airport Authority
 Financial Feasibility Analysis Terminal Programming Study Des Moines Airport Authority September 12, 2017 Contents 1. Funding Sources for Airport Projects 2. Financial Metrics 3. CIP Summary and Funding