District of Columbia Institutional Investor Conference
|
|
|
- Adam Underwood
- 5 years ago
- Views:
Transcription


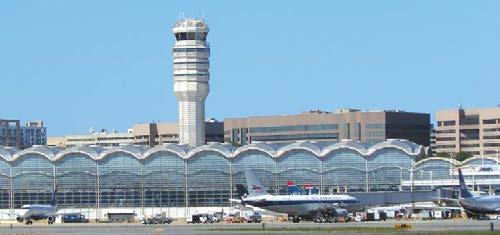


1 District of Columbia Institutional Investor Conference January 18 & 19, 2018 Andrew Rountree Senior Vice President for Finance & Chief Financial Officer
2 Disclaimer: The information contained in this presentation has been included for general informational purposes only, and no person should make any investment decision in reliance upon the information contained herein. Under no circumstances shall the information in this presentation constitute an offer to sell or the solicitation of an offer to buy securities. No statement found in this presentation constitutes a part of any preliminary or final official statement unless it is actually set forth in such preliminary or final official statement or expressly incorporated by reference therein. The information and expressions of opinion herein are subject to change without notice, and there is no implication that there has been no change in the information and expressions of opinion herein or in the affairs of the Metropolitan Washington Airports Authority since the date this presentation was first made available. Any statements involving matters of opinion or estimates, whether or not expressly so stated, are intended as such and not as representations of fact. No representation is made that any of such statements of opinions or estimates will become true or be realized.
3 Discussion Agenda I. Introduction to MWAA and Service Region II. Aviation Enterprise Ronald Reagan National Airport Washington Dulles International Airport III. Dulles Corridor Enterprise Dulles Toll Road (DTR) Dulles Corridor Metrorail Project IV. Closing Remarks


 Governor of Virginia (7 members) Mayor of Washington D.C.")
4 Airports Authority s History and Governance Ronald Reagan Washington National Airport Washington Dulles International Airport Dulles Toll Road Dulles Corridor Metrorail 1986 MWAA Created 1987 Operates DCA & IAD 2007/2008 Control of DTR Metrorail Phase 1 & 2 The Airports Authority is created with consent of U.S. Congress by Acts of D.C and the Virginia General Assembly MWAA assumed operating responsibility for DCA and IAD under a 50-year lease; subsequently extended through 2067 In 2007, Funding Partners agree to fund capital costs of a 23 mile extension of the WMATA Metrorail system VDOT transferred operational and financial control of the Dulles Toll Road to MWAA for a term through 2058 Metrorail Phase 1 opened for passenger service in July 2014 Metrorail Phase 2 construction is in progress and scheduled to be completed in late 2019 with passenger service expected in Member Board of Directors Appointed by: President of the U.S. (3 members) Governor of Virginia (7 members) Mayor of Washington D.C. (4 members) Governor of Maryland (3 members) Approximately 1,550 staff managed by a Boardappointed CEO

5 Washington D.C. Metropolitan Area VA MD Baltimore-Washington International Dulles International Dulles Toll Road DC Reagan National
 DESTINATION: $7.3 Billion Visitor Spending (8 th most visited region among international travelers) The population of the Airports Authority Service Region has grown to over 6.1 million, a 14.")
6 Airports Authority Serves a Large and Economically Robust Region SIZE: 6.1 Million Residents (6 th largest market in the U.S.) AFFLUENCE: $65,700 Per Capita Income (9 th highest in the U.S.) ECONOMY: $491 Billion Regional GDP (5 th highest among MSAs in the U.S.) DESTINATION: $7.3 Billion Visitor Spending (8 th most visited region among international travelers) The population of the Airports Authority Service Region has grown to over 6.1 million, a 14.1% increase since 2007, which was the 5 th highest population growth in the nation for the period Highly educated work force drives strong per capita income levels 34.9% higher than national average While the Airports Authority Service Region population accounts for 1.9% of total U.S. population, it generates 2.7% of total U.S. GDP Washington, D.C. attracted 20. million domestic and 2.0 million international visitors in 2016 Source: U.S. Department of Commerce, Bureau of Economic Analysis; Destination DC; Report of the Airport Consultant (2017)

7 Long-term Growth for the Airports is Supported by Population Forecasts Population Growth (Annual % Change) Projected Population Growth within Service Region % 1.6% 1.2% 0.8% 0.4% 37.7% 19.1% 42.7% 0.0% United States Airports Service Region 43.9% IAD DCA The Service Region s population growth averaged 1.4% annually between 2007 and 2016, consistently exceeding the national average of 0.8% The Region s inner suburbs (Fairfax, Montgomery and Prince George s Counties) are forecast to have the greatest total population by % The Region s outer suburbs (Charles, Frederick, Loudoun, Stafford, and Prince William Counties) and surrounding jurisdictions are forecast to experience the fastest rates of growth through 2045 Source: Report of the Airport Consultant (2017) Central Jurisdictions Inner Suburbs Outer Suburbs Outer Ring - VA* Other Jurisdictions Not Modeled Source: 2045 Growth - Metropolitan Washington Council of Governments * Fredericksburg-Area Jurisdictions

")


8 Aviation Enterprise Ronald Reagan Washington National Airport (DCA) Washington Dulles International Airport (IAD) 11,830 acres 4 Active Runways 124 Passenger Gates 860 acres 3 Active Runways 44 Passenger Gates Note: Comparative aerial photographs are not to scale
 TOTAL MARKETS JAN 2018 SERVICE 96 Destinations 10 Carriers 407 Daily Departures Beyond Perimeter Destinations Denver")
 Chicago Omaha (MDW-ORD) Akron/Canton Pittsburgh Columbus Philadelphia Indianapolis Dayton Washington-DCA Kansas City St.")
9 Reagan National Primarily Provides Short- and Medium-Haul Domestic Air Service Seattle Portland Oakland San Francisco Los Angeles San Diego Las Vegas Salt Lake City Phoenix Nonstop Service Single Plane Service Seasonal Service New Service (TLH Feb-18, LIT Apr-18, MGM Jun-18) TOTAL MARKETS JAN 2018 SERVICE 96 Destinations 10 Carriers 407 Daily Departures Beyond Perimeter Destinations Denver Burlington Portland Toronto Minneapolis Syracuse Manchester Albany Rochester Boston Madison Buffalo Providence Lansing Grand Rapids Detroit Hartford Nantucket Martha s Vineyard Milwaukee White Plains Des Moines Cleveland New York (EWR-JFK-LGA) Chicago Omaha (MDW-ORD) Akron/Canton Pittsburgh Columbus Philadelphia Indianapolis Dayton Washington-DCA Kansas City St. Louis Cincinnati Louisville Charleston Norfolk Lexington Knoxville Raleigh Nashville Greensboro Bermuda Fayetteville Charlotte Memphis Chattanooga Greenville Wilmington Huntsville Little Rock Columbia Myrtle Beach Atlanta Augusta Birmingham Charleston Dallas/Ft. Worth Savannah (DAL-DFW) Montgomery Jackson Austin Houston (HOU-IAH) Source: Innovata Airline Schedules (December 2017 November 2018), via Diio MI Online Portal as of December 20, New Orleans Ottawa Jacksonville Pensacola Tallahassee Ft. Walton Beach Montreal Bangor Orlando Tampa Nassau Sarasota West Palm Beach Ft. Myers Ft. Lauderdale Miami San Juan Key West Most flight segment lengths are limited by 1,250 mile Perimeter Rule Takeoffs and landings are controlled and limited by High Density Rule (Slots)
10 2016 is the 6 th Consecutive Year of Record Enplanements at Reagan National The 7 th consecutive year of enplanement growth and 6 th consecutive year of record enplanements. Reagan National experienced a 2.4% increase in enplanements in 2016 Southwest led the growth with 12.7% increase in enplanements while American Airlines enplanements decreased 0.4% The record enplanement growth is due to reallocation of US/AA slots in 2014 to low cost carriers and ensuing aircraft upgauge by the carriers Southwest has overtaken Delta as the 2 nd largest carrier at Reagan National New Destinations in 2017 and 2018 Grand Rapids, MI Fayetteville, AR Pensacola, FL Los Angeles, CA 1 - Excludes general aviation and military enplanements. 2 - Total commercial passenger share. Ft. Walton Beach, FL Little Rock, AR Montgomery, AL Myrtle Beach, SC Tallahassee, FL Reagan National Enplanements (1) (in millions) YTD Nov 2017 Reagan National Carrier Market Share for the Year Ending 2016 (2) jetblue 8.2% United 7.9% Delta 13.7% Alaska 1.9% Southwest 14.6% Other 4.1% American 49.6% Top Carriers American 51.0% 49.6% Southwest 13.3% 14.6% Delta 13.6% 13.7% jetblue 8.3% 8.2% United 7.8% 7.9% Alaska 1.9% 1.8% Other 4.2% 4.1%
 YZ) Washington-IAD Nassau San Jose del Cabo Cancun Providenciales Mexico City")


11 Dulles International is the Premier International Gateway to the Capital Region Reykjavík Beijing Hong Kong Seoul Tokyo Vancouver Montreal Ottawa Toronto (YTZ-YYZ) YZ) Washington-IAD Nassau San Jose del Cabo Cancun Providenciales Mexico City Punta Cana Nonstop Service Grand Cayman St. Maarten Guatemala City Montego Single Plane Service San Salvador Bay Aruba Seasonal Service San Jose Panama City New Service (EDI May-18, HKG Sep-18) Bogota Moscow-SVO EdinburghCopenhagen Dublin Amsterdam London-LHR Frankfurt Brussels Munich Paris-CDG Vienna Geneva Zurich Rome Lisbon Barcelona Istanbul Madrid Delhi Casablanca Doha Dubai Jeddah Riyadh Abu Dhabi Dakar Accra Addis Ababa Lima La Paz Sao Paulo Johannesburg INTERNATIONAL MARKETS JAN 2018 SERVICE 57 Destinations 33 Carriers 58 Daily Departures DOMESTIC MARKETS JAN 2018 SERVICE 78 Destinations 8 Carriers 222 Daily Departures Source: Innovata Airline Schedules (December 2017 November 2018), via Diio MI Online Portal as of December 20, 2017.
12 2016 Marks 2 nd Year of Growth in Both Domestic and International Activity at Dulles International Total enplanements increased 1.4% over 2015: domestic and international enplanements increased 0.1% and 4.0%, respectively, in 2016 United s domestic enplanements increased 4.2% over 2015, the first increase since 2010 Dulles International served a record 3.7 million international enplaned passengers in the 13 th consecutive year of international traffic growth Dulles International is the only option for nonstop service to Africa, Asia, the Middle East and South America in the region. New international service continued to expand in 2016 through Dulles International Enplanements (1) (in millions) % 70% 68% 67% 67% 66% 66% 28% 30% 32% 33% 33% 34% 34% YTD Nov 2017 Domestic International New Destinations in 2017 and 2018 Dulles International Carrier Market Share for the Year Ending 2016 (2) Ft. Lauderdale, FL Montreal, QB Canada Salt Lake City, UT Austin, TX Colorado Springs, CO Chicago, IL (O Hare) Las Vegas, NV San Antonio, TX Delhi, India Clarksburg, WV Ft. Lauderdale, FL Wilmington, NC Edinburgh, Scotland Hong Kong San Jose, Costa Rica Virgin America 1.8% Southwest 2.4% Delta 4.4% American 4.6% Foreign Flag 20.1% Other 3.1% United 63.6% Top Carriers United 62.4% 63.6% American 4.8% 4.6% Delta 4.4% 4.4% Southwest 2.5% 2.4% Virgin America 1.8% 1.8% Foreign Flag 19.1% 20.1% Other 5.0% 3.1% 1 - Excludes general aviation and military enplanements. 2 - Total commercial passenger share.
13 Record System-Wide Enplanements and Diverse Carrier Mix Record system-wide enplanements and the 7 th consecutive year of system-wide enplanement growth. System-wide enplanements grew by 1.9% in 2016, exceeding the forecast of 1.5% The Airports System has a competitive mix of air carriers no one airline represents more than 35% of total enplanements Both airports have a strong O&D base of 86.8% (Reagan National) and 66% (Dulles International) of total enplanements (1) Airports System Carrier Market Share for the Year Ending 2016 (2) System-wide Enplanements (3) (in millions) jetblue 5.0% Foreign Flag 10.1% Southwest 8.7% Delta 9.3% Other 4.2% American 28.0% United 34.7% Top Carriers United 34.1% 34.7% American 28.7% 28.0% Delta 9.1% 9.3% Southwest 8.1% 8.7% jetblue 5.0% 5.0% Foreign Flag 9.8% 10.1% Other 5.2% 4.2% YTD Nov 2017 Reagan National (Total) Dulles (Domestic) Dulles (International) 1 - For the 12-month period ending June Excludes enplanements on military and general aviation flights. Totals may not add due to rounding. 3 - Total commercial passenger share.
14 Airports System Has Maintained Stable Regional Market Share and Dominant Position for International Service The Airports System constitutes 64.4% regional market share In 2016, total regional international enplanements grew 3.4% of which 2.6% was attributed to the Airports System Dulles International dominates international traffic in the region with over 83% of all international enplanements departing from the Airport - Dulles International serves 54 international destinations compared to BWI s 14 and Reagan National s 5 (1) - Dulles International is the 10 th largest international gateway in the nation (2) Regional Market Share (3) 36.6% 35.5% 34.4% 33.6% 33.1% 31.2% 30.8% 28.4% 29.1% 30.2% 31.3% 32.1% 33.7% 33.6% 35.0% 35.4% 35.4% 35.1% 34.8% 35.1% 35.6% Baltimore Washington Reagan National Dulles 1 - Diio, Scheduled August Activity as of April 18, U.S. BTS, Schedule T100 for 12 months ending October 31, Based on average daily enplaned passengers; Report of Airport Consultant (2017) Source: MWAA records; BWI Air Traffic Statistics INT L EPAX International Enplanement Market Share (in millions) IAD DCA BWI DCA 144, , , , , , ,929 IAD 3,177,235 3,256,804 3,317,819 3,463,983 3,566,920 3,574,810 3,719,341 BWI 246, , , , , , ,359 Total 3,568,257 3,655,401 3,838,470 4,072,240 4,192,789 4,321,721 4,468,629 Growth 3.2% 2.4% 5.0% 6.1% 3.0% 3.1% 3.4%
15 Current Use and Lease Agreement Provides Valuable Financial Protection and Flexibility The term of the Agreement recognizes unique needs and capital plans of each Airport Reagan National: 10-year term ( ) Dulles International: initial 3-year term ( ), extended in 2016 to 2024 to be co-terminus with Reagan National (1 st Universal Amendment) Hard Coverage: Increased airline debt service coverage payments at both Airports Year Airport Debt Service 2015 through 2017 Reagan National and Dulles International 35% 2018 through 2023 Reagan National 30% 2024 Reagan National 25% Extraordinary Coverage Protection Provision: Remains at 1.25x coverage guarantee Ability to use Reagan National s Net Revenues for Dulles International s debt costs Year in which NRR is Generated Reagan National NRR Sharing Maximum MWAA Share Usable at Dulles International in Year Following Year of Generation % MWAA/0% Airlines $40 million % MWAA/45% Airlines $35 million % MWAA/45% Airlines $30 million 2019 through % MWAA/55% Airlines $25 million 2024 To be addressed in a new use/lease agreement (effective 2025), or, if none, in accordance with the 2023 NRR allocation described above Financial provisions reflecting potential changes in Perimeter Rule at Reagan National The Commonwealth of Virginia provided a $50 million grant to lower operating costs for Dulles International, which was subject to the 1 st Universal Amendment execution


 Airfield Projects $196,613 Terminals 165,158 Utility Systems 55,167")

16 The CCP at Reagan National and Dulles International is Aligned With Their Respective Infrastructure Needs $1.8 Billion CCP Reagan National (in thousands) New North Concourse $389,435 New North Concourse Enabling Projects 167,535 Secure National Hall 264,444 Structured Parking Garage 99,242 Terminal A (Preliminary Planning), Various Airfield, Roadway, Utility and Other Projects 276,206 Total $1,196,862 Dulles International (in thousands) Airfield Projects $196,613 Terminals 165,158 Utility Systems 55,167 Access Highway Improvements 17,252 Other - Technology, AeroTrain Major Maintenance Cycle, Mobile Lounge, Rehabilitation and Various Other Projects 204,078 Total $638,268 New North Concourse and Secure National Hall AeroTrain Major Maintenance Airfield Projects Source: Report of the Airport Consultant (2017)

17 Project Journey

 Site work commences with")
 Construction begins for new passenger security checkpoints above the arrivals roadway of")


18 Adding no additional aircraft capacity at Reagan National Creating a better passenger experience by ending busing from Gate 35X and bringing people in from the cold, snow, rain and heat when boarding commuter aircraft Alleviating passenger congestion by moving security checkpoints and incorporating National Hall into a connected, post-security environment Construction Timeline 2017 (Spring) Site work commences with the demolition of aircraft hangars and the corporate office building to make way for new facilities 2017 (Summer) Construction begins for new passenger security checkpoints above the arrivals roadway of Terminals B and C 2018 Groundbreaking of a 14-gate commuter concourse to end busing and outdoor boarding at the north end of Terminal C 2020 Two new security checkpoints completed with space for a total of 28 screening lanes, fully connecting National Hall, airline gates, shops and restaurants in a post-security environment 2021 New commuter concourse opens, replacing bus operations to commuter aircraft without adding additional flight capacity
19 Continued Strong Aviation Financial Results Operating Revenues, Expenses and Operating Income ($ Millions) Operating Revenue Shares % (0.8%) % 45.9% 50.6% 49.4% Non-airline revenue share continues to increase 400 Airline Revenue Non-Airline Revenue % Revenue Expenses Operating Income 2017 YTD total operating revenues are $707.7 million, 0.8% higher than budgeted 2017 YTD operating expenses (excluding depreciation) are $336.0 million, 7.8% lower than budgeted 2017 YTD operating income is $142.4 million Note: 2017 YTD is through November 2017, unaudited
20 Non-airline Revenue Continues to Grow 2016 Operating Revenues of $774.1 Million by Type 2016 Operating Revenues of $774.1 Million by Source Other 1% Utility Sales 2% Passenger Fees 4% Landing Fees 12% Concessions 41% Airline Revenue 51% Non-airline Revenue 49% Rents 40% Concessions Revenue Growth Rates (in thousands) Concessions revenue had a robust (24.8% or $63.0 million) growth since 2014 as a result of strong performance across major concessions categories Non-airline revenue represented 43.8%, 45.9%, and 49.4% of total operating revenue in 2014 through 2016, respectively Source: Comprehensive Annual Financial Report (2016) % change % Change Parking (40%) $116,4946 $127, % $127, % Rental Cars (12%) 36,298 38, % 39, % Ground Transportation (10%) 12,643 15, % 30, % Food & Beverage (10%) 20,513 26, % 30, % Fixed Base Operator (6%) 17,276 17, % 20, % Inflight Caterers (5%) 12,088 12, % 15, % Display Advertising (5%) 9,296 11, % 14, % Newsstand and Retail (5%) 12,959 13, % 14, % Duty Free (4%) 8,189 13, % 13, % Other (3%) 7,730 9, % 10, % Total $253,486 $286, % $316, %


21 Concession Redevelopment Program Has Enhanced Revenue and is Nearing Completion Over 140 tenant spaces have been redeveloped since the program commenced in food and beverage locations have been redeveloped - 72 retail locations have been redeveloped - 8 local and 10 chef-driven restaurants Reagan National ranked 9 th and Dulles International ranked 13 th in J.D. Powers airport customer satisfaction survey in 2017


22 New Opportunities to Increase Non-Airline Revenue Concessions Digital Assets Dulles Real Estate Increase same store sales through best in-class passenger experience Leverage technology to facilitate pre-ordering and delivery of F&B and retail items Utilize technology to inform passengers about shop/dine options beyond their eyesight Convert non-revenue producing areas into revenue producing WiFi: monetize new revenue streams i.e. digital initiatives, cellular offload agreements Website advertising opportunities Distributed antenna services: new contract in 2017, higher revenue Western Lands approval process marketing program Market prior old gas station site for new opportunities Initiate marketing program on Metro-606 site to engage developers and users Improve cash flow from existing corporate assets and expiring land leases
23 Strong Financial Position Further Improves Balance Sheet Reflects Strong $944 million Net Position as of 2016 Ample Operating Liquidity Days of Unrestricted Cash on Hand rose by 494 days in 2017 compared to 2011 Sufficient Construction Liquidity supported by $200 million Commercial Paper Program Pension Programs are funded at close to 100% for General Employees and 94% for Police Officers and Firefighters retirement plans Days of Unrestricted Cash on Hand Retirement Plan Funded Ratios Nov % 110% 100% 90% 80% 109.5% 106.1% 107.7% 101.7% 104.2% 103.2% 97.5% 99.0% 99.5% 93.3% 96.9% 91.7% 99.9% 93.6% General Employees Police Officers & Firefighters Source: Comprehensive Annual Financial Report (2016); Authority records
24 2017 is Expected to Exceed the Current Forecast Enplanements at Reagan National and Dulles International* (Millions) Historical 1.6% average increase Forecast 1.4% average increase Dulles (Dom.) Dulles (Intl.) Reagan National (Total) Most long-term increase in domestic passenger demand is expected to be accommodated at IAD, while capacity constraints and operating restrictions will limit future increases in passenger numbers at DCA * Includes both revenue and non-revenue passengers on domestic and international flights. Excludes enplanements on general aviation and military flights. Totals may not add due to rounding. Source: Report of the Airport Consultant (2017)
25 $30 Budgeted Average Cost per Enplanement (CPE) Decreased in 2018 Compared to 2017 at Both Airports $25 $26.47 $26.55 $20 $15 $23.67 $21.00 $18.97 $17.82 $10 $13.39 $11.26 $13.32 $13.44 $14.12 $11.84 $5 $ Budgeted 2018 Budgeted Dulles International Reagan National
26 $33 $31 $29 Dulles International Cost per Enplanement Continues to Become More Competitive $28.52 $29.86 $30.89 $31.12 $31.12 $27 $25 $26.55 $24.60 $24.43 $24.70 $25.63 $25.75 $26.01 $23.63 $24.28 $24.62 $23 $21 $19 $23.67 $21.15 $21.00 $20.18 $18.97 $20.87 $19.68 $21.18 $22.23 $23.17 $22.64 $17 $17.57 $17.82 $ ROAC 2015 ROAC 2016 ROAC 2017 ROAC Actual 2017 Budgeted 2018 Budgeted
27 Strong 2016 Financial Performance Resulted in Robust Debt Service Coverage Ratio Debt Service Coverage Ratio Historical Budgeted Forecast Debt service coverage is conservatively budgeted to be 1.61x in 2017 and 1.62x in 2018 and forecast to remain at levels at or above 1.55x through DSCR Legal Requirement Source: Report of the Airport Consultant (2013, 2014, 2015, 2016, 2017)
28 MWAA s Aviation Debt Service Profile Total debt outstanding at Reagan National - $0.9 billion Net Debt Service at Reagan National Total debt outstanding at Dulles International - $3.6 billion Net Debt Service at Dulles International $ millions $ milions
29 Future New Money and Refunding Bond Issues CCP Estimated Sources of Funding Future New Money and Refunding Bonds* 800 Future Bonds 51% Future PFCsupported Bonds 20% Federal Grants 9% $ millions Series 2017 Bonds 9% Proceeds from Prior Bonds 11% New Money Refundings CCP projects will be 91% financed with bonds PFC-supported Bonds and grants will account for $531.1 million or 29% of total CCP funding Source: Report of the Airport Consultant (2017) $2.0 billion of Airport Revenue Bonds are available for refunding through 2024 for potential savings $1.3 billion of new money bonds through 2024 * Preliminary; subject to change
30 Airports Authority Maintains a Conservative Capital Structure $4.5 billion capital structure with 83% as traditional fixed rate debt All senior lien debt $872.9 million of unrestricted cash and investments exceed variable rate debt exposure by over 362% Bonds 64.7% Debt service reserve fund is fully cash funded, with no exposure to any surety policies Aviation Enterprise Credit Ratings Agency Rating Outlook S&P AA- Stable Fitch AA- Stable Moody s Aa3 Stable Total Debt Outstanding: $4.5 Billion As of November 2017 Unhedged Variable Rate 5.4% Synthetic Fixed Rate 12.0% Traditional Fixed Rate 82.6% Fixed Rate Debt Outstanding Debt Profile As of November 2017 % of Total Fixed Rate Debt $3,693,350, % 2009D VRDOs (Hedged) 116,785, % 2010C2 VRDOs (Hedged) 91,665, % 2010D Index Floater (Hedged) 148,840, % 2011A VRDO (Hedged) 180,020, % Variable Rate Debt (Unhedged) Fixed Rate $4,230,660, % 2003D Index Floater 53,825, % 2010C1 VRDOs 53,875, % 2011B Index Floater 133,715, % Variable Rate * $241,415, % Combined Total $4,472,075, % * Does not include $200 M Commercial Paper Program Source: November 2017 Report of the Financial Advisor, MWAA records.
 Unique dual-hub airport system supports steady enplanement growth (system-wide")
 Increased air service demonstrates carrier commitment to the market Diversified carrier mix Pricing power inherent in the unique service area translates into higher yield market for the")
31 Distinctive Aviation Credit Strengths Sound financial performance supported by Use and Lease Agreement and 1 st Universal Amendment Increasing and diversifying non-aeronautical revenue through ongoing Concessions Redevelopment Program Significant increase in unrestricted days cash on hand to 914 days (Nov 2017) Unique dual-hub airport system supports steady enplanement growth (system-wide enplanements increased 1.9% in 2016) Increased air service demonstrates carrier commitment to the market Diversified carrier mix Pricing power inherent in the unique service area translates into higher yield market for the primary carriers Moody s upgrade to Aa3 $2.0 billion of debt that is callable through 2024 provides potential savings opportunities Conservative capital structure provides long-term flexibility to manage debt service and CPE CCP defined by Use and Lease Agreement and 1 st Universal Amendment Commonwealth of Virginia $50 million grant lowers airline costs at Dulles International (2017 and 2018)


32 Dulles Corridor Enterprise

33 Dulles Toll Road mile eight-lane limited access highway; VA State Route 267 One mainline and 19 exit ramp toll collection plazas Cash and E-ZPass toll collection with 88% E-ZPass penetration in 2017 YTD A heavy commuter road with 89.6 million annual transactions in 2017 YTD
34 DTR Toll Transactions Have Performed in Line with Expectations (YTD Unaudited) T&R Forecast 9 Toll Road Transactions (Millions) JAN FEB MAR APR MAY JUN JUL AUG SEP OCT NOV DEC SUBTOTAL TOTAL Millions JAN FEB MAR APR MAY JUN JUL AUG SEP OCT NOV DEC Jan-Nov Jan-Dec % of Forecast * 108% 99% 97% 95% 98% 96% 95% 99% 95% 94% 97% 97% 89% % of Forecast * 93% 104% 99% 99% 96% 99% 97% 98% 97% 100% 98% 95% 98% 98% % of Forecast * 95% 95% 96% 102% 102% 102% 101% 103% 101% 101% 103% 101% 100% 100% * T&R Forecasts for 2015, 2016 and 2017 are based upon the CDM Smith Dulles Toll Road Comprehensive Traffic and Revenue Study 2014 Update Final Report (April 2014)
35 DTR Toll Revenues Have Been Consistent with Projections (YTD Unaudited) $15 $ T&R Forecast $13 Gross Toll Revenue ($Millions) $12 $11 $10 $9 $8 $7 $6 $5 JAN FEB MAR APR MAY JUN JUL AUG SEP OCT NOV DEC SUBTOTAL $Millions JAN FEB MAR APR MAY JUN JUL AUG SEP OCT NOV DEC Jan-Nov Jan-Dec 2017 $ 12.0 $ 11.5 $ 12.7 $ 12.7 $ 13.4 $ 13.4 $ 12.5 $ 13.2 $ 12.7 $ 13.5 $ 12.5 $ % of Forecast * 109% 101% 96% 98% 98% 97% 97% 100% 97% 96% 100% 99% 91% 2016 $ 10.5 $ 11.7 $ 13.2 $ 12.9 $ 13.1 $ 13.5 $ 12.7 $ 13.2 $ 12.8 $ 13.6 $ 12.3 $ 12.2 $ $ % of Forecast * 92% 102% 97% 97% 95% 96% 96% 96% 97% 101% 97% 94% 97% 97% 2015 $ 11.4 $ 10.6 $ 12.3 $ 13.1 $ 13.3 $ 13.4 $ 13.3 $ 13.0 $ 12.9 $ 13.4 $ 12.1 $ 12.5 $ $ % of Forecast * 93% 93% 93% 99% 100% 99% 98% 102% 100% 99% 102% 99% 98% 98% TOTAL * T&R Forecasts for 2015, 2016 and 2017 are based upon the CDM Smith Dulles Toll Road Comprehensive Traffic and Revenue Study 2014 Update Final Report (April 2014)


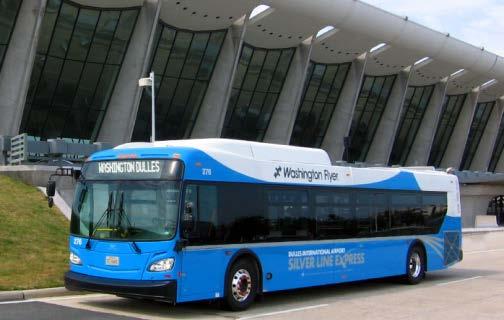
36 Dulles Metrorail Project Silver Line Phase 1 and Phase 2


37 Dulles Metrorail Project Phase 1 opened for passenger service in July 2014 Phase 2 scheduled to be completed in late 2019, operational in 2020 Phase 2 construction is in progress; as of November Design completion - 100% - Construction completion - 63% - Overall completion - 74%
38 Allocation of Dulles Metrorail Project Costs SOURCES OF CAPITAL FUNDS PHASE 1 PHASE 2 (1) RAIL PROJECT BUDGET prior to NVTA funding RAIL PROJECT BUDGET after NVTA funding $ Millions Total % of Total Change Total Federal Government $ 900 $ - $ % $ 900 Commonwealth of Virginia (2) % 575 Northern Virginia Transportation Authority (3) % Fairfax County % (9.7) 918 Loudoun County % (2.9) 274 MWAA (Aviation Funds) % (2.5) 234 MWAA (Dulles Toll Road) $ 1,430 $ 1,415 $ 2, % (45.0) $ 2,800 (4) TOTAL SOURCES OF FUNDS $ 2,982 $ 2,778 $ 5, % $ - $ 5,760 Fixed Amount Fixed Percentage of total cost Residual (1) Phase 2 Parking Garages are to be funded directly by the Counties and are not included in the Total Rail Project Budget. (2) Does not include $150 million from the Commonwealth that is being used to pay interest on Dulles Toll Road revenue bonds. (3) NVTA grant can only be used to pay or reimburse capital costs for Innovation Center Metrorail Station. (4) Phase 2 Costs include $551 million in unallocated contingency.
39 MWAA s Dulles Corridor Debt Service Profile Total debt at Dulles Toll Road - $2.7 billion Net Debt Service at Dulles Toll Road $350 $300 $250 $200 $ millions $150 $100 $50 $ First Senior Second Senior Subordinate Junior TIFIA Loan Debt Outstanding (millions) $198 $1,676 $150 $1,278 Credit Ratings: Moody s S&P Global A2 A- Baa1 BBB+ Baa2 BBB+ Baa2 A-


40 DCE Credit Remains Stable and Strong DTR annual Net Toll Revenue is stable and no additional toll increases are planned before 2019 DTR traffic and revenue performance is consistent with projections Phase 2 - As of November 2017, 74% complete Existing funding commitments are sufficient to complete the Metrorail Project


41 Recent Accomplishments Ongoing Opportunities Closing Remarks Extended the Use and Lease Agreement to 2024 for Dulles International Improved competitive position of Dulles International Commonwealth of Virginia $50 million grant New and expanded service at Dulles International Planning for new facilities at Reagan National Major concessions redevelopment at both Airports Sound financial performance, including debt service savings Moody s upgrade to Aa3 Continue improving Dulles International competitive position Continuation of concessions redevelopment Construction of new facilities at Reagan National Ongoing Dulles Corridor Metrorail construction Debt Service savings
42 2018 Preliminary Plan of Finance* Airport System Revenue and Refunding Bonds, Series 2018 Bonds: Approx. $428 million current refunding, fixed rate, 20-year term Series 2008A AMT, $159.6 million callable par with maturities Series 2009C Non-AMT, $268.5 million callable par with maturities Potential issuance of $200 million of new money for capital construction Evaluating opportunities to refund other outstanding bonds and terminate the associated Swap Agreements * Preliminary, subject to change


43 Contacts: Andrew Rountree VP for Finance and CFO Valerie O Hara Debt Program Manager Valerie.OHara@mwaa.com Giedre Ball Debt Program Analyst Giedre.Ball@mwaa.com
Metropolitan Washington Airports Authority (MWAA)
") RONALD REAGAN WASHINGTON NATIONAL DULLES TOLL ROAD DULLES METRORAIL WASHINGTON DULLES INTERNATIONAL Metropolitan Washington Airports Authority (MWAA) Andrew Rountree Chief Financial Officer & Vice President
RONALD REAGAN WASHINGTON NATIONAL DULLES TOLL ROAD DULLES METRORAIL WASHINGTON DULLES INTERNATIONAL Metropolitan Washington Airports Authority (MWAA) Andrew Rountree Chief Financial Officer & Vice President
August air traffic statistics. Prepared by the Office of Corporate Risk and Strategy
 August 214 air traffic statistics Prepared by the Office of Corporate Risk and Strategy Metropolitan Washington Airports Authority Air Traffic Statistics Table of Contents Summary Air Traffic Summary...
July air traffic statistics. Prepared by the Office of Corporate Risk and Strategy
 July 214 air traffic statistics Prepared by the Office of Corporate Risk and Strategy Air Traffic Statistics Table of Contents Summary Air Traffic Summary... 1 SH&E Air Traffic Schedule Activity... 3 Passenger
Committee for Dulles. June 9, Jack Potter, MWAA President & CEO
 Committee for Dulles June 9, 2016 Jack Potter, MWAA President & CEO Dulles International is the Premier International Gateway to the Capital Region Dom Intl Total Mainline Airlines 10 29 37* Destinations
November Air Traffic Statistics. Prepared by the Office of Corporate Risk and Strategy
 November 214 Air Traffic Statistics Prepared by the Office of Corporate Risk and Strategy Air Traffic Statistics Table of Contents Summary Air Traffic Summary... 1 SH&E Air Traffic Schedule Activity...
June Air Traffic Statistics. Prepared by the Office of Corporate Risk and Strategy
 June 214 Air Traffic Statistics Prepared by the Office of Corporate Risk and Strategy Air Traffic Statistics Table of Contents Summary Air Traffic Summary... 1 SH&E Air Traffic Schedule Activity... 3 Passenger
August Air Traffic Statistics. Prepared by the Office of Corporate Risk and Strategy
 August 215 Air Traffic Statistics Prepared by the Office of Corporate Risk and Strategy Metropolitan Washington Airports Authority Air Traffic Statistics Table of Contents Summary Air Traffic Summary...
December Air Traffic Statistics. Prepared by the Office of Marketing & Consumer Strategy
 December 217 Air Traffic Statistics Prepared by the Office of Marketing & Consumer Strategy 1 This report includes only data submitted by airlines as of the date of publication: February 2, 217. Reports
August Air Traffic Statistics. Prepared by the Office of Marketing & Consumer Strategy
 August 218 Air Traffic Statistics Prepared by the Office of Marketing & Consumer Strategy This report includes only data submitted by airlines as of the date of publication: October 17, 218. Reports are
air traffic statistics
 December 213 air traffic statistics Prepared by the Office of Finance Department of Internal Controls, Compliance and Financial Strategy Commercial Total Dom Int'l Passengers % Change Air Traffic Summary
October Air Traffic Statistics. Prepared by the Office of Corporate Risk and Strategy
 October 214 Air Traffic Statistics Prepared by the Office of Corporate Risk and Strategy Metropolitan Washington Airports Authority Air Traffic Statistics Table of Contents Summary Air Traffic Summary...
January Air Traffic Statistics. Prepared by the Office of Marketing & Consumer Strategy
 January 218 Air Traffic Statistics Prepared by the Office of Marketing & Consumer Strategy This report includes only data submitted by airlines as of the date of publication: March 21, 218. Reports are
February Air Traffic Statistics. Prepared by the Office of Marketing & Consumer Strategy
 February 218 Air Traffic Statistics Prepared by the Office of Marketing & Consumer Strategy 1 This report includes only data submitted by airlines as of the date of publication: April 18, 218. Reports
air traffic statistics
 October 213 air traffic statistics Prepared by the Office of Finance Department of Internal Controls, Compliance and Financial Strategy Metropolitan Washington Airports Authority Air Traffic Statistics
air traffic statistics
 June 23 air traffic statistics Prepared by the Office of Finance Department of Internal Controls, Compliance and Financial Strategy Metropolitan Washington Airports Authority Air Traffic Statistics Table
September Air Traffic Statistics. Prepared by the Office of Marketing & Consumer Strategy
 September 2018 Air Traffic Statistics Prepared by the Office of Marketing & Consumer Strategy This report includes only data submitted by airlines as of the date of publication: November 14, 2017. Reports
September Air Traffic Statistics. Prepared by the Office of Corporate Risk and Strategy
 September 214 Air Traffic Statistics Prepared by the Office of Corporate Risk and Strategy Air Traffic Summary September 214 Commercial Total Dom Int'l Passengers % Change Passenger Activity (in Millions)
Westshore Development Forum April 11, Hillsborough County Aviation Authority
 Westshore Development Forum April 11, 2017 Aviation in Florida Only state with four large hub airports $144 billion in annual economic activity or output Approximately 43.1 million visitors come to Florida
air traffic statistics
 July 23 air traffic statistics Prepared by the Office of Finance Department of Internal Controls, Compliance and Financial Strategy Air Traffic Summary July 23 Below is a summary of the July 23 Air Traffic
air traffic statistics
 September 213 air traffic statistics Prepared by the Office of Finance Department of Internal Controls, Compliance and Financial Strategy Commercial Total Int'l Dom Passengers % Change Air Traffic Summary
February Air Traffic Statistics. Prepared by the Office of Corporate Risk and Strategy
 February 215 Air Traffic Statistics Prepared by the Office of Corporate Risk and Strategy Commercial Total Dom Int'l Passengers % Change Air Traffic Summary February 215 Passenger Activity (in Millions)
Trends Shaping Houston Airports
 Trends Shaping Houston Airports Ian Wadsworth Chief Commercial Officer April 2014 Our mission is to connect Houston with the world Connect the people, businesses, cultures and economies of the world to
May Air Traffic Statistics. Prepared by the Office of Corporate Risk and Strategy
 May 214 Air Traffic Statistics Prepared by the Office of Corporate Risk and Strategy Commercial Total Int'l Dom Air Traffic Summary May 214 Passenger Activity (in Millions) Current Month Year-to-Date Last
September Air Traffic Statistics. Prepared by the Office of Marketing & Consumer Strategy
 September 217 Air Traffic Statistics Prepared by the Office of Marketing & Consumer Strategy This report includes only data submitted by airlines as of the date of publication: November 15, 217. Reports
Airline Business Development Update. June 22, 2017
 Airline Business Development Update June 22, 2017 Office of Airline Business Development s Primary Mission Expanding Air Service at Dulles International and Discouraging New Flights at Reagan National
Dulles Update and the Outlook Ahead
 Dulles Update and the Outlook Ahead December 15, 2016 Christopher U. Browne Vice President and Airport Manager Washington Dulles International Airport This is going to sound extremely dumb, but here's
Location, Location, Location. 19 th Annual NIC Conference NIC MAP Data & Analysis Service
 Location, Location, Location 19 th Annual NIC Conference NIC MAP Data & Analysis Service The Great Occupancy Decline 94% Occupancy Trends Majority Nursing Seniors Housing 93% 92% 91% 92.8% 91.0% 90% 89%
Welcome Fairfax County Transportation Advisory Commission and FC-DOT Staff
 Welcome Fairfax County Transportation Advisory Commission and FC-DOT Staff July 29, 2014 Metropolitan Washington Airports Authority MWAA was created through a bi-state compact between the Commonwealth
Lower Income Journey to Work Market Share From American Community Survey
 Lower Income Journey to Work Market Share From American Community Survey 2006-2010 Table 1: Overall National Data Table 2: Car, Truck or Van Table 3: Transit Table 4: Metrics Table 1 Work Trip Market Share:
March 4, Investor Conference
 March 4, 2014 Investor Conference Disclaimer This Investor Presentation is provided for your general information and convenience only, is current only as of its date and does not constitute an offer to
Norwegian's Free Airfare Promotion
 Norwegian's Free Airfare Promotion Start planning your next vacation with 200+ cruises to incredible destinations, including Alaska, Bahamas & Florida, Bermuda, Canada & New England, Caribbean, Mexican
Report to the Dulles Corridor Advisory Committee
 Report to the Dulles Corridor Advisory Committee Information Report on Dulles Toll Road Toll Rate Adjustment Process and Tentative Schedule and Overview of Traffic and Revenue Study Update May 2018 Purpose
2016 Air Service Updates
 Air Service Update September 2016 2016 Air Service Updates February 2016 Pittsburgh new destination, 2x weekly April 2016 Los Angeles new departure, 1x daily Atlanta new departure, 1x daily Jacksonville
2016 Air Service Updates
 Air Service Update May 2016 2016 Air Service Updates February 2016 Pittsburgh new destination, 2x weekly April 2016 Los Angeles new departure, 1x daily Atlanta new departure, 1x daily Jacksonville new
2016 Air Service Updates
 Air Service Update June 2016 2016 Air Service Updates February 2016 Pittsburgh new destination, 2x weekly April 2016 Los Angeles new departure, 1x daily Atlanta new departure, 1x daily Jacksonville new
World Class Airport For A World Class City
 World Class Airport For A World Class City Air Service Update April 2018 2018 Air Service Updates February 2018 Seattle new departure, seasonal, 2x weekly Boston new departure, seasonal, 2x weekly March
2016 Air Service Updates
 2016 Air Service Updates February 2016 Pittsburgh new destination, 2x weekly April 2016 Los Angeles new departure, 1x daily Atlanta new departure, 1x daily Jacksonville new destination, 2x weekly Philadelphia
World Class Airport For A World Class City
 World Class Airport For A World Class City Air Service Update October 2017 2017 Air Service Updates February 2017 Cleveland new destination, 2x weekly Raleigh-Durham new destination, 2x weekly March 2017
World Class Airport For A World Class City
 World Class Airport For A World Class City Air Service Update April 2017 2017 Air Service Updates February 2017 Cleveland new destination, 2x weekly Raleigh-Durham new destination, 2x weekly March 2017
CONCESSIONS FUTURE OPPORTUNITIES
 CONCESSIONS FUTURE OPPORTUNITIES MARCH 14 & 15, 2019 COLORADO S STRONG ECONOMY 2 ABOVE AVERAGE GROWTH 3 19 FORTUNE 1000 COMPANIES Fortune 1000 Companies & Major Relocations and Expansions into Metropolitan
World Class Airport For A World Class City
 World Class Airport For A World Class City Air Service Update December 2018 2018 Air Service Updates February 2018 Delta Air Lines Seattle new departure, seasonal, 2x weekly Delta Air Lines Boston new
Passengers Boarded At The Top 50 U. S. Airports ( Updated April 2
 (Ranked By Passenger Enplanements in 2006) Airport Table 1-41: Passengers Boarded at the Top 50 U.S. Airportsa Atlanta, GA (Hartsfield-Jackson Atlanta International) Chicago, IL (Chicago O'Hare International)
Pre-Response Meeting RLI # AV-01 Food & Beverage Service Terminals 1 & 2
 Pre-Response Meeting RLI #20120821-AV-01 Food & Beverage Service Terminals 1 & 2 January 17, 2013 FLL in Perspective 2011- FLL ranked as the 21 st busiest airport in the U.S. with 23,349,835 total passengers
Airline Business Development Information Report
 Strategic Development Committee Airline Business Development Information Report November 2017 Passengers (Millions) 5 4 3 2 1 0 MWAA System Passenger Activity 2016 MWAA Total 2017 MWAA Total 4.34 4.21
Hector International Airport Fargo, North Dakota
 Hector International Airport Fargo, North Dakota Volume 073 Twelve Months Ended September 2007 January 2008 Airlines Serving Fargo Carried 831 Onboard Passengers Per Day for the Twelve Months Ended September
The Metropolitan Airports Commission and MSP International Airport
 The Metropolitan Airports Commission and MSP International Airport Brian Ryks, Executive Director and CEO Metropolitan Airports Commission My Flight Track Duluth Aberdeen St. Cloud Twin Cities Grand Rapids
2018 City of Houston Investor Conference. Kenneth Gregg, Interim Deputy Director of Finance
 2018 City of Houston Investor Conference Kenneth Gregg, Interim Deputy Director of Finance April 24, 2018 1 Disclaimer This Investor Presentation is provided for your general information and convenience
STATE OF UTAH "BEST VALUE" COOPERATIVE CONTRACT CONTRACT NUMBER: AR2270 November 14, 2016
 Item: Contracted Airline Fares Purchasing Agent: Chad Hinds Phone #: (801) 538-1287 Email: chinds@utah.gov Vendor: 112932A Internet Homepage: Delta Air Lines, Inc. 1030 Delta Blvd. Atlanta, GA 30354 www.statetravel.utah.gov
Hector International Airport Fargo, North Dakota
 Hector International Airport Fargo, North Dakota Volume 072 Twelve Months Ended June 2007 November 2007 Airlines Serving Fargo Carried 830 Onboard Passengers Per Day for the Twelve Months Ended June 2007,
Delta Already Has Access to 79 Percent of U.S.-Rome Traffic with Its JFK Service
 Already Has Access to 79 Percent of U.S.-Rome Traffic with Its Service Philadelphia R-103 (Rebuttal to -103) Seattle Portland Salt Lake City Denver Chicago Detroit Cleveland Columbus Dayton Pittsburgh
Airport development within VINCI
 Airport development within VINCI 1 The airport sector: a development goal since 1995 VINCI Concessions: a portfolio of outstanding airport concessions 22 airports in Mexico 2 airports in Cambodia: Phnom
Welcome Central Florida Expressway Authority
 Welcome Central Florida Expressway Authority Central Florida Expressway Authority Phil Brown Executive Director Greater Orlando Aviation Authority November 12, 2015 In the Beginning The Orlando Experience
Fort Lauderdale August 8, 2017
 Fort Lauderdale August 8, 2017 8/10/2017 TAP Software Analytics Division Brian Finucane TAP Reports Jeff Eastman TAP Hotel Reports Jeanne Eastman TAP Data Source Jeff Eastman Cloud Database Numerous Data
2010 FAA Great Lakes Region Annual Conference State of Airport Financing November 3, Marsha Stone, CFO Indianapolis Airport Authority
 2010 FAA Great Lakes Region Annual Conference State of Airport Financing November 3, 2010 Marsha Stone, CFO Indianapolis Airport Authority Economy and Aviation Industry U.S. Aviation Traffic: Signs of
MANGO MARKET DEVELOPMENT INDEX REPORT
 MANGO MARKET DEVELOPMENT INDEX REPORT 2015-2016 UNDERSTANDING THE MARKET INDEX The Mango Market Development Index is designed to measure and compare mango sales volume relative to population by region
District Match Data Availability
 District Match Data Availability National & State Data Location Available National Data Australia Parliament, Provincial and Territory Assemblies Canada Parliament, Provincial Legislative Assemblies New
Massport. Airline Route Development at Boston Logan
 Massport Airline Route Development at Boston Logan Presentation to MLA: July 13, 2017 Airline Route Development is a Core Element of Massport s Mission Enhance the economic growth in Massachusetts and
October 2018 October 2017 Change
 AIR TRAFFIC REPORT SUMMARY: OCTOBER PASSENGERS October October Change Domestic Passengers 1,969,141 1,861,225 5.8% International Passengers 89,328 74,157 20.5% Total Passengers 2,058,469 1,935,382 6.4%
LOS ANGELES INTERNATIONAL AIRPORT
 LOS ANGELES INTERNATIONAL AIRPORT February 27, 2014 Disclaimer GENERAL This presentation you are about to view is provided as of February 27, 2014. If you are viewing this presentation after February 27,
Hector International Airport Fargo, North Dakota
 Hector International Airport Fargo, North Dakota Volume 081 Twelve Months Ended March 2008 July 2008 Airlines Serving Fargo Carried 838 Onboard Passengers Per Day for the Twelve Months Ended March 2008,
Greater Orlando Aviation Authority Orlando International Airport Destinations by Airline December 2017
 Aer Lingus Dublin, Ireland 3 3 0 0 Aeromexico Mexico City, Mexico 19 4 19 4 0 Air Canada Halifax, Nova Scotia 2 2 Montreal/Dorval, Quebec 12 1 Ottawa, Ontario 5 3 1 Toronto, Ontario 20 1 Vancouver, British
U.S. Lodging Industry Update
 U.S. Lodging Industry Update First Watch on a Long Voyage R. MARK WOODWORTH AMERICAS RESEARCH AGENDA THE ECONOMY WHAT COULD END THE CURRENT CYCLE? LABOR COSTS OUR FORECASTS SHARING ECONOMY UPDATE First
Aviation Insights No. 5
 Aviation Insights Explaining the modern airline industry from an independent, objective perspective No. 5 November 16, 2017 Question: How has air travel in specific metropolitan areas changed in recent
PITTSBURGH INTERNATIONAL AIRPORT ANALYSIS OF SCHEDULED AIRLINE TRAFFIC. October 2016
 ANALYSIS OF SCHEDULED AIRLINE TRAFFIC October 2016 Passenger volume Pittsburgh International Airport enplaned passengers totaled 379,979 for the month of October 2016, a 7.0% increase from the previous
333 W. Campbell Road, Suite 440 Richardson, Texas Cruising for Charity with Randy Limbacher in Tahiti July 28, 2007
 333 W. Campbell Road, Suite 440 Richardson, Texas 75080 972.238.1998 800.952.1998 Cruising for Charity with Randy Limbacher in Tahiti July 28, 2007 Join me for this special annual event to raise money
University of Denver
 Glenn R. Mueller, Ph.D. Professor University of Denver Franklin L. Burns School of Real Estate & Construction Management & Real Estate Investment Strategist glenn.mueller@du.edu Supply The new supply of
2012 Airport Ground Transportation
 212 Airport Ground Transportation Fees and Fares Survey Summary March 212 AGTA 212 Airport Fees and Fares Survey Summary Survey Respondents Atlantic City International Airport Gulfport-Biloxi International
Airports Council International
 Airports Council International HOW SECURITY CONTRIBUTES TO THE ECONOMIC COMPETITIVENESS OF THE AIR CARGO INDUSTRY 16APRIL 2014 Michael Rossell Director ICAO Relations ACI World 1 Mission ACI promotes the
Mango Market Development Index
 Mango Market Development Index 2016-2017 Understanding the Market Index The Mango Market Development Index is designed to measure and compare mango volume sold at retail relative to population by region
Greater Orlando Aviation Authority Orlando International Airport Airlines by Destination December 2017
 s by Destination Aguadilla, PR JetBlue 7 2 Akron/Canton, OH Southwest 1 Spirit 6 1 Albany, NY JetBlue 7 Southwest 14 1 Aruba, Netherlands Antilles Southwest 7 Atlanta, GA Delta 112 1 3 Frontier s 7 Southwest
SEPTEMBER 2014 BOARD INFORMATION PACKAGE
 SEPTEMBER 2014 BOARD INFORMATION PACKAGE MEMORANDUM TO: Members of the Airport Authority FROM: Lew Bleiweis, Executive Director DATE: September 19, 2014 Informational Reports: A. July, 2014 Traffic Report
2012 Airfares CA Out-of-State City Pairs -
 2012 Airfares Out-of-State City Pairs - Contracted rates are from July 1, 2012 through June 30, 2013. Please note all fares are designated as () and ( ) in airline computer reservation systems. fares are
CONNECTICUT INTERSTATE AND INTRASTATE LOCAL REDUCED CITY-PAIR FARES
 PASSENGER TARIFF AND SALES MANUAL CONNECTICUT INTERSTATE AND INTRASTATE LOCAL REDUCED CITY-PAIR S The following section contains city-pair fares that are lower than walkup mileage-based fares. Although
ACI 2008 WORLDWIDE AIRPORT TRAFFIC STATISTICS
 WORLD AIRPORT RANKING BY TOTAL PASSENGERS TOTAL PASSENGERS 1 ATLANTA GA ATL 90 039 280 0.7 2 CHICAGO IL ORD 69 353 876 ( 9.0) 3 LONDON LHR 67 056 379 ( 1.5) 4 TOKYO HND 66 754 829 ( 0.2) 5 PARIS CDG 60
PORT OF SEATTLE PRESENTATION TO THE WESTERN STATES INSTITUTIONAL INVESTORS CONFERENCE MAY 15, 2018
 PORT OF SEATTLE PRESENTATION TO THE WESTERN STATES INSTITUTIONAL INVESTORS CONFERENCE MAY 15, 2018 Elizabeth Morrison, Port of Seattle Director of Corporate Finance 0 OVERVIEW Regional Economy Port Financial
Emerging Trends in Real Estate Sustaining Momentum but Taking Nothing for Granted
 Emerging Trends in Real Estate 2015 Sustaining Momentum but Taking Nothing for Granted PwC-ULI Outlook on trends 36th edition 368 interviews 1,055 survey responses 1,400+ participants, a record Who? District
Greater Orlando Aviation Authority Orlando International Airport Airlines by Destination April 2017
 s by Destination Aguadilla, PR JetBlue 7 Akron/Canton, OH Southwest 1 4 Spirit 7 7 Albany, NY JetBlue 7 Southwest 20 1 1 Albuquerque, NM Southwest 1 1 Aruba, Netherlands Antilles Southwest 7 Atlanta, GA
March Raymond James Institutional Investors Conference
 March 2009 Raymond James Institutional Investors Conference Safe Harbor Certain of the statements contained herein should be considered forward-looking statements, including within the meaning of the Private
Higher Education in America s Metropolitan Areas A Statistical Profile
 Higher Education in America s Metropolitan Areas A Statistical Profile MSA Study No.2 Higher Education in America s Metropolitan Areas A Statistical Profile CONTENTS Why Metro Areas? 1 Executive Summary
March Commission Presentation Director s Report
 March Commission Presentation Director s Report Rebecca Hupp A.A.E. Boise Airport Director MARCH 1, 2018 Airport Operations Update FAA certification inspection revealed zero discrepancies We commend you
Brian Ryks Executive Director and CEO
 Brian Ryks Executive Director and CEO MAC Commissioners MAC Finances 2016 Budgeted Operating Revenues Utilities and Other 5% Airline Rates and Charges 34% Rents and Fees 14% Concessions 47% 2016 Budgeted
Dallas/Fort Worth International Airport Development Opportunities Southgate Plaza
 Dallas/Fort Worth International Airport Development Opportunities Southgate Plaza City of Dallas Economic Development Committee Briefing March 2, 2009 Business Overview Business Overview DFW s contribution
June Commission Presentation Director s Report
 June Commission Presentation Director s Report Rebecca Hupp Boise Airport Director JUNE 1, 2017 Airport Operations Update May 9 Airport Operations attended and presented at the 2017 National Weather Service
ANDREW WATTERSON Vice President Planning and Revenue Management
 ANDREW WATTERSON Vice President Planning and Revenue Management Safe Harbor Statement The following information contains certain forward looking statements that reflect the Company s current views with
Access Across America: Transit 2014
 Access Across America: Transit 2014 Final Report CTS 14-11 Prepared by: Andrew Owen David Levinson Accessibility Observatory Department of Civil, Environmental, and Geo- Engineering University of Minnesota
BLACK KNIGHT HPI REPORT
 CONTENTS 1 OVERVIEW 2 NATIONAL OVERVIEW 3 LARGEST STATES AND METROS 4 FEBRUARY S BIGGEST MOVERS 5 20 LARGEST STATES 6 40 LARGEST METROS 7 ADDITIONAL INFORMATION OVERVIEW Each month, the Data & Analytics
3 Aviation Demand Forecast
 3 Aviation Demand 17 s of aviation demand were prepared in support of the Master Plan for Harrisburg International Airport (the Airport or HIA), including forecasts of enplaned passengers, air cargo, based
Report to the Finance Committee Comprehensive Annual Financial Report. Prepared by the Office of Finance April 2017
 Report to the Finance Committee 2016 Comprehensive Annual Financial Report Prepared by the Office of Finance April 2017 Audit Opinion date March 31, 2017 Unmodified or clean audit opinion on financial
Florida's Scheduled Commercial Service Airports
 Florida's Scheduled Commercial Service Airports Volume 154 May 2016 - Domestic Airlines Serving Florida Carried 170,726 Onboard Passengers Per Day for, up 7.7% over the previous 12 months. Highlights in
Vanderbilt Travel January 2019 Airfare Price Testing Testing Session, January 14, 9:30am 10:30am
 Feb 28 Feb 13, 4:50pm Feb 7, 12:05pm Feb 26, 1:18pm Date / Time 2:35pm/5:35pm/10:55pm Feb 8, 10:40pm / 1:20pm City Pair New York (LGA) Denver (DEN) Washington (DCA) Abuja (ABV) Abu Dhabi (AUH) Southwest
PUBLIC TRANSPORTATION INTRODUCTION
 PUBLIC TRANSPORTATION INTRODUCTION 1 OUTLINE Current Status and Recent Trends Significant Influences A Critical Assessment Arguments Supporting Public Transport Future Influences Ingredients for Future
Hotel Valuation and Transaction Trends for the U.S. Lodging Industry
 Hotel Valuation and Transaction Trends for the U.S. Lodging Industry June 2010 Presented by Steve Rushmore, MAI, FRICS, CHA srushmore@hvs.com - 1 - Value Trend for a Typical U.S. Hotel 1987 1988 1989 1990
May Commission Presentation Director s Report
 May Commission Presentation Director s Report Rebecca Hupp A.A.E. Boise Airport Director MAY 3, 2018 April Runway Closures April 5: 10R/28L, 10:00 a.m. 11:00 a.m. Lighting maintenance April 11: 10L/28R,
Managing in a High Cost Energy World
 Arne Haak, AirTran Holdings, Inc. Managing in a High Cost Energy World Insert your Company Safe Harbor Certain of the statements contained herein should be considered forward-looking statements, including
Greater Orlando Aviation Authority - Orlando International Airport Airlines by Destination July 2018
 s by Destination Aguadilla, PR JetBlue 14 -- -- Akron/Canton, OH Albany, NY Southwest 8-1 -- Albuquerque, NM Frontier s 3 -- 3 Southwest 2 -- -5 Amsterdam, Netherlands Delta 7 -- 7 Aruba, Netherlands Antilles
Bridget Rief, Vice President Planning and Development Metropolitan Airports Commission
 Bridget Rief, Vice President Planning and Development Metropolitan Airports Commission Topics Operations and Air Service Trends Economic Impact Striving for Excellence Planning for the Future Prep for
Broward County Aviation Department Recommended Budget Fiscal Year 2019
 Broward County Aviation Department Recommended Budget Fiscal Year 2019 Overview FY 2019 Key Operating Budget Highlights Industry and Airline Activity FLL Activity Comparison of Passenger Growth Rates Enplanement
Non-stop to/from Lambert - St. Louis International Airport 3x Daily
 Proposal of Hyannis Air Service, Inc. dba Cape Air to provide subsidized Essential Air Service for: Kirksville, Missouri Docket DOT-OST-1997-2515 Non-stop to/from Lambert - St. Louis International Airport
The Housing Market and the Macroeconomy
 The Housing Market and the Macroeconomy New England Mortgage Bankers Association October 2, 2009 1 The World is in a Deep Recession In the U.S. EMPLOYMENT: Job losses in August, 2009: -216,000 Job losses
Air Service Development Information Report and Proposed 2015 Annual Air Service Plan
 Strategic Development Committee Air Service Development Information Report and Proposed 2015 Annual Air Service Plan December 2014 a 1 2014 Air Service Overview Airlines offered little growth in seat capacity,