Mobile and Online Ticketing Update. July 8, 2016 Board of Directors Meeting
|
|
|
- Rodney Stephens
- 5 years ago
- Views:
Transcription
1 Mobile and Online Ticketing Update July 8, 2016 Board of Directors Meeting

2 Mobile Ticketing Adoption Rates 2

3 Mobile Ticketing Adoption Rates 3

4 Website Integration -The Plan Launching October December
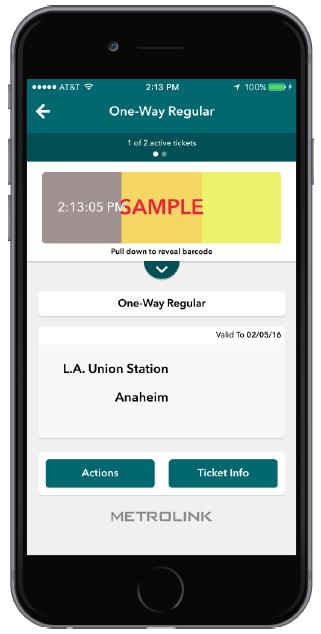
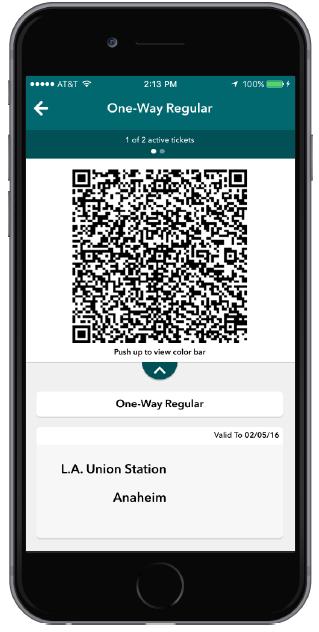
5 The Mobile App Ticketing Model Lowers Risk - Limits Fare Evasion Mobile QR codes change every two seconds Activating a ticket in the mobile wallet confirms technological handshake for tracking and validation Current paper tickets are scanned but have visual inspection features not easily duplicated Currently, only 20% of our system is scanned o Cost to do more robust fare inspection on Antelope Valley Line is $1.7 million annually o Estimated cost for system-wide fare enforcement: $12m Print at home tickets, e-tickets or text tickets increase the risk for revenue loss because they are easily duplicated Mobile App Tickets allows transfers through visual inspection Amtrak tickets do not have transfers 5
6 Industry Trends Top 10 Largest Commuter Rail Agencies by Boardings Mobile/Online Ticketing Offering Rank Agency City Served Mobile/Online Ticketing 1 Metropolitan Transit Authority - Long Island Railroad New York Purchase Online and Ticket is Mailed 2 New Jersey Transit New York/New Jersey Mobile App Only 3 Metropolitian Transit Authority Metro-North Railroad New York/ Bridgeport Purchase Online and Ticket is Mailed 4 Metra Chicago Purchase Online and Ticket is Mailed and Mobile App (Ventra) 5 Southeastern Pennslyvania Transportation Authority Philadelphia No Online Option 6 Massachusetts Bay Transportation Authority Boston Mobile App Only 7 Caltrain San Francisco No Online Option 8 Metrolink Los Angeles Mobile App Only 9 Maryland Area Regional Communter (MARC) Train Baltimore/ Washington D.C. No Online Option 10 Utah Transit Authority FrontRunner Salt Lake City Purchase Online and Ticket is Mailed 6
7 Industry Trends Top 10 Largest Public Transit Agencies Mobile/Online Ticketing Offering Rank Agency City Served Mobile/Online Ticketing 1 New York City Transit Authority New York No Online Option 2 Washington Metropolitan Area Transit Authority Washington, D.C. Purchase Online and Ticket is Mailed 3 Chicago Transit Authority Chicago Mobile App to Load Fare Media to Smartcard 4 Massachusetts Bay Transportation Authority Boston No Online Option 5 Bay Area Rapid Transit District San Francisco No Online Option 6 Southeastern Pennslyvania Transportation Authority Philadelphia No Online Option 7 Port Authority of New York and New Jersey Manhattan, Jersey City and Newark No Online Option 8 Metropolitan Atlanta Rapid Transit Authority Atlanta No Online Option 9 Los Angeles County Metropolitan Transportation Authority Los Angeles No Online Option 10 Miami-Dade Transit Miami Purchase Online and Ticket is Mailed 7
8 Fare Media Risk Assessment Mobile App Ticket Print at Home/ /T ext Tickets Kiosk/ TVM Printed Tickets Fare Evasion Risk Low High Low Counterfeiting Risk Low High Low Allow Transfers Yes No Yes Utilized on Existing Barrier Free System Yes No Yes Utilized on Proof of Payment System Yes Yes Yes 8
9 Potential Option Offer one-way and round-trip tickets through the print at home model Lowering Risk No transfers Scanning a ticket will deactivate QR code for any future use Same day purchase only Administrative Process Develop a scope and begin RFP process Develop a cost estimate 9
10

11 Masabi Overview Key Features: Visual Tickets Color bar indicates activation and authenticity. Activation status indicator highlights recent activation. Action buttons allow customers to take self service actions. Ticket product name is clearly shown. Ticket image shows key ticket information including: Station pair Fare Type Validity
Peer Performance Measurement February 2019 Prepared by the Division of Planning & Market Development
 2017 Regional Peer Review Peer Performance Measurement February 2019 Prepared by the Division of Planning & Market Development CONTENTS EXECUTIVE SUMMARY... 3 SNAPSHOT... 5 PEER SELECTION... 6 NOTES/METHODOLOGY...
Performance Measurement:
 Regional Transportation Authority Performance Measurement: Peer Reporting Transport Chicago June 7, 2013 1 RTA Performance Measurement Program 2008 RTA Act amendment Purpose: Transparency & accountability
MAKING PERFORMANCE MEASURES MATTER
 www.rtachicago.org 5 TH International Transportation Systems Performance Measurement and Data Conference June 1-2, 2015 Denver, CO MAKING PERFORMANCE MEASURES MATTER Transparency, Accountability, and Advocacy
TRANSPORTATION PROGRAMS
 High Speed Transit Corridor Studies Rail/Freight Session 2011 ITE/MSA Spring Conference Black Canyon Conference Center Phoenix, Arizona March 9, 2011 The Maricopa Association of Governments (MAG) is the
SOUTHERN CALIFORNIA REGIONAL RAIL AUTHORITY NOTICE OF PUBLIC HEARING
 SOUTHERN CALIFORNIA REGIONAL RAIL AUTHORITY NOTICE OF PUBLIC HEARING The Southern California Regional Rail Authority (SCRRA) (Metrolink) will hold a Public Hearing concerning potential Fare Policy Changes
Peer Performance Measurement February 2019 Prepared by the Division of Planning & Market Development
 2017 Sub-Regional Peer Review Peer Performance Measurement February 2019 Prepared by the Division of Planning & Market Development CONTENTS EXECUTIVE SUMMARY... 3 NOTES/METHODOLOGY... 6 AGENCIES... 7
TOP 100. Transit Bus Fleets Agency 35 ft. Over Artic and 35 ft. Total +/- under 0 3, ,426 82
 L.A. Metro-No. 3 1 1 MTA New York City Transit New York City 2 2 New Jersey Transit Corp. Newark, N.J. 3 3 Metro Los Angeles 4 5 Toronto Transit Commission Toronto 5 10 Chicago Transit Authority Chicago
TOP 100 Bus Fleets Agency 35 ft. and Over Artic under 35 ft. Total. 18 < metro magazine SEPTEMBER/OCTOBER 2018 metro-magazine.
 1 1 MTA New York City Transit/MTA Bus Co. 0 4,860 951 5,811 New York City 2 3 New Jersey Transit Corp. 418 2,879 85 3,382 Newark, N.J. 3 2 Los Angeles County Metropolitan Transportation Authority 50 1,882
TTI REVIEW OF FARE POLICY: PRELIMINARY FINDINGS
 TTI REVIEW OF FARE POLICY: PRELIMINARY FINDINGS December 2014 STATUS: TTI REVIEW OF FARE POLICY Goal: Identify and evaluate different options for a revised fare structure, including pricing strategies
Agency 35 ft. Over Artic. Trolley 2012 Total and 35 ft. under. 1 1 MTA New York City Transit 0 3, ,344 New York City
 Capital Metro-No. 40 Courtesy Capital Metro 1 1 MTA New York City Transit 0 3,704 640 0 4,344 New York City 2 3 New Jersey Transit Corp. 47 2,263 85 0 2,395 Newark, N.J. 3 2 Metro 50 1,956 378 0 2,384
Monthly Employment Watch: Milwaukee and the Nation's Largest Cities
 Monthly Employment Watch: Milwaukee and the Nation's Largest Cities A monthly report on employment trends in the nation s largest cities Prepared by: The University of Wisconsin-Milwaukee Center for Economic
ustravel.org/travelpromotion
 Agenda 1. Power of Travel Promotion Resources 2. New Tool: Travel Economic Impact Calculator 3. Accessing data through Interactive Travel Analytics 4. Unused Vacation Time Opportunity 5. Highlights from
ANNUAL BUSINESS TRAVEL INDEX MARCH 2018
 ANNUAL BUSINESS TRAVEL INDEX MARCH 2018 www.ovationtravel.com www.lawyerstravel.com 800.431.1112 TABLE OF CONTENTS ANNUAL DOMESTIC AIRFARE AVERAGE PRICE PAID...3 ANNUAL INTERNATIONAL AIRFARE AVERAGE PRICE
National Fact Sheet: FY 2008
 The name "Amtrak" is the blending of the words "America" and "track." It is properly used in documents with only the first letter capitalized. The railroad is also known as the National Railroad Passenger
BLACK KNIGHT HPI REPORT
 CONTENTS 1 OVERVIEW 2 NATIONAL OVERVIEW 3 LARGEST STATES AND METROS 4 FEBRUARY S BIGGEST MOVERS 5 20 LARGEST STATES 6 40 LARGEST METROS 7 ADDITIONAL INFORMATION OVERVIEW Each month, the Data & Analytics
Monthly Employment Watch: Milwaukee and the Nation's Largest Cities
 Monthly Employment Watch: Milwaukee and the Nation's Largest Cities A monthly report on employment trends in the nation s largest cities Prepared by: The University of Wisconsin-Milwaukee Center for Economic
The Fall of Frequent Flier Mileage Values in the U.S. Market - Industry Analysis from IdeaWorks
 Issued: February 16, 2005 Contact: Jay Sorensen For inquiries: 414-961-1939 The Fall of Frequent Flier Mileage Values in the U.S. Market - Industry Analysis from IdeaWorks Mileage buying power is weakest
Puget Sound Trends. Executive Board January 24, 2019
 Puget Sound Trends Executive Board January 24, 2019 Overview Topics covered in today s presentation: How many jobs are there? Housing Trends Where do people work? How long does it take to get to work?
The Metropolitan Airports Commission and MSP International Airport
 The Metropolitan Airports Commission and MSP International Airport Brian Ryks, Executive Director and CEO Metropolitan Airports Commission My Flight Track Duluth Aberdeen St. Cloud Twin Cities Grand Rapids
ECONOMIC IMPACT REPORT
 ECONOMIC IMPACT 2017 REPORT How the Lyft community is increasing support for local economies, earning more supplemental income, and improving the health of their cities. A decade ago, Lyft embarked on
PUBLIC TRANSPORTATION RIDERSHIP REPORT Fourth Quarter 2009
 American Public Transportation Association 1666 K Street, NW, Suite 1100 Washington, DC 20006 02-Mar-10 PUBLIC TRANSPORTATION RIDERSHIP REPORT Fourth Quarter 2009 Contact: Matthew Dickens Statistician
TRANSIT RIDERSHIP REPORT Third Quarter 2018
 American Public Transportation Association 1300 Eye St NW, Suite 1200 E Washington, DC 20005 30-Nov-18 TRANSIT RIDERSHIP REPORT Third Quarter 2018 Contact: Matthew Dickens Senior Policy Analyst Telephone:
TRANSIT RIDERSHIP REPORT Second Quarter 2017
 American Public Transportation Association 1300 Eye St NW, Suite 1200 E Washington, DC 20005 01-Sep-17 TRANSIT RIDERSHIP REPORT Second Quarter 2017 Contact: Matthew Dickens Senior Policy Analyst Telephone:
PUBLIC TRANSPORTATION RIDERSHIP REPORT Fourth Quarter 2016
 American Public Transportation Association 1300 Eye St NW, Suite 1200 E Washington, DC 20005 03-Mar-17 PUBLIC TRANSPORTATION RIDERSHIP REPORT Fourth Quarter 2016 Contact: Matthew Dickens Policy Analyst
PUBLIC TRANSPORTATION RIDERSHIP REPORT Fourth Quarter 2010
 American Public Transportation Association 1666 K Street, NW, Suite 1100 Washington, DC 20006 08-Mar-11 PUBLIC TRANSPORTATION RIDERSHIP REPORT Fourth Quarter 2010 Contact: Matthew Dickens Statistician
AGENCY: U.S. Customs and Border Protection; Department of Homeland Security.
 This document is scheduled to be published in the Federal Register on 06/25/2013 and available online at http://federalregister.gov/a/2013-15087, and on FDsys.gov 9111-14 DEPARTMENT OF HOMELAND SECURITY
Bridget Rief, Vice President Planning and Development Metropolitan Airports Commission
 Bridget Rief, Vice President Planning and Development Metropolitan Airports Commission Topics Operations and Air Service Trends Economic Impact Striving for Excellence Planning for the Future Prep for
TRANSIT RIDERSHIP REPORT Third Quarter 2013
 American Public Transportation Association 1666 K Street, NW, Suite 1100 Washington, DC 20006 19-Nov-13 TRANSIT RIDERSHIP REPORT Third Quarter 2013 Contact: Matthew Dickens Policy Analyst Telephone: (202)
TRANSIT RIDERSHIP REPORT Second Quarter 2015
 American Public Transportation Association 1666 K Street, NW, Suite 1100 Washington, DC 20006 04-Sep-15 TRANSIT RIDERSHIP REPORT Second Quarter 2015 Contact: Matthew Dickens Policy Analyst Telephone: (202)
TRANSIT RIDERSHIP REPORT Third Quarter 2012
 American Public Transportation Association 1666 K Street, NW, Suite 1100 Washington, DC 20006 28-Nov-12 TRANSIT RIDERSHIP REPORT Third Quarter 2012 Contact: Matthew Dickens Policy Analyst Telephone: (202)
TRANSIT RIDERSHIP REPORT Second Quarter 2018
 American Public Transportation Association 1300 Eye St NW, Suite 1200 E Washington, DC 20005 24-Aug-18 TRANSIT RIDERSHIP REPORT Second Quarter 2018 Contact: Matthew Dickens Senior Policy Analyst Telephone:
TRANSIT RIDERSHIP REPORT Second Quarter 2010
 American Public Transportation Association 1666 K Street, NW, Suite 1100 Washington, DC 20006 02-Sep-10 TRANSIT RIDERSHIP REPORT Second Quarter 2010 Contact: Matthew Dickens Statistician Telephone: (202)
TRANSIT RIDERSHIP REPORT Third Quarter 2008
 American Public Transportation Association 1666 K Street, NW, Suite 1100 Washington, DC 20006 04-Dec-08 TRANSIT RIDERSHIP REPORT Third Quarter 2008 Contact: Christie R. Dawson Statistician Telephone: (202)
Appendix D: Aggregation Error for New England Metro Areas and for Places
 Appendix D: for New England Metro Areas and for Places D-1 Appendix D: s Figure D-1: New England Metro Areas - Summary of Tract s (2000) Metro ID (msapma99) Metro Area Name Census NCDB 1120 Boston, MA-NH
PUBLIC TRANSPORTATION INTRODUCTION
 PUBLIC TRANSPORTATION INTRODUCTION 1 OUTLINE Current Status and Recent Trends Significant Influences A Critical Assessment Arguments Supporting Public Transport Future Influences Ingredients for Future
Parking Property Advisors and Parkopedia present: TOP 40 US CITIES PARKING INDEX
 Parking Property Advisors and Parkopedia present: TOP 40 US CITIES PARKING INDEX 2018 Parking Property Advisors and Parkopedia proudly present this 2018 Top 40 US Cities Parking Index. Whether you are
High-Speed Rail: Realizing the Potential of Megaregion Economies
 High-Speed Rail: Realizing the Potential of Megaregion Economies Petra Todorovich Director, America 2050 Regional Plan Association May 4, 2010 Rayburn House Office Building 1 2 1 Where High-Speed Rail
Largest cities in the United States by population by decade
 1 of 17 11/15/2008 7:30 AM Largest cities in the United States by population by decade From Wikipedia, the free encyclopedia This entry tracks and ranks the population of the largest cities in the United
Lower Income Journey to Work Market Share From American Community Survey
 Lower Income Journey to Work Market Share From American Community Survey 2006-2010 Table 1: Overall National Data Table 2: Car, Truck or Van Table 3: Transit Table 4: Metrics Table 1 Work Trip Market Share:
Receive and file report discussing time and distance-based fare policies.
 Los Angeles County Metropolitan Transportation Authority One Gateway Plaza Los Angeles, CA 90012-2952 OPERATIONS COMMITTEE SEPTEMBER 16,2010 SUBJECT: EVALUATION OF TIME AND DISTANCE-BASED FARE POLICIES
TRANSIT RIDERSHIP REPORT Third Quarter 2017
 American Public Transportation Association 1300 Eye St NW, Suite 1200 E Washington, DC 20005 17-Nov-17 TRANSIT RIDERSHIP REPORT Third Quarter 2017 Contact: Matthew Dickens Senior Policy Analyst Telephone:
PUBLIC TRANSPORTATION RIDERSHIP REPORT Fourth Quarter 2017
 American Public Transportation Association 1300 Eye St NW, Suite 1200 E Washington, DC 20005 13-Mar-18 PUBLIC TRANSPORTATION RIDERSHIP REPORT Fourth Quarter 2017 Contact: Matthew Dickens Senior Policy
RANKING OF THE 100 MOST POPULOUS U.S. CITIES 12/7/ /31/2016
 OVERVIEW OF THE DATA The following information is based on incoming communication to the National Human Trafficking Hotline via phone, email, and online tip report from December 7, 2007 December 31, 2016
Overseas Visitation Estimates for U.S. States, Cities, and Census Regions: 2015
 U.S. Department of Commerce International Trade Administration National Travel and Tourism Office Overseas Estimates for U.S. States, Cities, and Census Regions: Overseas to U.S. States, Cities, and Census
OBSERVERS. We shall not be moved NAACP. national Convention. advance registration form. 104 th ANNUAL CONVENTION
 OBSERVERS We shall not be moved 104 NAACP th national Convention advance registration form orlando, florida July 13-17, 2013 1 AT-LARGE OBSERVERS advanced registration Section I CONTACT INFORMATION (Please
Orange County Transportation Authority Fare Integration Project A Regional Approach
 Orange County Transportation Authority Fare Integration Project A Regional Approach APTA Fare Collection Workshop and TransITech Conference March 2012 Agenda Review our Regional Efforts Describe the Southern
Previous Studies. 1988: Coastal Corridor Rail Transit Project. 1991: LAX/Metro Green Line Interagency Task Force
 Previous Studies 1988: oastal orridor Rail Transit Project 1991: LAX/Metro Green Line Interagency Task Force 1994: Metro Green Line Northern Extension Supplemental Environmental Impact Report 2002 2004:
Federal Transit Administration New Start Full Funding Grant Agreement Quarterly Reports (for various dates)
") Description of document: Requested date: Released date: Posted date: Title of document Listing of Federal Transit Administration (FTA) reports produced for Congress not posted on the Department of Transportation
Description of document: Requested date: Released date: Posted date: Title of document Listing of Federal Transit Administration (FTA) reports produced for Congress not posted on the Department of Transportation
FBI Drug Demand Reduction Coordinators
 FBI Drug Demand Reduction Coordinators Alabama 2121 Building, Room 1400 Birmingham, AL 35203 (205) 252 7705 One St. Louis Centre One St. Louis Street Mobile, AL 36602 (334) 438 3674 Alaska 222 West Seventh
TRANSIT RIDERSHIP REPORT Third Quarter 2006
 American Public Transportation Association 1666 K Street, NW, Suite 1100 Washington, DC 20006 04-Jan-07 TRANSIT RIDERSHIP REPORT Third Quarter 2006 Contact: Christie R. Dawson Statistician Telephone: (202)
Policy Development and Research Program at APTA
 Policy Development and Research Program at APTA RIDERSHIP EASES THIRD QUARTER Public transportation ridership in the third quarter of 2011 increased 2 percent over 2010. Over 51 million more trips were
Monthly Employment Watch: Milwaukee and the Nation's Largest Cities
 Monthly Employment Watch: Milwaukee and the Nation's Largest Cities A monthly report on employment trends in the nation s largest cities Prepared by: The University of Wisconsin-Milwaukee Center for Economic
Presentation to Board of Directors on All-Door Boarding System-wide Implementation
 SFMTA Municipal Transportation Agency Image: a bus in front of the Palace of the Legion of honor Presentation to Board of Directors on All-Door Boarding System-wide Implementation 9 6 2011 SAN FRANCISCO,
METROPOLITAN STATISTICAL AREA
 Miami-Fort Lauderdale-West Palm Beach METROPOLITAN STATISTICAL AREA Broward County is part of the 8th largest metropolitan statistical area (MSA)() in the country with a population just over 6M in 2016.
Fiscal Management and Control Board. Fare Policy October 16, Draft for Discussion & Policy Purposes Only
 Fiscal Management and Control Board Fare Policy October 16, 2015 1 Components of Fares Fare Level Different types of pricing by: By mode By time of day By distance By rider type (reduced fare) Subscription
TRANSIT RIDERSHIP REPORT First Quarter 2017
 American Public Transportation Association 1300 Eye St NW, Suite 1200 E Washington, DC 20005 06-Jun-17 TRANSIT RIDERSHIP REPORT First Quarter 2017 Contact: Matthew Dickens Senior Policy Analyst Telephone:
TRANSIT RIDERSHIP REPORT Second Quarter 2007
 American Public Transportation Association 1666 K Street, NW, Suite 1100 Washington, DC 20006 30-Aug-07 TRANSIT RIDERSHIP REPORT Second Quarter 2007 Contact: Christie R. Dawson Statistician Telephone:
Experts Hope For Loving and Hugging Between Railroads, Airports
 By Carol Ward Experts Hope For Loving and Hugging Between Railroads, Airports In Dan Feger s vision of a better future for his airport, planes, trains, automobiles and buses will all converge in a single
CONCESSIONS FUTURE OPPORTUNITIES
 CONCESSIONS FUTURE OPPORTUNITIES MARCH 14 & 15, 2019 COLORADO S STRONG ECONOMY 2 ABOVE AVERAGE GROWTH 3 19 FORTUNE 1000 COMPANIES Fortune 1000 Companies & Major Relocations and Expansions into Metropolitan
Lyft s Economic Impact 2015 REPORT
 Lyft s Economic Impact 2015 REPORT In more than 65 cities nationwide, Lyft has become a powerful vehicle of change and connectivity. We studied our seven most established markets to explore Lyft s positive
Overview. ECO RAPID TRANSIT Meeting April 8, 2015 Don Sepulveda, P.E. Executive Officer Regional Rail
 Overview ECO RAPID TRANSIT Meeting April 8, 2015 Don Sepulveda, P.E. Executive Officer Regional Rail 1 What is Metro Doing? > Metro is building $30B in transit projects. > Regional Rail is building $1.2B
Strategic Central Florida Location Big Bend Road & U.S. Highway 41
 Strategic Central Florida Location Big Bend Road & U.S. Highway 41 Park Highlights 337,447 SF (Building 13124) under construction June 2017 occupancy Cross-Dock 101 Trailer Spaces 1.5 miles from I-75 8
At the end of the bill (before the short title), insert the following:
, insert the following:") AMENDMENT TO H. R. (CONTINUING APPROPRIATIONS, 0) OFFERED BY MR. PENCE OF INDIANA At the end of the bill (before the short title), insert the following: 0 SEC. ll. None of the funds made available by this
AMENDMENT TO H. R. (CONTINUING APPROPRIATIONS, 0) OFFERED BY MR. PENCE OF INDIANA At the end of the bill (before the short title), insert the following: 0 SEC. ll. None of the funds made available by this
What was Old is New Again
 What was Old is New Again IN THE BEGINNING.. Streetcars were the backbone of transit: First developed 1885-1889 Fostered economic development of urban areas. Near the streetcar s peak in the early 1920
APPENDIX B. Arlington Transit Peer Review Technical Memorandum
 APPENDIX B Arlington Transit Peer Review Technical Memorandum Arlington County Appendix B December 2010 Table of Contents 1.0 OVERVIEW OF PEER ANALYSIS PROCESS... 2 1.1 National Transit Database...2 1.2
A COMPARISON OF THE MILWAUKEE METROPOLITAN AREA TO ITS PEERS
 KRY/WJS/EDL #222377 (PDF: #223479) 1/30/15 PRELIMINARY DRAFT Memorandum Report A COMPARISON OF THE MILWAUKEE METROPOLITAN AREA TO ITS PEERS EXECUTIVE SUMMARY This memorandum report provides a statistical
Regional Aviation Baseline Study. Economic Development Board May 2, 2018
 Regional Aviation Baseline Study Economic Development Board May 2, 2018 Recommended Action Adopt Develop a regional aviation baseline study as an implementation Action Item for Amazing Place. This study
DNE Summit Italy Bound Tourism to the U.S By OLGA MAZZONI. President VISIT USA Association Italy MOTT Italian Rep. DNE Project Manager
 DNE Summit 2016 Italy Bound Tourism to the U.S. 2016 By OLGA MAZZONI President VISIT USA Association Italy MOTT Italian Rep. DNE Project Manager Italian market 4TH LARGEST EUROPEAN MARKET 12TH LARGEST
Challenges and Changes! Jeff Hamiel! Metropolitan Airports Commission!
 Challenges and Changes! Jeff Hamiel! Metropolitan Airports Commission! Industry Consolidation! Trend: Airline Outsourcing! Above- and below-wing services! Aircraft cleaning! Wheelchair assistance services!
Mango Market Development Index
 Mango Market Development Index 2016-2017 Understanding the Market Index The Mango Market Development Index is designed to measure and compare mango volume sold at retail relative to population by region
Public Outreach August 2011 Collateral Materials
 Public Outreach Collateral Materials Fact Sheet Contact card Comment Sheet Welcome Sheets LAX User Questionnaire Presentation Boards Pre-Scoping Comments Name/Nombre: Organization/Organización: Address/Dirección:
MANGO MARKET DEVELOPMENT INDEX REPORT
 MANGO MARKET DEVELOPMENT INDEX REPORT 2015-2016 UNDERSTANDING THE MARKET INDEX The Mango Market Development Index is designed to measure and compare mango sales volume relative to population by region
U.S. Metropolitan Area Exports, 2015
 U.S. Metropolitan Area Exports, 2015 Jeffrey Hall Office of Trade and Economic Analysis Industry and Analysis Department of Commerce International Trade Administration September 2016 U.S. Metro Exports:
TRANSIT RIDERSHIP REPORT First Quarter 2013
 American Public Transportation Association 1666 K Street, NW, Suite 1100 Washington, DC 20006 24-May-13 TRANSIT RIDERSHIP REPORT First Quarter 2013 Contact: Matthew Dickens Policy Analyst Telephone: (202)
Monthly Employment Watch: Milwaukee and the Nation's Largest Cities
 Monthly Employment Watch: Milwaukee and the Nation's Largest Cities A monthly report on employment trends in the nation s largest cities Prepared by: The University of Wisconsin-Milwaukee Center for Economic
Brightline Overview THE ONLY PRIVATELY OWNED, OPERATED AND MAINTAINED EXPRESS INTER-CITY TRAIN SERVICE IN THE UNITED STATES
 FSITE ANNUAL MEETING BEN PORRITT, SVP, CORPORATE AFFAIRS OCTOBER 30, 2018 Brightline Overview THE ONLY PRIVATELY OWNED, OPERATED AND MAINTAINED EXPRESS INTER-CITY TRAIN SERVICE IN THE UNITED STATES Removing
Access Across America: Transit 2014
 Access Across America: Transit 2014 Final Report CTS 14-11 Prepared by: Andrew Owen David Levinson Accessibility Observatory Department of Civil, Environmental, and Geo- Engineering University of Minnesota
MASSACHUSETTS INTERSTATE AND INTRASTATE LOCAL REDUCED CITY-PAIR FARES
 The following section contains city-pair fares that are lower than walkup mileage-based fares. Although shown in only one direction, the fares in this section apply in both directions, unless otherwise
DEPARTMENT OF HOMELAND SECURITY U.S. CUSTOMS AND BORDER PROTECTION. CBP Dec. No EXPANSION OF GLOBAL ENTRY TO NINE ADDITIONAL AIRPORTS
 This document is scheduled to be published in the Federal Register on 10/04/2016 and available online at https://federalregister.gov/d/2016-23966, and on FDsys.gov 9111-14 DEPARTMENT OF HOMELAND SECURITY
Hector International Airport Fargo, North Dakota
 Hector International Airport Fargo, North Dakota Volume 073 Twelve Months Ended September 2007 January 2008 Airlines Serving Fargo Carried 831 Onboard Passengers Per Day for the Twelve Months Ended September
Hector International Airport Fargo, North Dakota
 Hector International Airport Fargo, North Dakota Volume 072 Twelve Months Ended June 2007 November 2007 Airlines Serving Fargo Carried 830 Onboard Passengers Per Day for the Twelve Months Ended June 2007,
Spring Break Just Got Cheaper
 Fly.com 590 Madison Avenue 37th Floor New York, NY 10022 Media Contact: Michelle Erickson Fly.com, North America +1 (650) 316-6835 merickson@fly.com FOR IMMEDIATE RELEASE Spring Break Just Got Cheaper
GEOGRAPHY OF THE UNITED STATES & CANADA. By Brett Lucas
 GEOGRAPHY OF THE UNITED STATES & CANADA By Brett Lucas MEGALOPOLIS Setting the Boundaries What states and provinces are part of the region? Primarily the east coast between Norfolk, VA and Boston, MA,
Southwest Chief Fact Sheet
 General information Length of Trip: (Chicago-Los Angeles) 40+ hours Frequency: Daily Train Features: Non-Smoking Dining Car Lounge Car Checked Baggage Luggage Click here for Amtrak's luggage policy Accommodations:
International Convention Badges
 Images may not be the actual size. (Reduced the image sizes to save white space in the catalog) Images provided by Lion Verle Malik Created 07/24/2015. 1923 1924 1925 7th Annual Convention June 26-29,
All Door Boarding Title VI Service Fare Analysis. Appendix P.3
 All Door Boarding Title VI Service Fare Analysis Appendix P.3 Metro Board Report Los Angeles County Metropolitan Transportation Authority One Gateway Plaza 3rd Floor Board Room Los Angeles,
PUBLIC TRANSIT IN KENOSHA, RACINE, AND MILWAUKEE COUNTIES
 PUBLIC TRANSIT IN KENOSHA, RACINE, AND MILWAUKEE COUNTIES #118404v1 Regional Transit Authority June 19, 2006 1 Presentation Overview Existing Public Transit Transit System Peer Comparison Recent Transit
EXECUTIVE SUMMARY. hospitality compensation as a share of total compensation at. Page 1
 EXECUTIVE SUMMARY Applied Analysis was retained by the Las Vegas Convention and Visitors Authority (the LVCVA ) to review and analyze the economic impacts associated with its various operations and southern
INDIANA INTERSTATE AND INTRASTATE LOCAL REDUCED CITY-PAIR FARES
 The following section contains city-pair fares that are lower than walkup mileage-based fares. Although shown in only one direction, the fares in this section apply in both directions, unless otherwise
Book. Capitol Limited Fact Sheet. Capitol Limited Information Length of Trip: (Washington - Cleveland - Chicago) 18 Hours Frequency:Daily
 18 Hours Frequency:Daily") The Capital Limited runs daily between Washington, DC and Chicago. Washington DC - Pittsburgh - Cleveland - Chicago You'll follow the historic B&O line on your journey through the Potomac Valley, past
The Capital Limited runs daily between Washington, DC and Chicago. Washington DC - Pittsburgh - Cleveland - Chicago You'll follow the historic B&O line on your journey through the Potomac Valley, past
Park-Related Total* Expenditure per Resident, by City
 Park-Related Total* per Resident, by City FY 2008 City Population Total Park per Resident Washington, D.C. 591,833 $153,324,830 $259 Seattle 598,541 $150,672,543 $252 Scottsdale 235,371 $50,429,049 $214
Outlook for Air Travel
 University of Massachusetts Amherst ScholarWorks@UMass Amherst Tourism Travel and Research Association: Advancing Tourism Research Globally 2014 Marketing Outlook Forum - Outlook for 2015 Outlook for Air
Trial Locations ADAPT: AGS 003. United States, Arizona. United States, Arkansas. United States, California. United States, Colorado
 Trial Locations ADAPT: AGS 003 United States, Arizona Scottsdale, Arizona, United States, 85259 United States, Arkansas Little Rock, Arkansas, United States, 72205 United States, California La Jolla, California,
Emerging Trends in Real Estate Sustaining Momentum but Taking Nothing for Granted
 Emerging Trends in Real Estate 2015 Sustaining Momentum but Taking Nothing for Granted PwC-ULI Outlook on trends 36th edition 368 interviews 1,055 survey responses 1,400+ participants, a record Who? District
CGE Training: Train the Trainer Scenarios
 CGE Training: Train the Trainer Scenarios Due to the nature of how travel reservations are booked and ticketed in Train Stable it is very important that the guidelines below are followed. If the guidelines
Hector International Airport Fargo, North Dakota
 Hector International Airport Fargo, North Dakota Volume 081 Twelve Months Ended March 2008 July 2008 Airlines Serving Fargo Carried 838 Onboard Passengers Per Day for the Twelve Months Ended March 2008,
Location, Location, Location. 19 th Annual NIC Conference NIC MAP Data & Analysis Service
 Location, Location, Location 19 th Annual NIC Conference NIC MAP Data & Analysis Service The Great Occupancy Decline 94% Occupancy Trends Majority Nursing Seniors Housing 93% 92% 91% 92.8% 91.0% 90% 89%
Higher Education in America s Metropolitan Areas A Statistical Profile
 Higher Education in America s Metropolitan Areas A Statistical Profile MSA Study No.2 Higher Education in America s Metropolitan Areas A Statistical Profile CONTENTS Why Metro Areas? 1 Executive Summary
 Snakes & Lattes is currently composed of three corporate owned and operated board game cafes in Toronto, ON. Over the last 7 years these have become renowned as Toronto's premiere board game cafe destinations.
FILED: NEW YORK COUNTY CLERK 10/14/ :25 PM INDEX NO / /4/2016 Office locations in US states: PwC
 FILED: NEW YORK COUNTY CLERK 10/14/2016 02:25 PM INDEX NO. 451962/2016 10/4/2016 Office locations in US states: PwC NYSCEF DOC. NO. 9 RECEIVED NYSCEF: 10/14/2016 PwC office locations in (by state) Below