Passenger traffic decelerates to 3% growth year over year in September
|
|
|
- Megan Ferguson
- 6 years ago
- Views:
Transcription
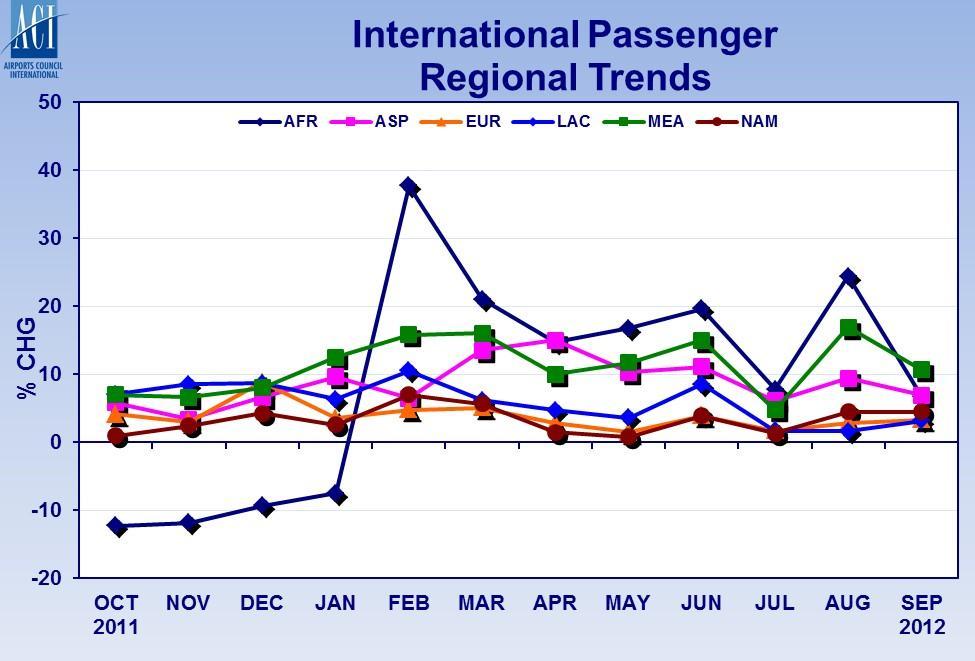
1 Passenger traffic decelerates to 3% growth year over year in September Montréal, 06 November As a result of contractions in the domestic passenger markets of Europe and North America, global passenger traffic slowed to almost +3% for the month of September. With weak economic performance and continued uncertainty threatening the two regions, Europe and North America saw declines of -3.8% and -1% respectively in domestic passenger traffic. Major airports in the two regions such as Madrid (MAD), Dallas (DFW) and Las Vegas (LAS) saw declines of -9.5%, -3.9% and - 3% respectively. On the other hand, major airports in emerging markets continue to counterbalance the slowdown from other regions with sustained demand for air transport. Istanbul (IST), Dubai (DXB), Jakarta (CGK) and Beijing (PEK) posted growth of +19.7%, +12.8%, +6.5% and +4.1% respectively. While global freight traffic posted modest year-over-year growth for the month of September at +1.6%, the results across regions are mixed. Africa (-4.8%), Europe (- 1.5%) and North America (-1.5%) all experienced declines whereas the Middle East (+6%), Asia-Pacific (+5.3%) and Latin America-Caribbean (+4.4%) achieved more robust growth figures. Of the thirty leading global freight airports in terms of traffic weighting, thirteen of them observed year-over year declines. Albeit, the top three global freight hubs of Hong Kong (HKG), Shanghai (PVG) and Memphis (MEM) all posted positive growth of +6.8%, +2.2% and +1.9% respectively. ACI World s Economics Director Rafael Echevarne commented, On the whole, when we look at the last three quarters of, passenger markets have remained relatively healthy despite the on-going risks and slowdown in the global economy. From January to September, overall year-over-year growth for the period was a reassuring +4.5%. Conversely, freight traffic continues to give a mixed picture from month to month. With an overall deterioration in international trade in, it no surprise to see freight traffic in a sluggish state declining by -0.7% for the same period. 1
2 TABLE 1: SUMMARY WORLDWIDE TRAFFIC RESULTS, September (% CHANGE) September Over September 2011 PaxFlash Year to date 12-month rolling year International passenger Domestic passenger Total passenger FreightFlash International freight 2.0 (1.0) (1.1) Domestic freight Total freight 1.6 (0.7) (1.0) Notes for editors Airports Council International (ACI), the only worldwide association of airports, has 580 member airport authorities, which operate over 1,650 airports in 179 countries. ACI s mission is to promote professional excellence in airport management and operations, and this mandate is carried out through the organization s multiple training opportunities, as well as the customer service benchmarking programme, a wide range of conferences, industry statistical products and best practice publications. 2. PaxFlash and FreightFlash statistics are based on a significant sample of airports that provide regular monthly reports to ACI. They represent approximately 60% of total passenger traffic and 70% of total freight traffic worldwide. Commentary, tables and charts are based on preliminary data submitted by participating airports and are therefore subject to change. 3. Regional results and trend graphics are provided on the following pages. 4. For further information, contact Cheryl Marcell CMarcell@aci.aero ACI PaxFlash and FreightFlash September 2
3 Regions TABLE 2: PaxFlash Summary September (000s) International Passengers YTD (000s) YE thru (000s) AFR ASP EUR LAC MEA NAM ACI TOTAL Domestic Passengers AFR (2.2) (0.3) (1.3) ASP EUR (3.8) (0.8) LAC MEA NAM (1.0) ACI TOTAL Total Passengers AFR ASP EUR LAC MEA NAM (0.2) ACI TOTAL Traffic table definitions: PASSENGER TRAFFIC: departing + arriving passengers (000s) INTERNATIONAL: traffic performed between the designated airport and an airport in another country/territory DOMESTIC: traffic performed between two airports located in the same country/territory TOTAL: international + domestic passengers + direct transit passengers counted once (when breakdown is available) Regional summaries and totals are calculated from a representative sample. The values in 000s do not represent the entire global coverage of airports. YOY YTD YE Year over year same month comparison Year to date, starting January, compared to same period previous year Year end, based on rolling 12 month period, compared to same prior 12 month period AFR Africa EUR Europe MEA Middle East ASP Asia Pacific (including LAC Latin America and NAM North America India) Caribbean ACI PaxFlash and FreightFlash September 3


4 PASSENGER TRAFFIC CHARTS YOY, YTD, YE comparisons summary ACI PaxFlash and FreightFlash September 4

5 ACI PaxFlash and FreightFlash September 5
6 Regions TABLE 3: FreightFlash Summary September International Freight YTD YE thru AFR 43.1 (3.7) ASP (0.1) (1.2) EUR (1.4) (3.7) (2.9) LAC* MEA NAM (0.2) (1.3) (1.4) ACI TOTAL (1.0) (1.1) Domestic Freight AFR 2.8 (20.6) 28.1 (1.5) ASP EUR 58.1 (5.0) (1.9) (1.1) LAC* MEA NAM (2.0) (0.6) (1.3) ACI TOTAL Total Freight AFR 49.6 (4.8) ASP (0.3) EUR (1.5) (3.4) (3.4) LAC* MEA NAM (1.5) (1.0) (1.4) ACI TOTAL (0.7) (1.0) Traffic table definitions: FREIGHT TRAFFIC: loaded and unloaded freight; data in metric tonnes INTERNATIONAL: traffic performed between the designated airport and an airport in another country/territory DOMESTIC: traffic performed between two airports located in the same country/territory TOTAL: international + domestic freight (when breakdown is available) Note: No domestic freight traffic is reported by airports in the Middle East region. *Data estimated for Brazilian airports Regional summaries and totals are calculated from a representative sample. The values in 000s do not represent the entire global coverage of airports. YOY YTD YE Year over year same month comparison Year to date, starting January, compared to same period previous year Year end, based on rolling 12 month period, compared to same prior 12 month period AFR Africa EUR Europe MEA Middle East ASP Asia Pacific (including LAC Latin America and NAM North America India) Caribbean ACI PaxFlash and FreightFlash September 6


7 Freight Traffic Trend Charts YOY, YTD, YE comparisons summary ACI PaxFlash and FreightFlash September 7


8 - ENDS - ACI PaxFlash and FreightFlash September 8
Passenger Traffic Expands by 4% for the Month of June
 Passenger Traffic Expands by 4% for the Month of June Montréal, 6 August Passenger traffic continued along its growth path for the month of June. In the first half of, the number of passengers passing
Passenger traffic slows to 2.3% growth in October as air freight stagnates
 Passenger traffic slows to 2.3% growth in October as air freight stagnates Montréal, 11 December Global passenger traffic showed only modest gains for the month of October. While emerging markets in Asia-Pacific,
Passenger Traffic Achieves Strong Growth of 4.8% for the Month of August
 Passenger Traffic Achieves Strong Growth of 4.8% for the Month of August Montréal, 7 October Passenger traffic experienced a slight surge in growth to almost +5% for August compared to previous months
Passenger Traffic Posts Solid Gains as Air Freight is Revived in October
 Passenger Traffic Posts Solid Gains as Air Freight is Revived in October Montréal, 9 December 2013 Airports Council International announced traffic results showing that global passenger traffic continued
Passenger traffic ends the year strong as air freight shows signs of a revival
 Passenger traffic ends the year strong as air freight shows signs of a revival Montréal, 11 February 2014 Global passenger traffic ended the year strong with yearover-year growth of over 6% for the month
Passenger Traffic Grows by 4.1% for the Month of September
 Passenger Traffic Grows by 4.1% for the Month of September Montréal, 11 November 2013 The world s airports reported an overall year-over-year gain of 4.1% in passenger traffic for the month of September.
Global passenger traffic jumps up by 6%; air freight volumes on pace with overall growth trend for October
 Global passenger traffic jumps up by 6%; air freight volumes on pace with overall growth trend for October Montréal, 11 December 2014 For the period of January to October 2014, accumulated passenger traffic
Passenger traffic grows by 6% in October 2015; air freight volumes up marginally by 0.3%
 Passenger traffic grows by 6% in October 2015; air freight volumes up marginally by 0.3% Montréal, 11 December 2015 Passenger demand continued its positive trend in October 2015 with the world s airports
Robust passenger traffic gains amidst economic and political uncertainty; air freight volumes surged over 8.0% in November Montréal, 19 January 2017
 Robust passenger traffic gains amidst economic and political uncertainty; air freight volumes surged over 8.0% in November Montréal, 19 January 2017 For the 11 months through November 2016, global passenger
Robust passenger traffic growth; freight volumes reach 3-month peak with double-digit growth
 Robust passenger traffic growth; freight volumes reach 3-month peak with double-digit growth Montréal, 27 October Global passenger traffic increased 6.7% in August and 6.8% year to date. Global freight
Moderate growth for passenger traffic in April; air freight volumes inch up slightly
 Moderate growth for passenger traffic in April; air freight volumes inch up slightly Montréal, 15 June 2016 According to the latest statistics from Airports Council International, global airport passenger
Preliminary data reveals global passenger traffic up by over 5% in 2014; air freight volumes rise in tandem after three years of stagnating growth
 Preliminary data reveals global passenger traffic up by over 5% in 2014; air freight volumes rise in tandem after three years of stagnating growth Montréal, 11 February 2015 Global passenger traffic ended
Passenger traffic growth rate slowed to 3.6% in August; air freight volumes increased by 4.8%
 Passenger traffic growth rate slowed to 3.6% in August; air freight volumes increased by 4.8% Montréal, 24 October Global airport passenger traffic lost momentum from a growth rate of 5.4% in July to 3.6%
Air transport demand shows continued resilience despite geopolitical pressure as passenger and freight traffic grow
 Air transport demand shows continued resilience despite geopolitical pressure as passenger and freight traffic grow Montreal, 7 August 2018 Airports Council International (ACI) World reported global passenger
Airport passenger traffic reaches new heights in 2017; air freight posts heftiest gain since the recovery following the Great Recession
 Airport passenger traffic reaches new heights in 2017; air freight posts heftiest gain since the recovery following the Great Recession Montreal, 28 February 2018 Airports Council International (ACI) World
Preliminary World Airport Traffic 2011 Passenger traffic up 4.9%; Cargo flat -0.1%
 Preliminary World Airport Traffic 2011 Passenger traffic up 4.9%; Cargo flat -0.1% Montreal, 27 March 2012 ACI preliminary traffic results, based on reports from over 900 airports worldwide, indicate that
Preliminary World Airport Traffic 2010 Passenger traffic up 6.3%; Cargo up 15.2%
 Preliminary World Airport Traffic 21 Passenger traffic up 6.3%; Cargo up 1.2% Montreal, 1 March 211 ACI preliminary traffic results, based on reports from over 9 airports worldwide, indicate that global
ACI releases World Airport Traffic Report 2009
 ACI releases World Airport Traffic Report 2009 - Passenger traffic growth down 2 percent; hard hit cargo down by 8 percent - Geneva, 5 August 2010 Director General of ACI World, Angela Gittens announced
Preliminary World Airport Traffic 2008 Passenger traffic growth flat; Cargo down by 3.6 percent
 Preliminary World Airport Traffic 2008 Passenger traffic growth flat; Cargo down by 3.6 Geneva, 17 March 2009 Strong traffic results early in 2008 helped save the overall averages for the year, as seen
AirportInfo. Economic Indicators & Traffic
 AirportInfo Economic Indicators & Traffic March 2012 U.S. & Canadian GDP Economic Focus 6% 4% US Canada 2% 0% -2% -4% -6% -8% -10% GDP growth improved slightly for both the U.S. and Canada in the third
Airports Council International
 Airports Council International HOW SECURITY CONTRIBUTES TO THE ECONOMIC COMPETITIVENESS OF THE AIR CARGO INDUSTRY 16APRIL 2014 Michael Rossell Director ICAO Relations ACI World 1 Mission ACI promotes the
ACI PaxFlash and FreightFlash June
 REVISED: Passenger traffic reported solid gains amidst global economic and political uncertainties; growth in air freight volumes remained sluggish for the first half of 2016 Please note a media release
Preliminary World Airport Traffic 2009
 Preliminary World Airport Traffic 2009 Passenger traffic down by 2.7%; cargo down by 8.2 % Geneva, 17 March 2010 ACI reports preliminary results of a 2.7 decline in global passenger traffic for 2009, reflecting
AirportInfo. ACI-NA 2011 Traffic Report
 AirportInfo ACI-NA 2011 Traffic Report July 2012 2011 ACI World Airport Traffic Summary North America 2011 % Change 2010 Worldwide 2011 % Change 2010 Total Passengers 1.5B Up 1.8% 5.1B Up 5.2% Total International
Airport Characteristics: Part 2 Prof. Amedeo Odoni
 Airport Characteristics: Part 2 Prof. Amedeo Odoni Istanbul Technical University Air Transportation Management M.Sc. Program Air Transportation Systems and Infrastructure Module 4 May 25, 2015 Outline
Industry Update ACI-NA Board of Directors Meeting
 Industry Update ACI-NA Board of Directors Meeting September 16, 2017 Fort Worth, TX Economic Indicator Review The near term (6 12 months) economic prospects are generally positive and steady for the North
Industry Update. ACI-NA Winter Board of Directors Meeting February 3, 2016 Orlando, FL
 Industry Update ACI-NA Winter Board of Directors Meeting February 3, 2016 Orlando, FL U.S. & Canadian GDP 8% 6% 4% U.S.* Canada** Estimate by BEA as of 02/11/16 2% 0% -2% -4% -6% -8% -10% The U.S. economy
Why do we need well performing airports?
 Why do we need well performing airports? Emmanuelle Maire Head of Internal Market and Airports Unit Dg MOVE - European Commission Braunschweig, 15 October 2013 1 Presentation outline The European Union
AIR PASSENGER MARKET ANALYSIS
 Monthly RPK (Billions) Monthly FTK (Billions) Index of business confidence % change over year AIR PASSENGER MARKET ANALYSIS NOVEMBER 2013 KEY POINTS Air travel markets increased at a solid rate in November,
July 2017 Travel Briefing: Air Passenger Traffic Hotel Occupancy Tax-Free Shopping
 July 2017 Travel Briefing: Air Passenger Traffic Hotel Occupancy Tax-Free Shopping Key Trends in Air Passenger Traffic, Hotel Occupancy and Tax-Free Shopping in July 2017 Growth in international air passenger
Growing Size and Complexity Prof. Amedeo Odoni
 Growing Size and Complexity Prof. Amedeo Odoni Istanbul Technical University Air Transportation Management M.Sc. Program Airport Planning and Management Module 3 January 2016 Growing Size and Complexity
Index of business confidence. Monthly FTK (Billions) Apr 2014 vs. Apr 2013 YTD 2014 vs. YTD 2013 Apr 2014 vs. Mar 2014
 Apr 2014 vs. Apr 2013 YTD 2014 vs. YTD 2013 Apr 2014 vs. Mar 2014") AIR PASSENGER MARKET ANALYSIS APRIL 2014 KEY POINTS Growth in air travel picked-up in April, rising 7.5% compared to a year ago. This is an acceleration on March, when revenue passenger kilometers increased
AIR PASSENGER MARKET ANALYSIS APRIL 2014 KEY POINTS Growth in air travel picked-up in April, rising 7.5% compared to a year ago. This is an acceleration on March, when revenue passenger kilometers increased
AIR PASSENGER MARKET ANALYSIS SEPTEMBER 2015 KEY POINTS
 AIR PASSENGER MARKET ANALYSIS SEPTEMBER 2015 KEY POINTS Global air travel rose 7.3% in September compared to a year ago. The mid-year data showed some distortion from holiday impacts, but the last couple
AIR PASSENGER MARKET ANALYSIS
 Monthly RPK (Billions) Monthly FTK (Billions) Index of business confidence % change over year AIR PASSENGER MARKET ANALYSIS APRIL 2013 KEY POINTS Global revenue passenger kilometers were up 3.2% in April
Index of business confidence. Monthly FTK (Billions) Sep 2013 vs. Sep 2012 YTD 2013 vs. YTD 2012 Sep 2013 vs. Aug 2013
 Sep 2013 vs. Sep 2012 YTD 2013 vs. YTD 2012 Sep 2013 vs. Aug 2013") AIR PASSENGER MARKET ANALYSIS SEPTEMBER 2013 KEY POINTS Air travel markets expanded at a solid rate in September. Global revenue passenger kilometers were up 5.5% compared to a year ago. This is a slight
AIR PASSENGER MARKET ANALYSIS SEPTEMBER 2013 KEY POINTS Air travel markets expanded at a solid rate in September. Global revenue passenger kilometers were up 5.5% compared to a year ago. This is a slight
Index of business confidence. Monthly FTK (Billions) May 2014 vs. May 2013 YTD 2014 vs. YTD 2013 May 2014 vs. Apr 2014
 May 2014 vs. May 2013 YTD 2014 vs. YTD 2013 May 2014 vs. Apr 2014") AIR PASSENGER MARKET ANALYSIS MAY 2014 KEY POINTS Air travel markets rose by a strong 6.2% in May compared to a year ago. Although this is slightly down on April growth of 7.6%, April was positively biased
AIR PASSENGER MARKET ANALYSIS MAY 2014 KEY POINTS Air travel markets rose by a strong 6.2% in May compared to a year ago. Although this is slightly down on April growth of 7.6%, April was positively biased
Index of business confidence. Monthly FTK (Billions) Aug 2013 vs. Aug 2012 YTD 2013 vs. YTD 2012 Aug 2013 vs. Jul 2013
 Aug 2013 vs. Aug 2012 YTD 2013 vs. YTD 2012 Aug 2013 vs. Jul 2013") AIR PASSENGER MARKET ANALYSIS AUGUST 2013 KEY POINTS Air travel markets expanded strongly in August. Global revenue passenger kilometers were up 6.8% compared to a year ago, an improvement on July growth
AIR PASSENGER MARKET ANALYSIS AUGUST 2013 KEY POINTS Air travel markets expanded strongly in August. Global revenue passenger kilometers were up 6.8% compared to a year ago, an improvement on July growth
AIR TRANSPORT MARKET ANALYSIS APRIL 2011
 AIR TRANSPORT MARKET ANALYSIS APRIL 2011 KEY POINTS From this month we provide an assessment of global scheduled air transport markets, adding domestic to international, and including both IATA and non-iata
Index of business confidence. Monthly FTK (Billions) June 2012 vs. June 2011 YTD 2012 vs. YTD 2011 RPK ASK PLF FTK AFTK FLF RPK ASK PLF FTK AFTK FLF
 June 2012 vs. June 2011 YTD 2012 vs. YTD 2011 RPK ASK PLF FTK AFTK FLF RPK ASK PLF FTK AFTK FLF") Monthly RPK (Billions) Monthly FTK (Billions) Index of business confidence % change over year AIR TRANSPORT MARKET ANALYSIS JUNE 2012 KEY POINTS Air travel markets expanded in June, but the trend in passenger
Monthly RPK (Billions) Monthly FTK (Billions) Index of business confidence % change over year AIR TRANSPORT MARKET ANALYSIS JUNE 2012 KEY POINTS Air travel markets expanded in June, but the trend in passenger
AIR PASSENGER MARKET ANALYSIS MARCH 2015 KEY POINTS
 AIR PASSENGER MARKET ANALYSIS MARCH 2015 KEY POINTS Global air travel rose by a strong 7.4% in March compared to a year ago, an improvement on the February result of 6.4%. The acceleration in the year-on-year
State of Global Air Transport and ICAO Forecasts for Effective Planning. Economic Development Air Transport Bureau ICAO
 State of Global Air Transport and ICAO Forecasts for Effective Planning Economic Development Air Transport Bureau ICAO State of Air Transport Industry in 2016 Growth of air transport Revenue Passenger-Kilometres
Global Airline Capacity Winter 2013/14 Boeing Commercial Airplanes
 Global Airline Capacity Winter 2013/14 Boeing Commercial Airplanes Istanbul Technical University Air Transportation Management M.Sc. Program BOEING is a trademark of Boeing Management Company. Network,
AIR TRANSPORT MARKET ANALYSIS MAY 2011
 AIR TRANSPORT MARKET ANALYSIS MAY 2011 KEY POINTS May saw a renewed expansion in both air travel and freight, after a soft patch during the previous three months. Air travel volumes were 6.8% higher than
AIR PASSENGER MARKET ANALYSIS
 AIR PASSENGER MARKET ANALYSIS OCTOBER 2014 KEY POINTS Air travel volumes were up 5.7% in October year-on-year, slightly stronger than the September rise of 5.2%, and a continuation of the positive growth
Selected highlights: The burgeoning Pacific market
 ACI releases preliminary world airport traffic rankings Robust gains in passenger traffic at hub airports serving trans-pacific and East Asian routes Montreal, 19 April 2017 Traffic at the world s 20 busiest
AIR TRANSPORT MARKET ANALYSIS JULY 2011
 AIR TRANSPORT MARKET ANALYSIS JULY 2011 KEY POINTS Despite an increasingly gloomy economic outlook, air travel continued to expand at a pace close to trend in July, to a level 5.9% higher than a year earlier.
AIR PASSENGER MARKET ANALYSIS
 Monthly RPK (Billions) Monthly FTK (Billions) Index of business confidence % change over year AIR PASSENGER MARKET ANALYSIS JANUARY 2014 KEY POINTS Air travel markets commenced 2014 with a strong increase
World Airport Traffic Forecast
 World Airport Traffic Forecast ACI-World Bank Annual Aviation Symposium 9 th April 2018 Aram Karagueuzian Manager, Airport Traffic Statistics and Forecasts, ACI World Outline World Airport Traffic Forecast
AIR PASSENGER MARKET ANALYSIS JUNE 2015 KEY POINTS
 AIR PASSENGER MARKET ANALYSIS JUNE 2015 KEY POINTS Global air travel rose 5.7% in June compared to a year ago, a slowdown on the strong May increase of 6.9%. The deceleration is due to slower growth in
Liberalization of Air Cargo Market
 Liberalization of Air Cargo Market Anming Zhang Sauder School of Business University of British Columbia May 8, 2014 @ ICAO Montreal 1 Multilateral / WTO approach to liberalization Annex on Air Transport
State of the Aviation Industry The North American Airport Perspective Marketing and Communications Conference
 State of the Aviation Industry The North American Airport Perspective Marketing and Communications Conference June 22, 2011 Cleveland, OH Greg Principato, President ACI-NA Millions 2 U.S. Aviation Traffic:
August 2016 Travel Briefing: Air Passenger Traffic Hotel Occupancy
 August 2016 Travel Briefing: Air Passenger Traffic Hotel Occupancy Key Trends in Air Passenger Traffic and Hotel Occupancy in August 2016: The growth in international air passenger traffic slowed as a
CONCESSIONS FUTURE OPPORTUNITIES
 CONCESSIONS FUTURE OPPORTUNITIES MARCH 14 & 15, 2019 COLORADO S STRONG ECONOMY 2 ABOVE AVERAGE GROWTH 3 19 FORTUNE 1000 COMPANIES Fortune 1000 Companies & Major Relocations and Expansions into Metropolitan
AIR PASSENGER MARKET ANALYSIS JULY 2015 KEY POINTS
 AIR PASSENGER MARKET ANALYSIS JULY 2015 KEY POINTS Global air travel rose 8.2% in July compared to a year ago, partly reflecting an upward bias due to the timing of Ramadan. But even after controlling
HUBS, COMPETITION AND GOVERNMENT POLICY
 HUBS, COMPETITION AND GOVERNMENT POLICY Airports Canada Aeroports 2011 Ottawa April 20, 2011 Fred Lazar (flazar@yorku.ca) Schulich School of Business York University Toronto, Canada Airports, Airlines
ACI 2008 WORLDWIDE AIRPORT TRAFFIC STATISTICS
 WORLD AIRPORT RANKING BY TOTAL PASSENGERS TOTAL PASSENGERS 1 ATLANTA GA ATL 90 039 280 0.7 2 CHICAGO IL ORD 69 353 876 ( 9.0) 3 LONDON LHR 67 056 379 ( 1.5) 4 TOKYO HND 66 754 829 ( 0.2) 5 PARIS CDG 60
AIR PASSENGER MARKET ANALYSIS MAY 2015 KEY POINTS
 AIR PASSENGER MARKET ANALYSIS MAY 2015 KEY POINTS Global air travel rose by a strong 6.9% in May compared to a year ago. This was an acceleration on April year-overyear growth of 5.7%. Air travel was strong
Download the preliminary traffic results for the top 20 busiest airports (total passenger traffic).
.") ACI World releases preliminary 2017 world airport traffic rankings Passenger traffic: Indian and Chinese airports major contributors to growth Air cargo: Volumes surge at major hubs as trade wars threaten
ACI World releases preliminary 2017 world airport traffic rankings Passenger traffic: Indian and Chinese airports major contributors to growth Air cargo: Volumes surge at major hubs as trade wars threaten
PREMIUM TRAFFIC MONITOR MARCH 2009
 PREMIUM TRAFFIC MONITOR MARCH 2009 KEY POINTS The fall in passenger numbers slowed in March, to a decline of 9.3% following February s 9.6% fall. However, this slowdown was entirely due to February s fall
AERO CLUB OF WASHINGTON U.S. AVIATION POLICY: OLD SCHOOL INSTEAD OF NEW NORMAL MAY 20, 2013 ANGELA GITTENS DIRECTOR GENERAL, ACI WORLD
 AERO CLUB OF WASHINGTON U.S. AVIATION POLICY: OLD SCHOOL INSTEAD OF NEW NORMAL MAY 20, 2013 ANGELA GITTENS DIRECTOR GENERAL, ACI WORLD Thank you for that kind introduction. I want to take a few minutes
Megahubs International Index
 Published: Sep 2017 2017 Megahubs International Index The World s Most Internationally Connected Airports 2017 OAG Aviation Worldwide Limited. All rights reserved OAG Megahubs International Index 2017
INTERNATIONAL AIR TRAFFIC STATISTICS
 --PASSENGERS (IN MILLION)-- --PASSENGERS (IN MILLION)-- INTERNATIONAL AIR TRAFFIC STATISTICS April-June, 2017* There are 96 scheduled international carriers- 5 Indian carriers and 91 foreign carriers.
turnaround tables Arriving and Departing OTP Variances for the World s Largest Airports Based on full year data 2017
 2018 turnaround tables Arriving and Departing OTP Variances for the World s Largest Airports Based on full year data 2017 2018 OAG Aviation Worldwide Limited. All rights reserved Published: March 2018
PREMIUM TRAFFIC MONITOR SEPTEMBER 2013 KEY POINTS
 Premium Pax, Million Economy Pax, Million PREMIUM TRAFFIC MONITOR SEPTEMBER 13 KEY POINTS Growth in premium air travel moderated in September, after a strong rise in August. International premium passenger
NBAA 2014 Business Aviation Market Update. October 2014
 NBAA 2014 Business Aviation Market Update October 2014 1 Jefferies Global Industrials Conference - August 14, 2014 Forward Looking Statements This report contains forward-looking statements within the
ANALYST BRIEFING FINANCIAL RESULTS FOR THE QUARTER ENDED 31 ST MARCH 2012
 Malaysia Airports Holdings Berhad ANALYST BRIEFING FINANCIAL RESULTS FOR THE QUARTER ENDED 31 ST MARCH 2012 Faizal Mansor Chief Financial Officer, MAHB 26 April 2012 1 2 Table of Contents 1Q12 Review Group
PREMIUM TRAFFIC MONITOR DECEMBER 2014 KEY POINTS
 PREMIUM TRAFFIC MONITOR DECEMBER 2014 KEY POINTS International air travel recorded another moderate rise to end 2014, up 3.6% in December compared to a year ago. The annual expansion was in line with the
AIR PASSENGER MARKET ANALYSIS JANUARY 2015 KEY POINTS
 AIR PASSENGER MARKET ANALYSIS JANUARY 2015 KEY POINTS Global air travel was up 4.6% in January compared to a year ago, a slower start to the year when compared to the strong 5.8% expansion in 2014 overall.
INTERNATIONAL AIR TRAFFIC STATISTICS
 --PASSENGERS (IN MILLION)-- --PASSENGERS (IN MILLION)-- INTERNATIONAL AIR TRAFFIC STATISTICS APRIL-JUNE, 2016 * There are 88 scheduled international carriers - 5 Indian carriers and 83 Foreign carriers.
Monthly Traffic Results Frankfurt Airport
 with 9M-Report 1 January 2 February 3 March 4 April 5 May 6 June 7 July 8 August 9 September 10 October 11 November 12 December Traffic category Passengers (arr.+dep.+transit) Airfreight (metric tons)
Tourism Snapshot A focus on the markets that the CTC and its partners are active in Ontario June 2011 Volume 7, Issue 6
 Tourism Snapshot Ontario A focus on the markets that the CTC and its partners are active in www.canada.travel/corporate June 2011 Volume 7, Issue 6 Key highlights In June 2011, overnight travel to Canada
Dubai Airshow 2013 Business Aviation Market Update
 Dubai Airshow 2013 Business Aviation Market Update Rob Wilson, President, Business & General Aviation MEBAA General Assembly November, 2013 2013 Business Aviation Outlook 27th year of survey, 22nd public
INTERNATIONAL AIR TRAFFIC STATISTICS
 --PASSENGERS (IN MILLION)-- --PASSENGERS (IN MILLION)-- INTERNATIONAL AIR TRAFFIC STATISTICS October-December, 2016 * There are 92 scheduled international carriers - 5 Indian carriers and 87 Foreign carriers.
July 2012 Passenger and Cargo Traffic Statistics Reno-Tahoe International Airport
 July 2012 Passenger and Cargo Traffic Statistics Reno-Tahoe International Airport August 31, 2012 U.S. DOMESTIC INDUSTRY OVERVIEW FOR JULY 2012 All RNO Carriers Systemwide year over year comparison Average
The Need and Urgency for a Three-Runway System (3RS) August 7, 2014
 August 7, 2014") The Need and Urgency for a Three-Runway System (3RS) August 7, 2014 1 1 Need for 3RS? 2 Recent criticism HKIA is being managed inefficiently AA allows the proliferation of narrow-bodied aircraft and small
The Need and Urgency for a Three-Runway System (3RS) August 7, 2014 1 1 Need for 3RS? 2 Recent criticism HKIA is being managed inefficiently AA allows the proliferation of narrow-bodied aircraft and small
PREMIUM TRAFFIC MONITOR AUGUST 2015 KEY POINTS
 PREMIUM TRAFFIC MONITOR AUGUST 2015 KEY POINTS Passenger travel on international markets was up 5.4% in August year-on-year, reflecting strong growth on the Within Europe travel market. Both travel classes
December 2011 Passenger and Cargo Traffic Statistics Reno-Tahoe International Airport
 December 2011 Passenger and Cargo Traffic Statistics Reno-Tahoe International Airport January 27, 2012 U.S. DOMESTIC INDUSTRY OVERVIEW FOR DECEMBER 2011 All RNO Carriers Systemwide year over year comparison
TOD S S.p.A. Group s sales totaled million Euros in the first half of 2016.
 Sant Elpidio a Mare July 21 st, 2016 TOD S S.p.A. Group s sales totaled 497.6 million Euros in the first half of 2016. The Board of Directors approved Tod s Group 2016 Half-Year Preliminary Sales figures
December 2013 Passenger and Cargo Traffic Statistics Reno-Tahoe International Airport
 December 2013 Passenger and Cargo Traffic Statistics Reno-Tahoe International Airport January 24, 2014 U.S. DOMESTIC INDUSTRY OVERVIEW FOR DECEMBER 2013 All RNO Carriers Domestic Systemwide year over year
Asia-Pacific Aviation: Growth and Challenges
 Asia-Pacific Aviation: Growth and Challenges A presentation to the ACI-NA International Aviation Issues Seminar Steve Martin Page 1 Page 2 Defining the Asia Pacific We ll call it GMT +5 GMT +12, minus
Global Airline Trends and Impacts International Aviation Issues Seminar
 Global Airline Trends and Impacts International Aviation Issues Seminar December 2017, Washington D.C. Oliver Lamb Managing Director 1 Around the world in 45 minutes Financial Performance Canada Mexico
Summary. Air transport movements. Passengers. Freight. Other Airports. Infrastructure. Definitions. Traffic Review 2016
 2016 TRAFFIC REVIEW Foreword The 2016 Traffic Review provides an extensive overview of Amsterdam Airport Schiphol s key traffic and transport figures. For information about previous years, please visit
PREMIUM TRAFFIC MONITOR JANUARY 2014 KEY POINTS
 Premium Pax, Million Economy Pax, Million PREMIUM TRAFFIC MONITOR JANUARY 14 KEY POINTS The number of passengers traveling in premium seats on international markets expanded by a solid 6.1% in January
PREMIUM TRAFFIC MONITOR APRIL 2015 KEY POINTS
 PREMIUM TRAFFIC MONITOR APRIL 2015 KEY POINTS Passenger travel on international markets rose 3.8% in April compared to a year ago, slower than the 4.6% result in March. The growth trend for international
September Air Traffic Statistics. Prepared by the Office of Marketing & Consumer Strategy
 September 2018 Air Traffic Statistics Prepared by the Office of Marketing & Consumer Strategy This report includes only data submitted by airlines as of the date of publication: November 14, 2017. Reports
Presentation on APEC s Ease of Doing Business Interim Assessment
 2013/SOM1/EC/013anx Agenda Item: 6 Presentation on APEC s Ease of Doing Business Interim Assessment 2009-2012 Purpose: Information Submitted by: Policy Support Unit, APEC Secretariat First Economic Committee
PREMIUM TRAFFIC MONITOR FEBRUARY 2015 KEY POINTS
 PREMIUM TRAFFIC MONITOR FEBRUARY 2015 KEY POINTS Passenger travel on international markets rose 4.6% in February compared to a year ago, up on the 3.7% result in January; Economy class travel drove the
Rankings of Major U.S. Airports. Total Passengers 2016
 Rankings of Major U.S. Airports Total Passengers Total Passengers (Millions) 1 Hartsfield Atlanta Int'l (ATL) Atlanta 104.2 2.6 2 Los Angeles Int'l (LAX) Los Angeles 80.9 8.0 3 O'Hare Int'l (ORD) Chicago
December Air Traffic Statistics. Prepared by the Office of Marketing & Consumer Strategy
 December 217 Air Traffic Statistics Prepared by the Office of Marketing & Consumer Strategy 1 This report includes only data submitted by airlines as of the date of publication: February 2, 217. Reports
October 2013 Passenger and Cargo Traffic Statistics Reno-Tahoe International Airport
 October 2013 Passenger and Cargo Traffic Statistics Reno-Tahoe International Airport December 4, 2013 U.S. DOMESTIC INDUSTRY OVERVIEW FOR OCTOBER 2013 All RNO Carriers Systemwide year over year comparison
November 2013 Passenger and Cargo Traffic Statistics Reno-Tahoe International Airport
 November 2013 Passenger and Cargo Traffic Statistics Reno-Tahoe International Airport December 26, 2013 U.S. DOMESTIC INDUSTRY OVERVIEW FOR NOVEMBER 2013 All RNO Carriers Domestic Systemwide year over
SETTING THE SCENE An Overview of State of Air Transport and Regulatory Developments
 1 SETTING THE SCENE An Overview of State of Air Transport and Regulatory Developments Boubacar Djibo Director of the Air Transport Bureau ICAN 2014 Bali, Indonesia, 17 November 2014 2 CHICAGO CONVENTION
Tourism Towards 2030 Preview of findings
 Tourism Towards 23 Preview of findings 54th meeting of the UNWTO Commission for the Americas 11 September 212 Quito, Ecuador Carlos Vogeler Regional Director for the Americas World Tourism Organization
NBAA 2015 MARKET UPDATE
 NBAA 2015 MARKET UPDATE November 2015 Forward-Looking Statements 2 This report contains forward-looking statements within the meaning of Section 21E of the Securities Exchange Act of 1934. All statements,
Rankings of Major U.S. Airports. Total Passengers 2017
 Rankings of Major U.S. Airports Total Passengers Total Passengers (Millions) 1 Hartsfield Atlanta Int'l (ATL) Atlanta 103.9-0.3 2 Los Angeles Int'l (LAX) Los Angeles 84.6 4.5 3 O'Hare Int'l (ORD) Chicago
PREMIUM TRAFFIC MONITOR JULY 2012
 Premium Pax, Million Economy Pax, Million PREMIUM TRAFFIC MONITOR JULY 212 KEY POINTS The second half of 212 began with further signs of weakness in air travel markets. The number of passengers buying
Airline Current Business Environment Alex Heiter
 Airline Current Business Environment Alex Heiter Istanbul Technical University Air Transportation Management M.Sc. Program Network, Fleet and Schedule Strategic Planning Module 2: 28 March 2016 The underlying
Tourism Snapshot. A focus on the markets in which the CTC and its partners are active. October 2012 Volume 8, Issue 10.
 Tourism Snapshot Niagara Helicopters Tour A focus on the markets in which the CTC and its partners are active www.canada.travel/corporate October 2012 Volume 8, Issue 10 Total arrivals from CTC s international
PREMIUM TRAFFIC MONITOR JANUARY 2013 KEY POINTS
 Premium Pax, Million Economy Pax, Million PREMIUM TRAFFIC MONITOR JANUARY 213 KEY POINTS Growth in premium travel slowed in January. The number of passengers traveling in premium seats on international
Monthly Traffic Results Frankfurt Airport. February January to February absolute Δ% absolute Δ% February
 1 January 2 February 3 March 4 April 5 May 6 June 7 July 8 August 9 September 10 October 11 November 12 December Traffic category Passengers (arr.+dep.+transit) Airfreight (metric tons) (arr.+dep.+tr.)