Master Plan Update. Palm Beach County Park Airport. Master Plan Update. Ricondo & Associates, Inc.
|
|
|
- Rodney Rose
- 6 years ago
- Views:
Transcription


1 Master Plan Update Palm Beach County Park Airport Master Plan Update Prepared for Palm Beach County Department of Airports TB WPB October 31, 2006 Prepared by In association Ricondo & Associates, Inc. Copyright 2006 by CH2M HILL, Inc. Reproduction and distribution in whole or in part beyond the intended scope of the contract without the written consent of CH2M HILL, Inc. is prohibited.
2 Contents Executive Summary Technical Report No. 1 Palm Beach County Park Airport Inventory 2 Palm Beach County Park Airport Demand/Capacity and Facility Requirements 3 Palm Beach County Park Airport Environmental Overview 4 Palm Beach County Park Airport Development Alternatives 5 Palm Beach County Airports Financial Planning 6 Palm Beach County Park Airport Airport Layout Plan LNACONTENTS-DIVIDER.DOC II
3 Master Plan Update As defined by the Federal Aviation Administration (FAA) in Advisory Circular (AC) 150/5070-6B, Airport Master Plans, a master plan is defined as a concept for potential longterm development of an airport. It entails a series of planning steps that analyze how expected future aviation demand can best be accommodated, including a graphical representation of the findings. The goal of a master plan is to provide solutions that will satisfy the expected future needs of an airport in a financially feasible manner, while accounting for the surrounding community, local environment, and socioeconomic factors. Additionally, because future travel demand will change over time, a master plan must allow the airport flexibility to implement different projects to meet actual demand. Airport planning begins with a careful assessment of existing facilities and current airport use, and projections of aviation demand over a specific timeframe, also known as the planning period. The planning period here is the 20-year period The recommendations provided in a master plan are technically sound and meet FAA standards, but are only recommendations: implementation of any projects can occur only as warranted by need. The recommendations outlined in the plan are also subject to further FAA review and environmental/feasibility studies before implementation. Palm Beach County System of Airports The PBC Department of Airports (DOA) owns and operates a system of four airports; Palm Beach International Airport (PBI), Palm Beach Park Airport (LNA), Palm Beach County Glades Airport (PHK), and North Palm Beach County General Aviation Airport (F45). PBI is the center for all commercial air carrier service into Palm Beach County, while together, LNA, PHK, and F45 accommodate most of the general aviation demand in the region. Both LNA and F45 are designated as a reliever airport by the FAA. As reliever airports, F45 and LNA relieve congestion at Palm Beach International Airport, by providing an alternate venue for general aviation traffic. The County chose to update all four master plans, rather than only PBI s plan, for the purpose of assuring that the relievers can continue to fulfill their missions of offloading PBI as well as meeting local general aviation (GA) demand. Specific goals and objectives were developed as guidelines in assessing various alternatives for future development for the system of airports. The goals were identified as the following: Accommodate passenger demand while maintaining the highest level of customer service and convenience possible, including an emphasis on low delay and congestion levels. 00_PBCDOA_EXECSUMMS_V3_ADDENDUM_#1_V7_LNA_ONLY.DOC 1
4 EXECUTIVE SUMMARY Refine and validate selected long-term airport improvements that meet forecast airline, corporate, and general aviation system demand, while providing flexibility to respond to actual demand. Develop an enhancement plan that meets FAA standards, is financially sound, environmentally responsible, and consistent with the County s established good neighbor programs. 00_PBCDOA_EXECSUMMS_V3_ADDENDUM_#1_V7_LNA_ONLY.DOC 2
5 EXECUTIVE SUMMARY LNA Executive Summary Palm Beach County Park Airport is located six miles south of West Palm Beach in Lantana, Florida. The airport is designated as a reliever airport by the FAA; however, the airport is restricted and no jets or aircraft over 12,500 pounds are allowed; therefore, F45 is the only reliever airport in the County that can accept overflow jet traffic from PBI. The Palm Beach County Department of Airports updates its development plans on a continuous basis; as such, this Master Plan Update is considered a living document and can/will be modified or updated based on future studies and planning exercises carried out by the County. 1 While Parcel 4 (15-acre parcel) is identified for non-aviation uses, this does not preclude the parcel being developed in part or whole as an aviation use should it be determined at a future date that an aviation use is more beneficial. 1 There is nothing in this master plan document that effects the environmental mitigation credits associated with the enhancement of the adjacent parks project and the transfer of those environmental mitigation credits from the John Prince Park project to the South County Regional Park. 1 Palm Beach County is not requesting or accepting environmental mitigation credits for that portion of the perimeter canal that crosses through the future runway extension study area and believes this portion of the canal functions solely as a drainage conveyance ditch between the western portion of the Parks property and Lake Osborne and not as an environmentally sensitive area that would prevent extension of the runway. 1 Airfield Demand/Capacity Analyses The 2006 Master Plan Update confirmed that LNA s three-runway configuration Runways 15/33, 9/27 and 3/21 are sufficient to meet the projected aviation demand through the year 2025 (Table ES-11). TABLE ES-11 LNA Practical Airfield Capacity Estimates Annual Operations (i.e., demand) 155, , , , ,649 Annual Service Volume (theoretical) 1/ 495, , , , ,445 Annual Operations as a Percent of ASV Annual Service Volume (calibrated) 2/ 447, , , , ,139 Annual Operations as a Percent of ASV Recommendations of the AAAB Addendum #1, March 10, _PBCDOA_EXECSUMMS_V3_ADDENDUM_#1_V7_LNA_ONLY.DOC 3
6 EXECUTIVE SUMMARY Sources: Palm Beach County Park Demand/Capacity and Facility Requirements; Ricondo & Associates, Inc., May 2006 Notes: 1/ Theoretical hourly capacities were obtained from FAA AC 150/5060-5, Airport Capacity and Delay. 2/ In an effort to not overestimate or underestimate the airfield capacity at LNA, the calibration considered a 10 percent adjustment below the theoretical capacity in order to reflect what actual operating conditions could be at LNA. The theoretical weighted average hourly capacity for LNA is calculated at 113 operations, which is reduced by 10 percent to reflect actual operating conditions, such as the lack of an air traffic control tower. Thus, the practical capacity of the three-runway configuration at LNA is estimated at 102 operations (landings and takeoffs) per hour. In order to minimize aircraft delays, FAA recommends that alternatives to increase capacity be considered once the volume of annual operations reaches percent of an airport s computed Annual Service Volume. 2 As indicated in Table ES-11, airfield capacity is not considered a significant issue at any point through the planning horizon (2025). Airport Design Standards For airfield planning purposes, the ARC, along with the approach visibility minimums, directly affect the size of the surfaces associated with each runway, including the Runway Safety Area (RSA), Runway Obstacle Free Zone (OFZ), Runway Object Free Area (OFA), and Runway Protection Zone (RPZ). A look at the standard dimensions revealed that the airport meets all design criteria outlined in FAA AC 150/ Airport Design, with the exception of the hangars on the south side of the airport. These hangars are recommended for demolition or relocation. For planning purposes, LNA has two Airport Reference Codes: Runways 9/27 and 15/33 are designated as B-II runways, which indicates that they are sized to handle aircraft with wingspans up to 79 feet and approach speeds up to 121 knots. Runway 3/21, however, the shortest runway at 3,256 feet long, is classified as a B-I runway, capable of handling aircraft with wingspans up to 49 feet and approach speeds up to 121 knots. Facility Needs The facility needs assessment included consideration of tenant facilities serving based and transient general aviation aircraft. The GA operations forecast, obtained from the FAA Terminal Area Forecast (TAF), serves as the basis for determining facility requirements. In 2005, a total of 155,588 GA operations were conducted at LNA. Annual aircraft operations at the airport are projected to be 219,649 by 2025, representing an average annual growth rate of 1.7 percent. Similarly, the number of based aircraft, which consists mostly of single engine aircraft, is forecast to increase from 386 in 2005 to 527 in Table ES-12 summarizes the projections for GA operations and based aircraft at the airport. Table ES-13 lists the identified facility needs through the planning horizon. 2 FAA Order C, Field Formulation of the National Plan for Integrated Airport Systems, December 4, _PBCDOA_EXECSUMMS_V3_ADDENDUM_#1_V7_LNA_ONLY.DOC 4
7 EXECUTIVE SUMMARY TABLE ES-12 General Aviation Operations and Based Aircraft Forecast Existing (2005) Annual Operations 155, , , , ,649 Based Aircraft Sources: Palm Beach County Park Demand/Capacity and Facility Requirements; Ricondo & Associates, Inc., May 2006 TABLE ES-13 Facility Needs, Near Term and Long Term Facility Existing Near Term (2015) Long Term (2025) Apron, square feet 646, ,350 1,122,000 % increase from existing Hangar, square feet 290, , ,750 % increase from existing Auto Parking, square feet 29,100 44,200 57,800 % increase from existing FBO Terminal and Office Space, square feet 14,000 16,650 19,800 % increase from existing Sources: Palm Beach County Park Demand/Capacity and Facility Requirements; Ricondo & Associates, Inc., May 2006 Proposed Projects After extensive data-gathering, analyses, and coordination with the Department of Airports, the following projects, as shown in Exhibit ES-6, are proposed for implementation at LNA over the planning period: Runway System. Runway 3/21 is currently a nonprecision runway with 20:1 approach slopes, and will remain a nonprecision runway for the 20-year planning period. The runway is considered the noise abatement runway, and to minimize the opportunity for incursions, it will be provided with a parallel taxiway providing access to future hangars northwest of the existing runway. Land Acquisition. Given runway approach protection zone requirements, object clearing criteria, and land use compatibility issues, parcels at each end of Runway 15/33 are recommended for acquisition. Once these parcels are acquired, the existing structures are recommended for demolition to clear them from the Runway Protection Zones (RPZs). Avigation easements will be obtained to control land use and structure 00_PBCDOA_EXECSUMMS_V3_ADDENDUM_#1_V7_LNA_ONLY.DOC 5
8 EXECUTIVE SUMMARY heights within the Runway 3, Runway 33 and Runway 9 RPZs for parcels that will not be acquired in fee simple. Runway Approach Aids and Lighting. Runway End Identifier Lights (REIL) are planned to be installed on Runways 15/33 and 9/27 in the future. An additional nonprecision approach, such as a LNAV/VNAV, is recommended at LNA within the planning period. Taxiway System. Given the poor conditions along Taxiway C, the taxiway pavement will require major rehabilitation in the near future. Terminal Building. A second FBO is likely to start operation at LNA, and included in the plan to meet anticipated demand levels over the planning period. Commercial Development. The DOA currently owns two parcels (15 and 19 acres, respectively) along Congress Avenue near the southwest side of the airport. These parcels have been found by the DOA to not be needed for aeronautical purposes, and the 19 acre parcel is currently being marketed for commercial development and nonaviation related uses. The 15 acre parcel will be marketed for commercial development and non-aviation related uses in the near future. Aircraft Storage Facilities. Many of the conventional aircraft hangars and T-hangars damaged during the hurricane seasons have been or are in the process of being torn down and rebuilt. Furthermore, new corporate hangars and T-hangars are proposed west of Runway 3/21. Long-term facilities, assuming Runway 3/21 may eventually be closed, are to be located toward the central portion of the airfield. Additional vehicle parking and access roads are proposed to serve the future hangar facilities. The western portion of the existing aircraft parking apron has also been reserved for future Convention and T-hangar development. Existing hangars on the southeastern portion of the airport in row 100 currently violate Object Free Area criteria for Runway 15/33 and are recommended for demolition or relocation. Airside Development. Apron expansion and taxilane construction are recommended to accommodate anticipated future growth. Approximately 500,000 square feet of apron expansion and taxilane construction is required to provide sufficient aircraft parking for anticipated growth over the 20-year planning period. Airspace. Approaches to Runway 9/27 are programmed to be upgraded from visual approaches to nonprecision instrument approaches within the 20-year planning period. Following the conclusion of the October 2006 MPU, meetings were held between the DOA and the Aviation and Airports Advisory Board (AAAB) to discuss the results of the master plan. Recommendations resulting from decisions made during those meetings required additions to the MPU. While these specific additions were incorporated into the Executive Summary, not all revisions were carried through the entire MPU and ALP update; therefore, the final date of the documents contained in the October 2006 MPU remains unchanged. Select pages in this MPU were revised to incorporate the recommendations of the AAAB and are summarized below: Executive Summary; Page 3 Acknowledgement that the MPU is a living document; as such, it will be updated and modified as future studies and planning exercises are completed. 00_PBCDOA_EXECSUMMS_V3_ADDENDUM_#1_V7_LNA_ONLY.DOC 6
9 EXECUTIVE SUMMARY Executive Summary; Exhibit ES-6, LNA Preferred Plan Exhibit has been replaced based on changes made to the ALP sheet replaced in it s entirety incorporating additions summarized in Addendum #1 dated March 10, October 2006 Technical Report No. 4; Page 1-1 Acknowledgement of the ever-changing state of the aviation industry. October 2006 Technical Report No. 6; Attachment 1, ALP Two and three runway configuration sheets were removed and replaced with a three-runway configuration with a parallel taxiway/taxilane to Runway 3/21. October 2006 Technical Report No. 6; Attachment 1, ALP Canal Note 9 added related to Palm Beach County not requesting or accepting environmental mitigation credits for that portion of the perimeter canal that crosses through the future runway extension study area. Finally, the select pages affected by these changes are marked in the MPU with a date in the footer. 00_PBCDOA_EXECSUMMS_V3_ADDENDUM_#1_V7_LNA_ONLY.DOC 7

10 EXHIBIT ES-6 LNA Preferred Plan Note: Exhibit has been revised to incorporate changes addressed in Addendum #1, dated March 10, Prepared by: CH2M HILL, March 10, CH2M HILL 8
11 Technical Report #1 Palm Beach County Park Airport Inventory Palm Beach County Park Airport Prepared for Palm Beach County Department of Airports APRIL 2006 In Association with Ricondo & Associates, Inc.
12 Contents Section Page 1 Airfield Facilities Runways Runway 3/ Runway 9/ Runway 15/ Taxiways Taxiway A Taxiway B Taxiway C Apron Areas Main Apron T-Hangar Aprons Helipad Fences and Security Gates Lighting, Marking, Signage, and Other Navigational Aids Lighting Marking Signage Instrument Approaches Aviation Tenant Facilities General Aviation Facilities FBO Terminal Building Aircraft Parking and Apron Areas Aircraft Storage Helicopter Facilities Fixed Base Operators and Other General Aviation Tenants Florida Airmotive Other General Aviation Tenants Airport Support Facilities Maintenance Facilities Aircraft Rescue and Fire Fighting Facilities Fueling Facilities Airport Traffic Control Tower Navaids Airport Access and Parking Facilities Airport Access Airport Parking LNA_INVENTORY_OCTOBER2006 ii
13 CONTENTS, CONTINUED 5 Meteorological Conditions Historic Weather Conditions Meteorological Conditions Tables 5-1 LNA Wind Coverage VMC, IMC, and All-Weather Exhibits Page 1-1 Current Airfield Layout Perimeter Fence and Security Gates Aircraft Parking Areas Main Aviation Tenants Helicopter Facilities Fuel Farm VMC Windrose IMC Windrose All Weather Windrose LNA_INVENTORY_OCTOBER2006 iii
14 SECTION 1 Airfield Facilities Palm Beach County Park (LNA) Airport has three runways, two parallel taxiways, and an additional connector taxiway between two of its runways. The runways, designated Runway 3/21, Runway 9/27, and Runway 15/33, are asphalt-surfaced and designed to accommodate single-wheel general aviation aircraft weighing up to 30,000 pounds. Pavement conditions described below were obtained from the Draft January 2006 Annual Airports Pavement Evaluation prepared by Applied Pavement Technology, Inc. The current airfield layout is illustrated in Exhibit Runways Runway 3/21 Runway 3/21 is 3,256 feet long and 75 feet wide. With the exception of two small areas, the runway is performing very well with only a small amount of low-severity cracking, typically located at the paving lane joints Runway 9/27 Runway 9/27 is 3,490 feet long and 75 feet wide. This runway was relocated north approximately 37.5 feet in 2003, and is performing well with only a small amount of lowseverity cracking Runway 15/33 Runway 15/33 is 3,426 feet long and 100 feet wide. This runway is showing the most deterioration of the three runways at LNA with typical distresses observed on Runway 15/33 including low-severity and medium-severity cracking, swelling, patching, and isolated areas of medium-severity block cracking. 1.2 Taxiways Taxiway A Taxiway A was constructed in 2003 as a parallel taxiway to Runway 9/27 and is in excellent condition Taxiway B Taxiway B serves as the parallel taxiway to Runway 15/33 and is performing well. Only a minor amount of low-severity cracking and surface cracking are present. 1-LNA_INVENTORY_OCTOBER
15
16 SECTION 1 AIRFIELD FACILITIES Taxiway C Taxiway C is located adjacent to the apron area extending from the approach end of Runway 33 to the approach end of Runway 21. The entire length of the taxiway is significantly deteriorated with 100 percent of the pavement surface exhibiting mediumseverity block cracking. 1.3 Apron Areas Main Apron Overall, the apron is performing well, with the exception of isolated areas of depressions, block cracking, and fuel spill damage T-Hangar Aprons The concrete t-hangar apron areas at Lantana Airport are performing relatively well, exhibiting only small amounts of pavement distress. 1.4 Helipad The helipad is in good condition, and consists of concrete landing pads with asphalt pavement surrounding the pads. 1.5 Fences and Security Gates Unlike airports that provide passenger airline service, general aviation airports are not required by federal regulations to provide security fencing around the areas used by aircraft (i.e., the Air Operations Area), which is, in some areas, common to an airport property boundary. The September 11, 2001, terrorist attacks, however, raised security concerns for general aviation (GA) airports as well as air carrier airports. Following the attacks, several working groups were created to evaluate the security measures then in place at airports and recommend security improvements. The Transportation Security Administration (TSA), for example, initiated the development and dissemination of appropriate security guidelines for GA airports and heliports. In May 2004, the TSA published a report titled Security Guidelines for General Aviation Airports. Although the recommendations and guidelines in this document are not mandatory, nor are they intended to suggest that any specific or general criteria must be met to qualify for federal funding, this document does provide a set of security best practices that can be tailored to each airport and, therefore, serves as a good reference for security practices at GA airports. Installation of a fence around the airport perimeter is one of the security alternatives listed in the TSA document. Such measures could delineate and adequately protect sensitive areas of the airport from entry by unauthorized persons and/or vehicles and adequately prevent the general public from accessing the airfield, either inadvertently or intentionally. 1-LNA_INVENTORY_OCTOBER
17 SECTION 1 AIRFIELD FACILITIES The effectiveness of perimeter fencing, as well as security gates, however, is dependent on the adequacy of the fencing or gates, and the way the perimeter control methods are implemented. The inventory of the fencing and security gates in place at the Airport will provide the basis for determining the suitability of the existing system and future security improvements, if required. As shown on Exhibit 1-2, a six-foot high chain link fence is installed along the southern, western, and northeastern boundaries of the Airport. On the south side of the airfield, the perimeter fence ties into all hangars and facilities, separating the landside and airside portions of the Airport, and generally runs parallel to Lantana Road. On the northeast side of the airfield, the fence line runs parallel to and east of Runway 15/33, separating the airfield from the John Prince Memorial Park campground. The six-foot-high chain link fence also runs along the western side of the Airport and Congress Avenue, from the southwest corner of the airfield to a point approximately 2,000 feet to the north. A three-foot-high chain link fence is also installed in the northwest quadrant of the airfield to prevent animals, mainly gopher tortoises, from straying onto the airfield, posing a safety concern and threat to aircraft. This fence runs east of Runway 3/21 and separates the Air Operations Areas from the parkland. Security gates are typically installed at various points along the fence line at GA airports to provide vehicular and pedestrian access to the airfield. In some cases where security is of major concern or mandated by regulation, electronic monitoring of the gates is typical. At LNA, two gates are installed along the perimeter fencing. The main gate, a chained gate that remains open during the day, is located 100 feet northeast of the roundabout at the Airport entrance. The second gate is approximately 300 feet east of the Airport entrance. This gate is electronically operated via a card reader system. In addition to these two vehicular access gates, several pedestrian gates are located along the perimeter fence, three of them along the westernmost portion of the fence that runs parallel to Congress Avenue. Following the terrorist attacks, the FBO, Florida Airmotive, installed several security cameras on the airfield. These cameras, however, are not connected to a closed circuit television system. Therefore, the monitoring of the airfield using those cameras is not effective. 1.6 Lighting, Marking, Signage, and Other Navigational Aids Lighting, marking, signage, and other navigational aids provide pilots with visual or electronic guidance to and around an airport. Navigational aids generally direct pilots to the airport or designated runway approach; lighting systems, markings, and signage provide identification of paved surfaces and other facilities and wayfinding for pilots taxiing on the runway/taxiway system. These wayfinding systems collectively result in a safer environment for aircraft operating at or in the vicinity of the airport. For operations during adverse weather conditions or reduced visibility, instrument approaches provide electronic guidance for horizontal alignment on approach to a runway centerline. 1-LNA_INVENTORY_OCTOBER
18
19 SECTION 1 AIRFIELD FACILITIES Lighting Proper airfield lighting is required at all airports that are used for nighttime operations. LNA is capable of accommodating aircraft operations at night because of the lighting fixtures on the airfield. A majority of the electricity for the airfield lighting at the Airport is provided from the main electrical vault located in the midfield area, approximately 300 feet north of the Runway 9/27 pavement edge. Runway and taxiway lights allow pilots to identify the edges of the pavement and assist pilots in determining the runway length remaining during nighttime hours and periods of restricted visibility. These lighting systems are classified according to their intensity, or brightness. All runways at LNA are equipped with medium intensity runway lights (MIRLs), and the taxiways are equipped with medium intensity taxiway lights (MITLs). Additionally, floodlights are installed along some ramp areas. Visual, vertical guidance is typically provided to pilots by either visual approach slope indicators (VASI) or precision approach path indicators (PAPI). These lighting systems are installed along the side of a runway near the approach end of the runway. These systems consist of a series of lights that change color based on the pilot s glide slope path to the runway. Both systems provide the same information but in a slightly different way. VASIs are arranged in several rows, while PAPIs are arranged in a single row, and are generally considered more precise than VASIs. All runways at LNA are equipped with PAPIs, which range from a 3.5-degree to a 4.0-degree glide slope. Pilots are aided in locating airports at night or during very adverse weather conditions by rotating lighted beacons. At LNA, the beacon is located on the south side of the airfield, in the center of the roundabout at the Airport entrance. This optical rotating beacon is approximately 65 feet above ground level (AGL) and projects two beams of light, one green and one white. It is operated continuously at night and during instrument flight rule (IFR) weather conditions. The beacon at LNA is reported to be in good condition. During the site visit conducted in March 2006, several tenants indicated that the beacon light is difficult to see at night because of its limited height, as well as the interference created by ambient lights along adjacent roadways Marking Pavement markings indicate the standards for operations on paved areas (runways, taxiways, and aprons) of the airfield. Pavement markings generally reflect the type of approach a runway can accommodate, categorized as visual, non-precision, or precision. Runways used during periods of low visibility minimums require more complex markings than runways used only for visual approaches. At LNA, all runways have designation numbers and centerline striping; however, only Runway 15 has side stripes and threshold markings. Runway 15 pavement markings include more detail because this runway has non-precision approach capability. All other runways at LNA are used only for visual approaches. All taxiways at LNA have visible yellow taxiway centerline stripes with hold short lines at the required locations. These markings help ensure that aircraft taxi along designated passageways for proper wingtip clearance and warn of the areas protected for runway 1-LNA_INVENTORY_OCTOBER
20 SECTION 1 AIRFIELD FACILITIES operations. Taxiway A also has taxiway edge markings on its north side. This type of marking is used to delineate the width of the taxiway where the taxiway edge does not coincide with the edge of the pavement. Several tenants at LNA indicated that the majority of the tie-down markings are not visible, making the identification of aircraft parking positions difficult Signage A total of twelve signs are strategically located along the ramp area and south of Runway 9/27 to provide instruction and guidance information to Airport tenants and users. Nine of these signs are illuminated at night. The remaining three signs are made of aluminum and reflect light, but are not illuminated. One of the aluminum signs is near the approach end of Runway 3, along the northern edge of ramp. The sign reads: Pilots: follow approved noise abatement procedures. Preferred runway is 3/21 conditions permitting. Runway 3/21 was identified as the preferential runway to minimize noise levels at nearby residences. In the same general location but along the western edge of the ramp, an illuminated sign reads: Runway 3/21 preferred noise abatement runway. The panels associated with this sign are very faded. Two illuminated signs, including one location sign and one runway holding position sign, are located near the intersection of Runway 3 and the ramp area. The location sign identifies the ramp while the other identifies the Runway Safety Area (RSA) for Runway 3 and indicates that pilots approaching the runway from the ramp should use caution or stop before entering the runway. Located near the intersection of Taxiway A1 and Runway 9/27 are a taxiway location sign and runway holding position signs. These signs, which are in good condition, identify Taxiway A1 and the close proximity of the Runway 9/27 RSA. Two signs are located near the intersection of the ramp and Taxiway B, along the northern edge of the ramp, and west of Taxiway B centerline. One of the signs is made of aluminum and reads: Caution pilots: please direct prop blast away from aircraft & hangars when running up. Adjacent to this sign is an illuminated information sign that reads Runway 3/21 preferred noise abatement runway. The panels of this sign are also very faded. Located near the approach end of Runway 33, east of Taxiway B, and north of the ramp, are a sign identifying the location of the ramp (Taxiway location sign) and a sign indicating the close proximity of the RSA for Runway 33 for those pilots approaching the runway from the ramp (runway holding position sign). These two illuminated signs are in very good condition. The last two illuminated signs are located at the intersection of Taxiway B and Runway 9/27, east of Taxiway B centerline and south of Runway 9/27. These signs also include a taxiway location sign and a runway hold position sign indicating the close proximity of the RSA for Runway 9/27. These signs are also in very good condition. 1-LNA_INVENTORY_OCTOBER
21 SECTION 1 AIRFIELD FACILITIES Interviews with some of the general aviation tenants based on the airfield revealed that the limited airfield signage creates some confusion for pilots who are not familiar with the airfield layout Instrument Approaches Non-precision instrument runway approaches can be provided through various types of navigational aids. A very high frequency omnidirectional range (VOR) approach is used at LNA to provide signal course guidance (horizontal guidance to or from the airfield) to aircraft equipped with VOR receivers. A VOR is a ground-based electronic navigation aid that transmits 360 signals, called radials. The Airport s VOR (located 5.2 miles from LNA, with the location identifier PBI ) is also equipped with distance measuring equipment (DME), which allows pilots to determine their slant distances to or from the VOR. A VOR approach is available to Runway 15 at LNA. The minimum descent altitude (MDA) for this approach is 605 feet above the touchdown zone elevation (TDZE) (620 feet above mean sea level [MSL]). Visibility requirements for this approach include the following: 1.0 statute mile for Approach Category A and B aircraft, and 1.75 statute miles for Approach Category C and D aircraft. Different minimums apply to aircraft performing a circle-to-land maneuver (a maneuver in which the pilot begins an approach to one runway but circles to a different runway to land). For this approach, the MDA is 644 feet above the TDZE and 660 feet above MSL. The visibility requirements for this approach are the same as for the VOR approach stated above. The other non-precision instrument approach available at LNA uses a global positioning system (GPS), which is a satellite-based navigation system consisting of a network of satellites known as a constellation. The constellation provides a celestial reference for determining the position of any point on or above the Earth s surface. By analyzing the time delays of signals received from some of these satellites, air-based receivers are able to determine latitude, longitude, and altitude. Runway 15 at LNA has a GPS approach, with an MDA of 605 feet above the TDZE (620 above MSL). The visibility requirements for this approach are the same as for the VOR and circle-to-land approaches stated above. 1-LNA_INVENTORY_OCTOBER
22 SECTION 2 Aviation Tenant Facilities This section describes the types and characteristics of the aviation tenant facilities at LNA. The description of these facilities provides the foundation for subsequent analyses, including the determination of facility requirements, which will be presented in subsequent reports. This section also includes a review of the types of services offered by the fixed base operator (FBO), as well as the main GA tenants, to help determine future facility requirements. To inventory the aviation tenant facilities, a number of resources were used. First, the aerial photograph, the current Airport Layout Plan and the Master Plan Update developed by Dames & Moore in 1998 were reviewed. Next, interviews were conducted with several aviation tenants at the Airport, including Air Coastal Helicopters, Florida Airmotive, Kemper Aviation, Palm Beach Flight Training, Palm Beach Helicopters, and Windward Aviation. These interviews provided critical information on the types of aviation activities conducted at the Airport. Finally, a field check of the general aviation facilities was conducted on March 29, For ease of reference, the following discussion is provided in two sections. The first section provides a review of the general aviation facilities located on the airfield, including apron areas, tie-down spaces, and hangars. The second section provides a brief review of the FBO and other GA tenants. 2.1 General Aviation Facilities General aviation includes virtually all civil aviation except that of the certificated air carriers and cargo carriers. The general aviation aircraft fleet ranges from small single-engine aircraft of relatively low sophistication to multi-engine turboprops and business jets with state-of-the-art technology. The general aviation aircraft types operating at LNA and those based at LNA include a majority of single-engine piston aircraft, several helicopters, and a couple of multi-engine piston and turboprop aircraft. No turbojets operate at or are based at the Airport because Section 12-6(a) of the Palm Beach County Airport Rules and Regulations prohibits such aircraft from operating at the Airport. General aviation facilities at LNA consist of one full-service FBO terminal, apron and tie-down areas, helicopter facilities, and an array of general aviation storage hangars located south of Runway 9/ FBO Terminal Building The Florida Airmotive terminal building is centrally located in the southern section of the airfield, immediately north of the Airport entrance. This one-story building consists of approximately 3,980 square feet. According to the previous Master Plan, the terminal was originally constructed in the 1950s, based on the architectural style used for the design of Florida houses. Several improvements have been made to the terminal building over the years, and the facility is in good condition. The terminal houses two subtenants, Palm Beach 1-LNA_INVENTORY_OCTOBER
23 SECTION 2 AVIATION TENANT FACILITIES Flight Training and the LNA Pilot Shop. The terminal provides circulation areas, administrative offices, pilot briefing rooms, training rooms, a pilots lounge, and meeting rooms Aircraft Parking and Apron Areas As illustrated in Exhibit 2-1, the largest apron area is located to the north of Lantana Road (SR 812) between Runway 3/21 and Taxiway A1. This area includes approximately 64,000 square yards of apron. With the exception of the area immediately north of the FBO terminal building and the fuel farm, this ramp is generally used for the parking of itinerant aircraft. The FBO, Florida Airmotive, which maintains responsibility for the management and leasing of tie-down positions, indicates that the available tie-down spaces are generally occupied throughout the year, especially during the peak season, with single-engine piston aircraft occupying most of the tie-down spaces. The separation distance (approximately 75 feet) between the seven rows of tie-downs located to the east of the fuel farm only allows for the taxiing of small aircraft. Based on the interviews with the tenants and users of this space and a visual inspection, this ramp appears to be in fair condition, and some of the tie-down markings are fading. It was also noted that several aircraft staged on this ramp are not in airworthy condition. Also, several tenants indicated the need for additional airfield signage that would indicate the ramp location on the airfield. The second largest aircraft parking area is the ramp area located between Taxiways A1 and B, west of Taxiway B, and north of the row of hangars to the east of the FBO terminal building. This based aircraft-parking apron provides an estimated 7,820 square yards of aircraft parking and movement area. Overall the two aircraft parking areas provides an estimated 71,820 square yards of apron and offers 232 tie-down spaces sized for small aircraft with wingspans of 49 feet or less. In addition to these ramps, there are additional paved apron areas associated with the various hangar facilities on the airfield, although these areas have not been included in the total available apron space at the Airport because their use is associated solely with each hangar tenant Aircraft Storage The Airport has 52 conventional hangars that vary in size, as well as 10 t-hangars (port-aport hangars). Three large conventional hangars are located immediately to the east of the FBO terminal building. As indicated in Exhibit 2-2, these hangars house Air Coastal Helicopters, Palm Beach Helicopters, Windward Aviation, and Premier Aviation of Palm Beach. These three hangars, which provide approximately 29,200 square of space for aircraft maintenance and storage, are in good condition. 1-LNA_INVENTORY_OCTOBER
24
25
26 SECTION 2 AVIATION TENANT FACILITIES East of these conventional hangars are two rows of port-a-port aircraft hangars oriented east-west. These hangars were severely damaged by Hurricane Wilma in 2005 and are in very poor condition. In addition, two 3,800 square-foot hangars are located south of the two rows of port-a-port hangars. These hangars are used for aircraft storage and various maintenance activities. Further east is an east-west row of five conventional hangars. Each of these hangars provides an estimated 2,500 square-feet for aircraft storage space. Two of these hangars were severely damaged by Hurricane Wilma in 2005 and are still in need of major repairs. The other three hangars appear to be in fair condition. The Palm Beach Aircraft Services conventional hangar is located just northeast of these hangars. This hangar is approximately 110 feet long and 90 feet wide and provides a total area of 9,900 square feet for aircraft storage and maintenance. South of the Palm Beach Aircraft Services hangar are two 50 feet by 60 feet (3,000 square feet) conventional hangars, as well as one 7,000-square-foot hangar used for aircraft storage. Further east are 33 conventional hangars that vary in size, arranged in three rows. The hangars owned and managed by Bipe and Air Excalibur are used for both aircraft storage and maintenance. The other 31 hangars are mainly used for aircraft storage. Overall, these 33 hangars provide an estimated 79,300 square feet of space. Five additional conventional hangars are located on the west side of the FBO terminal building. Furthest west is a 7,720-square-foot hangar owned by Palm Beach Aircraft Propeller. This hangar appears to be in good condition, and is used for aircraft storage and maintenance. The conventional hangar east of that hangar encompasses 11,000 square feet used for aircraft storage. This hangar is in good condition. Adjacent to and east of that hangar is a 8,500-square-foot aircraft storage hangar operated by Windward Aviation that is used for aircraft storage. Further east are two conventional hangars providing 7,000 and 8,000 square feet of space each. The 8,000-square-foot hangar is leased by Control Logistics to manufacture aircraft windshields. There are no aircraft stored in this hangar Helicopter Facilities Rotary wing aircraft (helicopter) activity continues to increase, and as of March 2006, approximately 15 helicopters were based at LNA. To properly plan for future facilities to accommodate helicopter operations, it is important to assess the existing facilities because helicopters have different facility requirements, and different operational requirements for taxiing, takeoff, landing, and parking. Several Airport tenants, including Palm Beach Helicopters and Air Coastal Helicopters, use only rotary wing aircraft. Landing areas and parking spaces for these aircraft at LNA are minimal, and in high demand. Landing areas include three helipads, two small concrete slabs, and one long paved ramp area. These areas are illustrated on Exhibit 2-3. The three helipads are located in front of the Premier Aviation hangar at the edge of the apron and are in good condition. These helipads are primarily used by Air Coastal Helicopters, which leaves its dollies (trailers used to transport helicopters on wheels to various locations) on the pads when the pads are not being used for other purposes. The blast pad dimension associated with these pads is about 45 feet and the separation distance between the pads is 17 feet. 1-LNA_INVENTORY_OCTOBER
27
28 SECTION 2 AVIATION TENANT FACILITIES The two small concrete slabs located just west of Taxiway A1, south of Runway 9/27 and north of the main ramp area, are used as helipads by Palm Beach Helicopters. These concrete slabs are in very poor condition and are relatively small for helicopter operations. Access to these slabs from the apron is limited and helicopters must be transported over sand mounds, potentially causing damage to the blades by surrounding rocks and sand. Additionally, the concrete is in poor condition and cracking, resulting in the potential for debris to damage aircraft operating in this area. To the west of these slabs is a long paved ramp area used as a helipad by BoatPix and Palm Beach Helicopters. This ramp area, which encompasses an area of approximately 1,150 square yards, is located approximately 530 feet east of Runway 3 end, south of Taxiway A, and north of the main ramp area. This ramp is accessible from the main aircraft parking apron via two connectors sited on both sides of the ramp. 2.2 Fixed Base Operators and Other General Aviation Tenants Fixed base operators provide a wide range of facilities and services to aircraft operators at an airport. These services often include aircraft, airframe, and avionics services; aircraft storage; fueling; and, in many cases, aircraft chartering and flight instruction. Of all the general aviation tenants at the Airport, only one, Florida Airmotive, offers on-airport services to the general aviation public that would be classified as a full service FBO. Florida Airmotive, for instance, is the only tenant on the airfield that sells aircraft fuel. A total of 40 other aviation tenants are located on the airfield. These provide an array of services that include rotorcraft rental, flight instruction, aerial photography, aircraft sales, aircraft charter services, airframe repair, aircraft painting, propeller repair, and other services. The sections that follow provide a brief description of Florida Airmotive and other aviation tenants Florida Airmotive Florida Airmotive is a full-service FBO that provides ramp and fuel service, aircraft tiedown, and aircraft hangar leases. Florida Airmotive also subleases offices and aircraft parking apron areas. As indicated earlier, Florida Airmotive occupies the FBO terminal building, located immediately north of the Airport entrance. At the time of the inventory in March 2006, Florida Airmotive had eight employees at the Airport. The number of employees, however, varies based on the time of year. During peak season, Florida Airmotive employs up to ten persons. The current lease agreement between the Palm Beach County DOA and Florida Airmotive states that Florida Airmotive is responsible for all other tenants located on the airfield. Thus, the DOA only maintains a master lease agreement with Florida Airmotive, and Florida Airmotive handles all sublease agreements that establish the minimum criteria for facilities and services, including aircraft and automobile parking, buildings, repairs, air taxi and charter services, flight training, ground services, and other services. It should be noted that the subtenantsmaintain the facilities from which they operate. While Florida Airmotive and the DOA have to agree on any proposed facility improvements and expansions, such improvements and expansions are ultimately the responsibility of the 1-LNA_INVENTORY_OCTOBER
29 SECTION 2 AVIATION TENANT FACILITIES subtenants. A Florida Airmotive representative indicated that the FBO maintains an average of 36 to 40 sublease agreements, representing an average of 190 persons working on the airfield. Currently, Florida Airmotive is the only supplier of AvGas (100LL) at the Airport. Florida Airmotive operates a fuel farm immediately east of the FBO terminal building, as well as four fuel trucks. Additional discussion of the fuel farm is provided in Section 4 of this report. Virtually all of the ramp areas west of the FBO terminal building and a majority of the ramp area south of Taxiway A are contained within the Florida Airmotive leasehold. Overall, these ramp areas include 232 tie-down spaces managed by Florida Airmotive Other General Aviation Tenants The master planning process requires the gathering of information related to the types of aviation activities conducted by the tenants based at the Airport. This information serves as the basis for determining the type of facilities that may be needed in the future. Helicopter operations for instance, require different facilities than fixed-wing aircraft operations. Identification of the type of business conducted by the aviation tenants is therefore essential. The subsections that follow summarize those activities conducted by the main tenants at LNA only. Tenants who own or lease hangars for aircraft storage, as well as those tenant businesses that conduct limited aviation-related activities, were not identified for the purposes of this inventory report Air Coastal Helicopters As indicated on Exhibit 2-3, the Air Coastal Helicopters facilities are located east of the main FBO terminal. These facilities consist of 5,000 square feet of hangar space, as well as office spaces. The Air Coastal Helicopters hangar is primarily used for the storage and maintenance of aircraft, but it also houses various parts and supplies. This 10,000-squarefoot hangar is operated jointly with Palm Beach Helicopters, which occupies the remaining 5,000 square feet of hangar space. Air Coastal Helicopters is an FAR Part 135 operator that has eight employees, four of which are full time. Currently, Air Coastal operates seven helicopters, all of which are Bell 206B Jet Rangers or Bell 407s. Primary services offered by Air Coastal Helicopters include rotorcraft rental, aerial photography, and charter services. In the future, Air Coastal Helicopters plans to become a Maintenance Service Center for Bell 206 helicopters, one of a few recognized facilities in the Southeast that will provide certified maintenance on Bell 206 helicopters Palm Beach Helicopters The Palm Beach Helicopters facilities include 5,000 square feet of hangar space, and 4,000 square feet of office space. These facilities are in good condition. The portion of Palm Beach Helicopters facilities that houses administrative offices, pilot briefing rooms, training rooms, pilot lounge, meeting rooms, and a front desk is in excellent condition, as it was remodeled after Hurricane Wilma in Palm Beach Helicopters is an FAR Part 141 approved flight training school with eight employees, including a chief pilot, four flight instructors, and three administrative staff. 1-LNA_INVENTORY_OCTOBER
30 SECTION 2 AVIATION TENANT FACILITIES Currently, Palm Beach Helicopters owns or leases seven helicopters, including Robinson R-22s and Robinson R-44s. On average, these helicopters are flown 70 hours per month, are used to conduct 200 touch-and-go operations per day, and individually are used to conduct 100 operations per week. Palm Beach Helicopters is also certified as a Robinson Maintenance Service Center. Services provided by Palm Beach Helicopters include rotorcraft rentals, flight instruction (private, instrument, commercial, Airline Training Programs [ATP], Certified Flight Instructor [CFI and CFII] training, turbine transition, career pilot program), pilot services, and maintenance Air Excalibur Air Excalibur is located on the east side of the airfield and is the first facility north of the row of hangars numbered in the 200s. Air Excalibur s hangar encompasses approximately 4,500 square feet. Services offered by Air Excalibur include airframe repair, aircraft parts replacement, and aircraft sales BIPE BIPE facilities are located next to and east of the Air Excalibur hangar. BIPE operates out of a 4,500-square-foot hangar that appears to be in good condition. BIPE services include repair and refurbishment of aircraft fabric, as well as antique aircraft restoration Florida Aero Paint Florida Aero Paint operates out of a 2,500-square-foot hangar located in the row of hangars just east of the port-a-port hangars. The Florida Aero Paint facilities sustained severe damage during the last hurricane season and are in poor condition. Services offered by Florida Aero Paint include refurbishment of aircraft interiors and aircraft painting Kemper Aviation Kemper Aviation is a fixed-wing aircraft FAR Part 141 approved flight school. It is the only TSA-approved flight training school at LNA certified to train international students. Kemper Aviation pilot briefing rooms, training rooms, pilots lounge, and front desk are located in a facility next to the Civil Air Patrol building, east of the FBO terminal building. This facility provides an estimated 1,600 square feet of space. While the other tenants on the airfield own their facilities, the Kemper Aviation facility is owned by the Palm Beach County DOA. Thus, Kemper Aviation leases its office space through Palm Beach County DOA. Affiliated with Kemper Aviation is AIM High Aviation, a full-service repair station specializing in piston engine aircraft. AIM High Aviation operates from a 2,000-square-foot hangar on the east side of the airfield. As of March 2006, AIM High Aviation provided maintenance services exclusively for the Kemper Aviation aircraft fleet. Kemper Aviation is currently staffed with 12 full-time employees and operates 12 single engine fixed wing aircraft. Aircraft available for rent and flight instruction at Kemper Aviation include: Piper J-3 Cub, Cessna 152, Grumman Cheetah, Cessna 172N, Piper Arrow, Cessna 172S, Piper Archer, and Piper Seneca I. 1-LNA_INVENTORY_OCTOBER
31 SECTION 2 AVIATION TENANT FACILITIES Palm Beach Aircraft Services Palm Beach Aircraft Services facilities are located to the west of the BIPE hangar on the eastern side of the airfield. These facilities include a 9,700-square-foot hangar and office space that is in good condition. The main service offered by Palm Beach Aircraft Services is airframe repair for small aircraft Palm Beach Aircraft Propeller The 7,720-square-foot Palm Beach Aircraft Propeller hangar is the last facility to the west on the ramp. Palm Beach Aircraft Propeller is an FAA-certified repair station specializing in the repair and sale of propellers and related parts. The Palm Beach Aircraft Propeller hangar also houses Gold Coast Aero Accessories, which is also an FAA-certified repair station. Gold Coast Aero Accessories stocks and handles aircraft accessories, such as governors, accumulators, wheels, and other components Palm Beach Flight Training Palm Beach Flight Training is an FAR Part 141 flight training school that offers aircraft rental, flight instruction, and various pilot services. Palm Beach Flight Training s offices, pilot briefing rooms, training rooms, and pilot lounge are located in the main FBO terminal. Palm Beach Flight Training leases 900 square feet of office space through Florida Airmotive. In total, Palm Beach Flight Training is staffed with 14 employees, two of which are part-time and 12 of which are full-time. Palm Beach Flight Training operates 22 single-engine fixed wing aircraft that are parked on the ramp. These aircraft include Cessna models 172 and 182, as well as Piper 6XT, Piper Archer, and Piper Arrow. According to representatives of Palm Beach Flight Training, its aircraft are used to conduct an average of 40 flights and 60 touch-and-go operations per day Windward Aviation Windward Aviation facilities include Building 702, a 6,000-square-foot-hangar used for aircraft storage; Building 1301, an 8,500-square-foot hangar used for aircraft storage; and Building 805/806, a 10,000-square-foot hangar located between Palm Beach Helicopters/Air Coastal Helicopters and the Premier Aviation hangars, used for aircraft storage and maintenance. Windward Aviation s facilities are in good condition, having suffered only minor damages after the passage of hurricane Wilma in Windward Aviation has 10 employees, 8 of which are full time. Services offered by Windward Aviation include aircraft fabric repair, airframe repair, engine change, propeller overhaul, and other aircraft maintenance services. Although Windward Aviation specializes in Beech aircraft, it also services Cessna, Mooney, Eurocoupe, Piper, Decathlon, Citabria, Maule, Rockwell, Marchetti, and Navion aircraft. In addition, Windward Aviation leases hangars to some of its customers. On average, 12 tenants rent hangars from Windward Aviation on an annual basis, with 10 to 12 aircraft stored in the facilities. 1-LNA_INVENTORY_OCTOBER
32 SECTION 2 AVIATION TENANT FACILITIES Premier Aviation The Premier Aviation hangar is adjacent to the Windward Aviation hangar. Premier Aviation s conventional hangar encompasses 9,200 square feet of space used primarily for aircraft storage and maintenance. Primary services offered by Premier Aviation include airframe repair for small aircraft, and aircraft interior refurbishment. 1-LNA_INVENTORY_OCTOBER
33 SECTION 3 Airport Support Facilities A variety of support services and facilities are typically provided at an airport. These services vary depending on the mission of the airport. The only support facility located at LNA is the fuel farm. 3.1 Maintenance Facilities There are no maintenance facilities located at the Airport. The DOA Maintenance Division, which is located at Palm Beach International Airport (PBI), provides all airfield and facility maintenance services at LNA. The majority of aviation tenants based at LNA own their facilities, and provide their own maintenance. Therefore, the DOA Maintenance Division is only responsible for those buildings owned by the County. These include the Civil Air Patrol facility, the DOA office trailer, located at the Airport entrance, Building 1100 which is currently leased by Kemper Aviation, and the FBO terminal building. The DOA Maintenance Division is responsible, however, for all airfield maintenance. 3.2 Aircraft Rescue and Fire Fighting Facilities As a general aviation airport, LNA is not required to have an aircraft rescue and fire fighting (ARFF) station located on the airfield. The Palm Beach County Fire Rescue station located off Lantana Road, approximately 700 feet east of the Airport entrance road, responds to any emergencies that occur on the airfield. 3.3 Fueling Facilities Located west of the FBO terminal building and north of Kemper Aviation, the fuel farm at LNA is operated by Florida Airmotive. It includes one 10,000-gallon AvGas tank, one 5,000-gallon AvGas tank, and one 10,000-gallon Jet-A fuel tank, all of which are above ground. Florida Airmotive operates four fuel trucks, which consist of two 1,250-gallon AvGas trucks, one 750-gallon AvGas truck, and one 1,250-gallon Jet-A fuel truck. On average, Florida Airmotive pumps 330,000 gallons of fuel per year. Exhibit 3-1 shows the location of the fueling facilities at LNA. In addition, potential self-fueling locations have been identified that meet the needs of the airport, and these locations are depicted on the airport layout plan (ALP). 3.4 Airport Traffic Control Tower At LNA, the pilots rely on communication over a Unicom frequency, as there is no Air Traffic Control Tower located at the Airport. The Unicom frequency provides a means of communication between Airport users, as necessary. 1-LNA_INVENTORY_OCTOBER
34
35 SECTION 3 AIRPORT SUPPORT FACILITIES 3.5 Other Navaids In addition to the navaids described above, LNA is also equipped with a NEXWOS system. This system is located northeast of the airport s electrical vault, and southwest of the existing wind sock (within the infield area bounded by the three runways). The DOA will be replacing the NEXWOS with a new Automated Weather Observation System (AWOS), to be located in the same location as the NEXWOS. The AWOS is scheduled to be installed and operational in the Spring of LNA_INVENTORY_OCTOBER
36 SECTION 4 Airport Access and Parking Facilities 4.1 Airport Access LNA is located two miles west of the Intracoastal Waterway, adjacent to SR 807/Congress Avenue. LNA has excellent regional access; I-95 provides the major north-south access to the east, and the Florida Turnpike provides the north-south access to the west. Airport access is provided via Lantana Road, which runs east-west. 4.2 Airport Parking Lantana Airport currently has 136 parking spaces for general public use. Four of these spaces are designated for airport employee use only. Auto parking is accessed through the main terminal entrance on the south side of the Airport. There are no rental car companies at the Airport at this time. 1-LNA_INVENTORY_OCTOBER
37 SECTION 5 Meteorological Conditions 5.1 Historic Weather Conditions Meteorological Conditions Meteorological conditions for this analysis are based on weather observations taken in the West Palm Beach area during the period This data, obtained from the National Climatic Data Center (NCDC), consists of 84,031 hourly observations separated by visual meteorological conditions (VMC), instrument meteorological conditions (IMC), and all weather conditions as further described below. The hourly observations record data for ceiling heights, visibility, wind velocity, and wind direction, which was used to prepare wind roses for LNA, as shown in Exhibits 5-1 through 5-3. Meteorological conditions have a direct impact on the operational characteristics of the Airport. The conditions determine directions in which aircraft operate, the frequency of use of each operating configuration, and the instrumentation required in assisting pilots in landing and departing Ceiling and Visibility Conditions Airfield and airspace capacity is impacted by the flight rules that aircraft operate under, which is governed by the ceiling and visibility conditions at the airport, due to spacing requirements. Aircraft operate under two distinct categories of operational flight rules: Visual Flight Rules (VFR) and Instrument Flight Rules (IFR), which directly impact air traffic control procedures. These flight rules are closely related to the two categories of weather conditions: VMC (Visual Meteorological Conditions), and IMC (Instrument Meteorological conditions). VMC is defined as conditions in which the ceiling is at or above 1,000 feet above ground level (AGL) and the visibility is at or above three statute miles. IMC exists whenever the ceiling drops below 1,000 feet AGL and/or the visibility is below three statue miles. In the West Palm Beach area, VMC occurs approximately 99 percent of the time, and IMC occurs approximately one percent of the time. Aircraft may operate under VFR during VMC. In these conditions, the pilot is primarily responsible for seeing other aircraft and maintaining safe separation; navigation is typically performed by reference to geographic and other visual references. As a result, aircraft separation requirements are reduced, increasing airspace and airfield capacity as compared to IFR. During IMC, aircraft operate under IFR. Air Traffic Control (ATC) is primarily responsible for aircraft separation and exercises positive control over aircraft during these conditions. In order to operate under IFR conditions, pilots must be certified instrument rated and meet proficiency requirements, and aircraft must meet certain minimum equipment 1-LNA_INVENTORY_OCTOBER
38 SECTION 5 METEOROLOGICAL CONDITIONS requirements. Navigation is typically performed by the use of radio navigational aids and vectors from ATC, in addition to the use of ATC-assigned routes and altitudes. As a result of the more stringent requirements due to limited visibility between aircraft, separation is increased during IMC which therefore reduces airspace and airfield capacity Runway Wind Coverage Aircraft arrival and departure runways are determined by wind direction, as aircraft generally takeoff and land into the wind. Due to limitations by aircraft type with regards to maximum allowable crosswind 1 for takeoff and landing, strong crosswinds may result in pilots having to divert to another airport if there is not a crosswind runway available. In order to quantify crosswind, pilots and airport planners calculate crosswind components based on wind direction and speed. Each aircraft type is certified to operate within a maximum crosswind component; larger, heavier aircraft are more resistant to wind and are generally able to operate with higher crosswinds, while smaller, lighter aircraft are more subject to wind and are therefore more restricted. The FAA recommends that airports provide at least 95 percent wind coverage for planning purposes under the limitations as defined below. If a single runway does not provide at least 95 percent wind coverage for the airport reference code (ARC), a crosswind runway should be considered. The ARC for LNA is B-II. ARC A-I and B-I: 10.5-knot maximum crosswind component ARC A-II and B-II: 13-knot maximum crosswind component ARC A-III, B-III, and C-I through D-III: 16-knot maximum crosswind component ARC A-IV through D-VI: 20-knot maximum crosswind component Table 5.1 summarizes wind coverage for LNA, with crosswind components of 10.5 knots, 13 knots, 16 knots, and 20 knots. Exhibits 5-1 through 5-3 graphically show coverage during good weather (VMC) conditions, poor weather (IMC) conditions, and all-weather conditions in the form of wind roses. The main runway (Runway 9/27) provides more than the 95 percent coverage recommended by FAA for the 13-knot crosswind component under VMC. During IMC, the main runway provides less than the recommended 95 percent wind coverage; however, for all-weather combined, the wind coverage is again greater than 95 percent. Additionally, when considered together, the combined three runway system provides greater than 95 percent coverage for all weather categories, for all crosswind components. 1 Crosswind is the velocity of wind at a right angle to the runway, calculated from the wind speed and heading in relation to the runway. 1-LNA_INVENTORY_OCTOBER
39 SECTION 5 METEOROLOGICAL CONDITIONS TABLE 5.1 LNA WIND COVERAGE: VMC, IMC, and All-Weather VMC 1 IMC 2 All-Weather True North Ceiling 1000' and Visibility 3 miles Ceiling < 1000' and Visibility < 3 miles All Weather Observations Recorded in the Period Heading 10.5 KTS 13 KTS 16 KTS 20 KTS 10.5 KTS 13 KTS 16 KTS 20 KTS 10.5 KTS 13 KTS 16 KTS 20 KTS Runway % 65.6% 67.4% 67.8% 31.2% 33.7% 35.6% 36.3% 62.2% 65.2% 67.0% 67.4% Runway % 41.8% 42.7% 42.9% 61.7% 64.8% 67.1% 68.1% 40.9% 42.1% 43.0% 43.2% Runway 9-27 Combined % 96.7% 99.4% 99.9% 84.7% 90.2% 94.3% 96.1% 92.4% 96.7% 99.3% 99.9% Runway % 62.7% 66.4% 67.3% 36.4% 38.3% 40.3% 41.5% 58.1% 62.4% 66.1% 67.0% Runway % 41.1% 42.8% 43.2% 57.9% 60.4% 62.7% 63.4% 39.5% 41.3% 43.0% 43.5% Runway Combined % 93.1% 98.5% 99.7% 85.9% 90.4% 94.6% 96.5% 86.9% 93.0% 98.4% 99.7% Runway % 57.0% 60.8% 61.5% 41.8% 44.4% 47.6% 49.6% 52.0% 56.8% 60.7% 61.4% Runway % 45.4% 48.5% 49.1% 48.4% 51.7% 54.1% 55.1% 42.5% 45.5% 48.5% 49.2% Runway 3-21 Combined % 91.6% 98.4% 99.7% 81.9% 87.8% 93.2% 96.3% 83.6% 91.5% 98.4% 99.7% All Runways Combined % 100.0% 100.0% 100.0% 98.2% 98.9% 99.2% 99.6% 99.9% 100.0% 100.0% 100.0% Source: CH2M HILL analysis based on National Climatic Data Center (NCDC) weather observations between 1996 and 2005 for the West Palm Beach Station # LNA_INVENTORY_OCTOBER
40
41
42
43 Technical Report #2 Palm Beach County Park Airport Demand/Capacity and Facility Requirements Palm Beach County Park Airport Prepared for Palm Beach County Department of Airports OCTOBER 2006 In Association with Ricondo & Associates, Inc.
44 Contents Section Page 1 Airfield Capacity Factors Affecting Airfield Capacity Airfield Configuration Aircraft Fleet Mix Weather Conditions Touch-and-Go Operations Airfield Demand/Capacity Analysis Hourly Airfield Capacity Annual Service Volume Navigational Aids Airport Design Standards Part 77 Surface Area Ground Access and Transportation Networks GA/Fixed Base Operator Facilities Aircraft Apron Areas Aircraft Hangars Automobile Parking Facilities FBO Terminal and Office Facilities Fueling Facilities Other Airport Support Facilities Tables 1-1 Aircraft Classes Affecting Airfield Capacity LNA Weather Data Classification and Occurrence LNA Practical Airfield Capacity Estimates LNA Runways Dimensional Standards General Aviation Operations and Based Aircraft Forecast Apron Area Requirements Summary Hangar Facility Requirements Summary Parking Requirements Summary FBO Terminal and Office Space Requirements Summary Fuel Facility Demand-Capacity Assessment Exhibit 1-1 Existing Airfield Configuration Existing Operating Configurations and Airfield Hourly Capacity Aircraft Apron Areas LNA_DEMANDCAP_OCTOBER2006 ii
45 SECTION 1 Airfield Capacity The purpose of the airfield demand/capacity analysis for the Palm Beach County Park Airport (LNA) was to determine the ability of the airfield to accommodate existing and forecast aircraft operations through the planning period (to 2025). Airfield demand/capacity was analyzed using the methodologies outlined in Federal Aviation Administration (FAA) Advisory Circular (AC) 150/5060-5, Change 2, Airport Capacity and Delay. This analysis, presented below, does not include delay calculations. 1.1 Factors Affecting Airfield Capacity Airfield capacity is defined as the maximum number of aircraft operations that an airfield can accommodate during a specified period of time. Typically, airfield capacity is determined for a peak-hour condition at an airport and varies according to weather conditions, type of aircraft, airfield configuration, and air traffic control (ATC) procedures. Because LNA does not have an airport traffic control tower (ATCT), an adjustment factor was considered in the analysis to account for unique conditions at such uncontrolled airports. The number and location of runway exits and the percentage of touch-and-go operations are other important factors that affect airfield capacity, and are discussed in the following subsections. The following terms, as defined by the FAA, are used in this analysis: Peak-Hour Capacity is the maximum number of aircraft operations that can occur in 1 hour under specific operating conditions. Annual Service Volume (ASV) is a reasonable estimate of an airport s annual capacity. In determining ASV, consideration is given to the hourly, daily, and seasonal variations in aircraft demand associated with the airfield and the occurrence of low visibility and/or cloud ceiling Airfield Configuration The number and orientation of the runways and the number, location, and type of runway exits are some of the primary factors that affect airfield capacity. The airfield configuration at LNA consists of three runways, Runway 15/33, Runway 9/27, and Runway 3/21, with parallel taxiways for Runways 15/33 and 9/27. All of the runway surfaces are composed of asphalt. Runway 15/33, the primary runway, is 3,426 feet long and 100 feet wide Runway 9/27 is 3,489 feet long and 75 feet wide Runway 3/21 is 3,256 feet long and 75 feet wide Aircraft operations occurring on intersecting runways are considered dependent because aircraft spacing must be adjusted to allow safe operations on the intersecting runway. This 2-LNA_DEMANDCAP_OCTOBER
46 SECTION 1 AIRFIELD CAPACITY spacing separation is dependent not only on the type of operation being conducted, but also on the distance from the runway end to the intersection. A longer distance decreases airfield capacity because a departing aircraft must clear the intersection before an arriving aircraft may land on the intersecting runway. Conversely, as this distance decreases, airfield capacity increases. At LNA, Runway 3/21 is only used three percent of the time, while Runway 9/27 and Runway 15/33 are used 21 percent and 75 percent of the time, respectively. Thus, the two intersecting runways, 15/33 and 9/27, are the primary runways of the airfield. When operating in west flow (i.e., departures on Runway 33 and Runway 27), airfield capacity is greater than when operating in east flow (i.e., departures on Runway 9 and Runway 15) since the runway intersection in the west flow configuration is almost immediately cleared after the operation begins. Runway occupancy time is also a primary factor affecting airfield capacity. The longer an aircraft remains on a runway, the fewer operations that can occur as two aircraft are not permitted to operate on a runway simultaneously. Runway occupancy time is a factor of the type of aircraft, pilot skill, and the number, location, and type of runway exits. When an arriving aircraft slows to a safe taxiing speed, it is imperative that a runway exit be available to minimize the aircraft s runway occupancy time, thereby increasing the airfield s capacity. At LNA, Runway 15/33 is served by a full parallel taxiway, Taxiway B. Taxiway C, serving Runway 9/27, is located south of the runway and adjacent to the aircraft apron area. Currently, no taxiways are serving Runway 3/21. For those taxiways serving Runways 15/33 and 9/27, the runway exit taxiways are mainly located at the midpoint (Taxiway A1 and B1) or at the end of the runways. Exhibit 1-1 illustrates the existing airfield configuration for LNA Aircraft Fleet Mix The types of aircraft operating at an airport are referred to as the aircraft fleet mix. This fleet mix determines aircraft spacing requirements, which, in turn, determines the aircraft mix index, discussed below. For example, if the fleet mix consists of all small, similarly sized aircraft with similar approach speeds, the spacing requirements are much smaller than for a fleet that consists of a mix of large jet aircraft and small piston-driven engine aircraft. This variance is due mainly to the aircraft s approach speed, but also involves factors such as aircraft weight and wake turbulence. If aircraft are not properly spaced and wake turbulence is an issue, safety is significantly compromised. However, with a fleet mix consisting mainly of small piston-driven aircraft and twin-engine aircraft, such as at LNA, wake turbulence is not a major concern. In this instance, where required aircraft separation is small, the hourly airfield capacity is increased because a greater number of aircraft can occupy the same amount of airspace. It should also be noted that jet aircraft and all other aircraft over 12,500 pounds are not permitted at LNA. Based on the Airport 2000 Master Plan, the most demanding aircraft likely to use the Airport is a Beech King Air. 2-LNA_DEMANDCAP_OCTOBER
47 Palm Beach County Park Airport Congress Avenue, SR 807 Runway (3,426 feet x 100 feet) Taxiway B Taxiway B Runway 3-21 (3,256 feet x 75 feet) Taxiway B1 Runway 9-27 (3,489 feet x 75 feet) Taxiway C Taxiway A1 Taxiway C Taxiway D Terminal FBO Building Lantana Road, SR 872 Source: Aerial Photo, Prepared by: Ricondo & Associates, Inc., June Exhibit ft. north Existing Airfield Configuration Drawing: P:\PBIA\System Wide Airport Master Planning Study - Phase II\Task 3 - Demand Capacity Analyses and Facility Needs\Exhibits\LNA\LNA_Exhibit 1-1.dwg_Layout: 1-1 Airfield layout_mar 01, 2007, 5:38pm Demand/Capacity Airfield Capacity June 2006
48 SECTION 1 AIRFIELD CAPACITY For the purpose of determining the airfield capacity at LNA, the aircraft fleet mix was used to determine the aircraft mix index, as stipulated in the FAA AC 150/5060-5, using the following formula: Mix Index = percent (C + 3D). This equation takes into account the number of Class C and D aircraft in the fleet mix, but does not include those aircraft in Classes A and B because they produce little wake turbulence and, therefore, require smaller spacing. Table 1-1 presents the different aircraft classes affecting airfield capacity. TABLE 1-1 Aircraft Classes Affecting Airfield Capacity Aircraft Class Maximum Certified Takeoff Weight Number of Engines Wake Turbulence Classification A Less than 12,500 pounds Single Small B Less than 12,500 pounds Multi Small C Greater than 12,500 pounds, but less than 300,000 pounds Multi Large D Greater than 300,000 pounds Multi Heavy Source: FAA AC 150/5060-5, Change 2, Airport Capacity and Delay. Prepared by: Ricondo & Associates, Inc., May Weather Conditions Weather conditions also play a significant role in airfield capacity. In particular, wind speed, cloud ceiling, and visibility are key factors in airfield capacity. Wind direction is the main factor that determines which runway is operational at a specified time since aircraft typically land and take off into the wind. Aircraft have maximum tailwind and crosswind components under which they can safely operate, and once those components are exceeded, it is no longer safe for the aircraft to operate on the runway. Unsafe wind conditions can lead to a runway operating configuration that may not result in maximum airfield capacity. In addition to wind speed, cloud ceiling and visibility also affect airfield capacity. Two main types of weather conditions are used in aviation, visual meteorological conditions (VMC) under which visual flight rules (VFR) are in effect, and instrument meteorological conditions (IMC), under which instrument flight rules (IFR) are in effect. Under VFR, the cloud ceiling must be equal to or greater than 1,000 feet above ground level (AGL) and visibility must be equal to or greater than three statute miles. VMC is considered good weather that does not negatively affect airfield capacity. Under IFR, visibility ranges from the lowest published approach minimum to just below three statue miles, and cloud ceiling height begins at the lowest published approach minimum and ends below 1,000 feet. LNA has only one published instrument approach procedure (IAP): a very high frequency Omnidirectional range (VOR) or global positioning system (GPS) approach for Runway 15, with a minimum ceiling height of 620 feet, and a minimum visibility of 1 statute mile. The Airport is closed when the weather conditions are below these minimums. The 10-year averaged weather data used for LNA was obtained from the National Climatic Data Center from January 1, 1995, to December 31, Table 1-2 summarizes the classification of weather conditions at LNA, as well as the occurrence for each of those weather conditions. 2-LNA_DEMANDCAP_OCTOBER
49 SECTION 1 AIRFIELD CAPACITY TABLE 1-2 LNA Weather Data Classification and Occurrence Weather Conditions Ceiling Height Visibility Weather Occurrence (Percent) VFR 1,000 feet or above Greater or equal to three statute miles 98.8 percent IFR Greater or equal to 620 feet, but less than 1,000 feet Greater or equal to one statute mile, but less than three statute miles 0.7 percent Airport Closed Less than 620 feet Less than one statute mile 0.5 percent Sources: National Climatic Data Center, Palm Beach International Airport Weather Station, January 1994 to December Prepared by: Ricondo & Associates, Inc., May Touch-and-Go Operations The percentage of touch-and-go operations that are conducted at an airport plays an important role in calculating airfield capacity because, unlike most arriving aircraft, those conducting touch-and-go operations land and immediately take off again without stopping or exiting the runway, thereby significantly reducing the amount of time the aircraft occupies the runway which increases airfield capacity. Based on discussions with the DOA General Aviation Airports Manager, 40 percent of the total operations at LNA are estimated to be touch-and-go operations, reflecting the large amount of training operations occurring at the Airport. 1.2 Airfield Demand/Capacity Analysis Existing airfield capacity is measured by hourly capacity and ASV. Hourly capacities were calculated for each airfield operating configuration at LNA under VFR and IFR conditions. Ultimately, a weighted hourly capacity for the airfield, a key factor in calculating ASV, was determined. It should be noted that the methodology for calculating airfield demand/capacity presented in FAA AC 150/ provides a theoretical airfield capacity considering a towered airfield in which aircraft separations are strictly dictated by ATCT personnel. As previously stated, however, LNA is a non-towered airfield. Thus, aircraft are not separated as expected in a controlled environment. At non-controlled airfields, right-of-way rules and airport traffic patterns and procedures govern the operating environment for one purpose only: to prevent collisions in the air and on the ground. Traffic separation is the primary concern. However, the above rules are based on the concept of to see and be seen, therefore, aircraft lateral separations can vary by operator. In addition, it must be kept in mind that the airfield capacity calculation is determined for a peak-hour operating condition. When compared to the theoretical airfield capacity of a controlled airfield, one can argue that the airfield capacity at a non-towered airport is greater than that of a controlled airfield because aircraft lateral separations are less in a non-controlled environment. The opposite argument is that the airfield capacity at a non-towered airfield cannot be greater than the theoretical capacity 2-LNA_DEMANDCAP_OCTOBER
50 SECTION 1 AIRFIELD CAPACITY of a controlled airfield. The logic behind that argument being that in a peak-hour condition, it is unrealistic to assume that all aircraft, mostly single-engine and twin-engine, operate as efficiently as they would with a towered airport for a few reasons. First, not all pilots adhere to standard non-towered airport procedures. Second, instrument approaches present specific challenges at non-towered airfields. Pilots practicing instrument approaches frequently make straight-in approaches to the approach end of the active runway. This is a potentially confusing situation for VFR pilots flying a standard traffic pattern to the active runway. Based on the above discussion, the airfield demand/capacity presented in this report shows the peak-hour theoretical airfield capacity, as well as a calibrated airfield capacity to account for the non-towered condition at LNA. In an effort to not over or underestimate the airfield capacity at the Airport, the calibrated airfield capacity, referenced above considered a 10 percent adjustment factor below the theoretical capacity in order to reflect what actual operating conditions would be Hourly Airfield Capacity Exhibit 1-2 illustrates the existing airfield operating configurations at LNA, weather occurrence for each operating configuration, and airfield capacity values. As shown in Exhibit 1-2, there are four main airfield operating configurations: (1) VFR East, (2) VFR West, (3) IFR East, and (4) IFR West. The percent weather occurrence (0.5 percent) is also shown for weather conditions below the minimums published, when the Airport is closed. In VFR East flow, aircraft arrive on Runway 9 and depart on Runway 9 and Runway 15. This configuration occurs 60 percent of the time, and has a theoretical hourly capacity of 116 operations and a calibrated hourly capacity of 104 operations. In the opposite flow, VFR West, aircraft arrive on Runway 27 and depart on Runway 27 and Runway 33. This configuration occurs 38.8 percent of the time, and has a theoretical hourly capacity of 118 operations and a calibrated hourly capacity of 106 operations. In the IFR East flow, aircraft depart on Runway 9 and arrive on Runway 15 using the instrument approach. This configuration occurs 0.3 percent of the time, and provides a theoretical and calibrated hourly capacity of 63 and 57 operations, respectively. In the IFR West flow, aircraft depart on Runway 27 and arrive on Runway 33 using an instrument approach to Runway 15, followed by a circle-to-land procedure to Runway 33. This configuration occurs 0.4 percent of the time, and provides a theoretical hourly capacity of 64 operations and a calibrated hourly capacity of 58 operations. The weighted average hourly capacity for the Airport totaled 113 operations for the theoretical capacity and 102 operations for the calibrated capacity. These capacities form the basis for determining the ASV for the current and future airfield at LNA. 2-LNA_DEMANDCAP_OCTOBER
51
52 SECTION 1 AIRFIELD CAPACITY Annual Service Volume The airfield hourly capacity previously presented only accounts for a single peak hour in a single day. The ASV, however, is an estimate of the Airport s annual capacity. Table 1-3 summarizes the ASV values for the planning horizon for the Airport. As shown, these values are compared to the existing and projected annual aircraft operations demand levels. When annual demand exceeds the ASV of the airfield, delay increases at an exponential rate. In order to minimize delay, the FAA recommends that planning for additional airfield facilities should be initiated when the airfield s annual demand exceeds 60 percent of the ASV. The annual demand for LNA, however, does not reach 60 percent of the ASV over the planning horizon in either the theoretical or calibrated scenario. Therefore, additional airfield facilities for LNA are not required through the forecast period, and the existing airfield is adequate to serve future demand levels through TABLE 1-3 LNA Practical Airfield Capacity Estimates Annual Operations (i.e., demand) 155, , , , ,649 Annual Service Volume (theoretical) 1/ 495, , , , ,445 Annual Operations as a Percent of ASV 31.5% 34.3% 37.4% 40.7% 44.3% Annual Service Volume (calibrated) 2/ 447, , , , ,139 Annual Operations as a Percent of ASV 35% 38.0% 41.4% 45.1% 49.1% Sources: FAA Terminal Area Forecast, February 2006; Ricondo & Associates, Inc., May Prepared by: Ricondo & Associates, Inc., May Notes: 1/ Theoretical hourly capacities were obtained from FAA AC 150/5060-5, Airport Capacity and Delay. 2/ In an effort to not overestimate or underestimate the airfield capacity at the Airport, the calibrated airfield capacity considered a 10 percent adjustment below the theoretical capacity in order to reflect what actual operating conditions could be at LNA. 1.3 Navigational Aids Runway approach instrumentation, lighting, and other navigational aids (NAVAIDs) provide pilots with the necessary means to navigate aircraft safely and efficiently in most weather conditions. The facilities provided at LNA were described in Chapter One of this Master Plan Update, Inventory. The following navigational facilities at LNA are sufficient to serve the Airport s needs: Nonprecision approach Runway 15 is served by a very high frequency omnidirectional range (VOR) located at PBI, with distance measuring equipment (DME). The other nonprecision instrument approach available at LNA, also on Runway 15, is a global positioning system (GPS). Lighting All runways at LNA are equipped with medium intensity runway lights (MIRLs), and precision approach path indicators (PAPIs). 2-LNA_DEMANDCAP_OCTOBER
53 SECTION 1 AIRFIELD CAPACITY 1.4 Airport Design Standards For airfield planning purposes, the ARC, along with the approach visibility minimums, directly affect the size of the surfaces associated with each runway, including the Runway Safety Area (RSA), Runway Obstacle Free Zone (OFZ), Runway Object Free Area (OFA), and Runway Protection Zone (RPZ). Table 1-4 depicts the standard dimensions for B-II and B-I runways, along with the surface dimensions that exist for each runway at LNA. As shown, the Airport meets all criteria outlined in FAA AC 150/ , Airport Design. TABLE 1-4 LNA Runway Dimensional Standards Existing Runway Dimensions (Standard Dimensions in Bold) [feet] B-II B-I Design Criteria Standard Dimensions Standard Dimensions 3 21 Runway Width Runway Safety Area - Width Length Beyond Rwy End Runway Object Free Area - Width Length Beyond Rwy End Runway Protection Zone - Inner Width Outer Width Length 1,000 1,000 1,000 1,000 1,000 1,000 1,000 1,000 Runway Obstacle Free Zone - Width Length Beyond Rwy End Source: FAA AC , Change 10, Airport Design. Prepared by: CH2M HILL, October Part 77 Surface Area Federal Aviation Regulations (FAR) Part 77, Objects Affecting Navigable Airspace, establishes standards for determining which structures pose potential obstructions to air navigation. This is accomplished by defining specific Imaginary Surfaces around an airport that should not contain any protruding objects. Objects affected include existing or proposed objects of natural growth, terrain, or construction, including equipment, which is permanent or temporary in character. Dimensions of Part 77 surfaces (primary, approach, transitional, conical, and horizontal) vary depending on the type of runway approach. These surfaces are analyzed in the Airport Plans section. 2-LNA_DEMANDCAP_OCTOBER
54 SECTION 2 Ground Access and Transportation Networks The existing road structure offers excellent regional access to LNA and is considered to be adequate. 2-LNA_DEMANDCAP_OCTOBER
55 SECTION 3 GA/Fixed Base Operator Facilities The GA/FBO demand/capacity and facility requirements analyses for the general aviation/fixed base operator (FBO) facilities included consideration of tenant facilities serving based and transient general aviation aircraft, the latter of which may require temporary aircraft storage or other services. Aircraft apron areas, aircraft hangars, automobile parking areas associated with aircraft hangars, FBO terminal and office facilities, and fueling facilities were considered in this analysis. Currently, Florida Airmotive is the only FBO at LNA, and acts as a landlord to all of the tenants operating at the Airport. The one-story FBO terminal building provides approximately 3,980 feet of floor area and was originally constructed in the 1950s. Florida Airmotive provides ramp area leasing, fueling services, hangar leasing, and office leasing. The overall FBO terminal needs at LNA were also analyzed. The GA operations forecast, obtained from the FAA Terminal Area Forecast (TAF), formed the basis for determining facility requirements. In 2005, a total of 155,588 GA operations were conducted at LNA. Annual aircraft operations at the Airport are projected to be 219,649 by 2025, representing an average annual growth rate of 1.7 percent. Similarly, the number of based aircraft, which consist mostly of single engine aircraft, is forecast to increase from 386 in 2005 to 527 in Table 3-1 summarizes the FAA TAF for GA operations and based aircraft at the Airport. TABLE 3-1 General Aviation Operations and Based Aircraft Forecast Existing (2005) Annual Operations 155, , , , ,649 Based Aircraft Sources: FAA Terminal Area Forecast, February 2006; Ricondo & Associates, Inc., May Prepared by: Ricondo & Associates, Inc., June The analysis of apron, hangars, associated automobile parking, FBO terminal and office, and fueling facilities at LNA is presented in the following subsections. 3.1 Aircraft Apron Areas There is one main apron area, which is located west of the terminal building and south of Taxiway A1. This apron area encompasses approximately 646,380 square feet of space, and is primarily used by based aircraft. Transient aircraft share a portion of the apron area just north of the terminal with based aircraft belonging to the Palm Beach Flight Training School, which leases office space in the terminal. The eastern area of the apron is also occupied by based aircraft. Discussions with the FBO manager revealed that the existing apron is currently at capacity. In some instances, the FBO has had to park aircraft on the 2-LNA_DEMANDCAP_OCTOBER
56 SECTION 3 GENERAL AVIATION/FIXED BASE OPERATOR FACILITIES grass. Given the existing fleet of single-engine aircraft occupying the apron, future apron needs were based on the average apron area required to accommodate one aircraft. This area was calculated by dividing the total ramp area by the total number of existing tiedowns (232). However, due to insufficient data as to what area is considered to be the transient apron versus the based aircraft apron, future apron needs were calculated at a gross level of detail. As a result, the average apron area required to accommodate one aircraft on the ramp was approximately 2,800 square feet. This area consists of the equivalent space to accommodate a single-engine aircraft (PA-28) with one taxilane and the required object free area (OFA) clearances. The apron areas are illustrated in Exhibit 3-1. The next step of the analysis is to determine how many aircraft require apron space. Due to a lack of actual monthly aircraft operation counts, it was estimated that operations in the peak month represented approximately 10 percent of annual aircraft operations. This estimate is consistent with the GA activity at Palm Beach International Airport (PBI). The peak month average day operations were derived by dividing the number of peak month operations by 31 (assuming that the peak month is March, similar to PBI). To account for busy day conditions, FAA AC 150/ recommends considering that activity on a busy day is 10 percent higher than on an average day. As a worse case scenario, it was assumed that all aircraft using the Airport on the peak month busy day needed to be accommodated on the apron. On that basis, it was determined that 285 aircraft required apron space in By 2025, an estimated 403 aircraft would require ramp space at LNA. Table 3-2 summarizes the total apron requirements for the Airport. 2-LNA_DEMANDCAP_OCTOBER


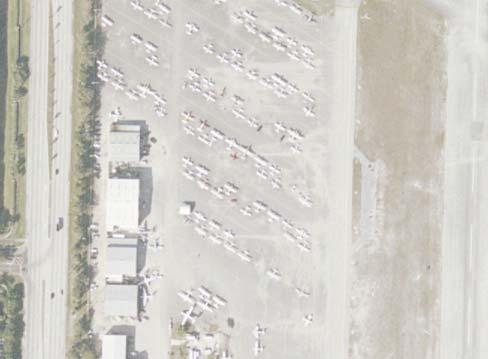
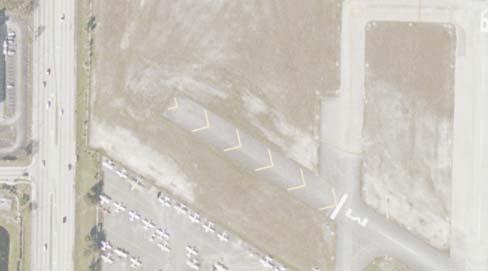
57
58 SECTION 3 GENERAL AVIATION/FIXED BASE OPERATOR FACILITIES TABLE 3-2 Apron Area Requirements Summary Existing Apron (2005) Actual Surplus Deficiency Recommended 4/ Annual General Aviation Operations 155,588 n/a n/a n/a 169, , , ,649 Peak Month Operations 15,559 n/a n/a n/a 16,990 18,508 20,162 21,965 Peak Month Average Day 519 n/a n/a n/a Peak Month Busy Day 1/ 570 n/a n/a n/a Number of Aircraft on Ground 285 n/a n/a n/a Total Apron (Square Feet) 2/ 646,380 - (148,346) 3/ 794, , ,358 1,029,863 1,121,942 Percent Increase From Existing Conditions 23% 34% 46% 59% 74% Target Ratio: 2,800 Square Feet per aircraft on the ramp Sources: Palm Beach County Department of Airports, May 2006; Ricondo & Associates, September 2005; Ricondo & Associates, May Prepared by: Ricondo & Associates, Inc., June Notes: 1/ Accounts for 10 percent increase in activity for busy day conditions. 2/ Assuming an average of 2,800 Square Feet per aircraft on the apron. This area is representative of a single engine airplane with one taxilane and object free area clearances. 3/ Identified based on existing aircraft on the apron and an average of 2,800 square feet per aircraft on the ramp. 4/ Represents the recommended apron for 2005 based on existing demand at the Airport. 3.2 Aircraft Hangars Hangar types at the Airport include conventional, port-a-port, and t-hangars, which together encompass a total aircraft storage capacity of 263,400 square feet. Of this total, approximately 177,586 square feet is dedicated to privately owned hangars, which were built and are maintained by private owners. Additionally, 11,488 square feet of hangar space is operated by Florida Airmotive, which leases these hangars to private owners. The remaining 74,326 square feet of hangar space is dedicated to businesses operating at the Airport, and are mostly conventional type hangars. The Airport FBO manager presently has a waiting list of approximately 150 people requesting additional hangars (mainly t-hangars). According to the Palm Beach County Department of Airports (PBC DOA), 19 new t-hangars are anticipated to be built this year at LNA. Given the existing demand for t-hangars, it was assumed that 1,400 square feet would be required per based aircraft stored in t-hangars. Based aircraft stored in hangars were estimated by discounting all aircraft accommodated at tiedowns on the ramp, including transient aircraft, which represent approximately 20 percent of the activity at the Airport. Table 3-3 summarizes the hangar facility requirements at LNA. As shown, the existing hangar space is currently 63 percent deficient. In 2025, the hangar space required at the Airport is expected to more than double. Table 3-3 Hangar Facility Requirements Summary Existing 1/ Hangar Space (square feet) 6/ 290, , , , ,753 Percent Increase from Existing Conditions 19% 38% 59% 81% Sources: Palm Beach County Department of Airports, May 2006; Ricondo & Associates, May Prepared by: Ricondo & Associates, Inc., June Notes: 1/ Includes the 19 new t-hangars anticipated in / Assumes the existing facilities at capacity, and that no one on the waiting list is added as current demand. 2-LNA_DEMANDCAP_OCTOBER
59 SECTION 3 GENERAL AVIATION/FIXED BASE OPERATOR FACILITIES 3.3 Automobile Parking Facilities Two main areas associated with the hangar areas at the Airport are dedicated to automobile parking. One area is on the western end of the airfield and encompasses 16,700 square feet of space. The second area is south of and adjacent to the t-hangars and the three large adjacent conventional hangars operated by Windward Aviation, Premier Aviation, Palm Beach Helicopters, and Air Coastal Helicopters. This area accounts for 9,450 square feet of space. Combined, these areas account for 54 automobile parking positions. Automobile parking requirements associated with the required hangar facilities identified in Table 3-3 were also analyzed. Using a ratio of parking area to building space, the automobile parking requirements for the Airport were determined and are summarized in Table 3-4. Table 3-4 Parking Requirements Summary Existing 1/ Parking Area (square feet) 29,076 38,084 44,177 50,655 57,833 Percent Change from Existing Conditions 31% 52% 74% 99% Target Ratio: 0.11 Square feet of parking area per square foot of hangar Sources: Palm Beach County Department of Airports, May 2006; Ricondo & Associates, May Prepared by: Ricondo & Associates, Inc., June Note: 1/ Includes the parking facilities for the 19 new t-hangars anticipated in FBO Terminal and Office Facilities These facilities encompass a total area of approximately 14,000 square feet and include the FBO terminal building, Palm Beach Helicopters, Air Coastal Helicopters, Kemper Aviation, the Civil Air Patrol, and the Department of Airports office trailer. The analysis for the FBO terminal and office spaces was based on the total square footage of facilities per annual aircraft operation. Table 3-5 summarizes the results of the analysis. As shown, by 2025, the required FBO terminal and office space will increase by approximately 41 percent from existing conditions. 2-LNA_DEMANDCAP_OCTOBER
60 SECTION 3 GENERAL AVIATION/FIXED BASE OPERATOR FACILITIES TABLE 3-5 FBO Terminal and Office Space Requirements Summary Existing (2005) Annual Aircraft Operations 155, , , , ,649 FBO Terminal and Office Space (square feet) 1/ 14,000 15,288 16,654 18,142 19,764 Percent Increase From Existing Conditions 9.2% 18.9% 29.5% 41.2% Target Ratio: 0.1 square foot per annual operation 1/ Sources: PBC DOA, May 2006; Ricondo & Associates, Inc., May Prepared by: Ricondo & Associates, Inc., June Note: 1/ This ratio is also comparable to F45 and the Boca Raton Airport (BCT). Based on future terminal/office space requirements for LNA and the anticipated demand levels (i.e., annual aircraft operations), it is reasonable to assume the consideration for a second FBO at the Airport over the planning horizon. To that affect, and consistent with other FBOs constructed at other GA airports (i.e., Avitat at BCT, a planned second FBO at Vandenberg Airport), it is estimated that a parcel of approximately 12 acres should be preserved. This parcel would allow for future FBO facilities, including a terminal building, maintenance hangars, storage hangars, aircraft apron, a fuel farm, and automobile parking areas. 3.5 Fueling Facilities The demand/capacity analysis for fueling facilities considered the facilities serving the Airport operated by Florida Airmotive, the sole FBO at LNA. This analysis was based on the number of days of reserve fuel supply the facilities accommodate, which is critical in the event of a fuel supply disruption. To conduct this evaluation, the existing fueling capacities were obtained from the Airport Manager, and historic fuel flowage data were obtained from the PBC DOA. The data were provided separately by fuel type based on information provided through tenant interviews (75 percent AvGas and 25 percent Jet-A fuel). Additionally, annual aircraft operations data were obtained from the FAA TAF, February These operations, separated by type, form the basis for determining which operations use which fuel type. For example, based on tenant interviews, as well as the FAA TAF, it was determined that air taxi and military operations used Jet-A fuel, while the remaining GA operations were assumed to use AvGas. The 75-percent use of AvGas also accounted for the high number of touch-and-go operations at the Airport (40 percent). Based on this information, a ratio comparing fuel demand to the number of operations was established. Fuel demand (separated by fuel type) was then forecast over the planning period based on the ratio. Determining the existing and projected fuel supply was the final step in this process. Existing fuel capacity was compared to annual fuel demand, and then 2-LNA_DEMANDCAP_OCTOBER
61 SECTION 3 GENERAL AVIATION/FIXED BASE OPERATOR FACILITIES converted into a projected fuel supply (expressed in days). This number was compared to the recommended three-day fuel supply to determine if any deficiencies existed. Table 3-6 illustrates the results of the demand/capacity analysis conducted for the fueling facilities at LNA, and includes annual operations, current annual fuel demand, fuel demand per operation ratio, and projected fuel supply by year and fuel type. As shown in Table 3-6, the projected fuel supply for both AvGas and Jet-A fuel throughout the planning period is well above the recommended supply of three days. Therefore, the current fueling facilities were determined to be adequate to serve the Airport through the planning period. Additionally, while the demand for self-fueling is unknown at this time, a potential location for this activity is shown on the ALP should the need arise. 2-LNA_DEMANDCAP_OCTOBER
62 SECTION 3 GENERAL AVIATION/FIXED BASE OPERATOR FACILITIES TABLE 3-6 Fuel Facility Demand-Capacity Assessment Jet-A AvGas 2005 Annual Operations , Annual Fuel Demand (gallons) 83,708 1/ 251,125 1/ 2005 Average Fuel Demand Per Operation (gallons) 3/ Forecast: 2/ 2010 Annual Operations 4/ , Projected Fuel Demand (gallons) 83, , Annual Operations 4/ , Projected Fuel Demand (gallons) 83, , Annual Operations 4/ , Projected Fuel Demand (gallons) 83, , Annual Operations 4/ , Projected Fuel Demand (gallons) 83, ,031 Existing Fuel Capacity (gallons) 10,000 15,000 Existing Fuel Supply ( days) Projected Fuel Supply (days) Projected Fuel Supply (days) Projected Fuel Supply (days) Projected Fuel Supply (days) Recommended Fuel Supply (days) 5/ 3 3 Source: Ricondo & Associates, Inc. May 2006; Tenant Interview, May 2006; FAA TAF, February Prepared by: Ricondo & Associates, Inc. May Notes: 1/ Assuming that 25% of FBO customers use Jet-A fuel and 75% use AvGas based on interview with FBO manager; Air Taxi and military operations are the only ones using Jet A fuel. 2/ Based on the FAA TAF for air taxi operations, demand for jet A fuel is assumed constant. 3/ Estimated 2005 Annual Fuel Demand based on data obtained through Palm Beach County Department of Airports. 4/ GA forecast reflects FAA TAF, February / Typically, a three day capacity is the recommended capacity. 2-LNA_DEMANDCAP_OCTOBER
63 SECTION 4 Other Airport Support Facilities Support facilities at an airport provide services to the airport and aircraft that use the airport. These facilities include aircraft rescue and fire fighting (ARFF), air cargo, and airport maintenance. FAR Part 139 requires an ARFF station at commercial service airports. ARFF stations are not required at GA airports such as LNA. The Palm Beach County Fire Rescue station provides fire fighting and rescue services to LNA, as required. The Department of Airports is responsible for all airfield maintenance at LNA, as well as maintenance of the buildings owned by the County, including the Civil Air Patrol building, the building leased by Kemper Aviation, and the Department s office building. Maintenance is the responsibility of the tenants for various buildings at the airport. There are currently no air cargo operations at the Airport, and none are expected through the planning horizon. 2-LNA_DEMANDCAP_OCTOBER
64 Technical Report #3 Palm Beach County Park Airport Environmental Overview Palm Beach County Park Airport Prepared for Palm Beach County Department of Airports NOVEMBER 2006
65 Contents Section Page 1 Introduction Environmental Impacts Fish, Wildlife and Plants Hazardous Materials, Pollution Prevention and Solid Waste Light Emissions and Visual Impacts Socioeconomic Impacts, Environmental Justice and Children s Health and Safety Risks Water Quality Mitigation and Permitting Further NEPA Processing Mitigation Permitting Tables 2-1 LNA Environmental Impact Summary Required Permits/Actions for the Proposed Measures LNA_ENV-OVERVIEW_NOVEMBER 2006
66 SECTION 1 Introduction The purpose of this chapter is to provide an overview of potential environmental impacts associated with long-term development identified in this Master Plan Update. The environmental resources evaluated include those typically considered by the National Environmental Policy Act (NEPA) and Federal Aviation Administration (FAA) Orders B, National Environmental Policy Act (NEPA) Implementing Instructions for Airport Actions (April 2006), and E, Environmental Impacts: Policies and Procedures (March 2006). Section 2 of this chapter provides an overview of potential impacts to the environment that could result from the proposed projects at Palm Beach County Park Airport (LNA). Section 3 provides a summary of permits and mitigation that may be required for construction and operation of the proposed improvements. This qualitative impact analysis is based on current information. Prior to FAA approval for the projects recommended in this Master Plan Update, further evaluation of the impacts to identified resources will need to occur. Impacts to each of the environmental resources categories were evaluated within a study area of one-half mile from the airport boundary based on the Palm Beach County Park Airport Environmental Constraints Inventory (CH2M HILL, 2005), as well as state and county websites. 3-LNA_ENV-OVERVIEW_NOVEMBER
67 SECTION 2 Environmental Impacts As detailed in the Alternatives Analysis of this Master Plan Update, a phased approach involving different runway configurations is being considered at LNA. It is both wise and prudent to assess in a qualitative manner the potential environmental impacts associated with the two phases, and to consider the impacts of each. The phases entail the status quo, i.e., maintaining the existing three-runway configuration at LNA in the short-term, and eliminating one runway to provide additional apron and hangar space in the long-term. The current three-runway configuration (Phase I) has the following components specific to it: Avigation easements for properties within the Runway Protection Zone (RPZ) off the Runway 3 approach end for parcels that will not be acquired in fee simple; Construction of approximately 64,000 square feet of apron to meet short-term aircraft parking demand; Construction of four conventional hangars and one t-hangar west of Runway 3/21; Additional vehicle parking and a new access road to accompany the new hangars; Runway End Identifier Lights (REIL) at the ends of Runways 9/27 and 15/33; Reduction of Runway 15/33 width from 100 feet to 75 feet; New helicopter parking to the east of the existing helicopter parking; Avigation easements for parcels within the RPZ for Runways 33 and 9 that will not be acquired in fee simple; Non-aviation commercial development totaling 33 acres on airport property (Parcels 4 and 5) along Congress Avenue; Reconstruction of existing hangars damaged during the hurricane season, and construction of new t-hangars and conventional hangars on the south side apron; Demolition or relocation of existing hangars on the south side of the airport that violate the Object Free Area (OFA) for Runway 15/33; and Construction of a new access road from Congress Avenue, which may entail property acquisition and impacts to wetlands, for access to the new corporate hangars west of RW 3/21, and construction of additional vehicle parking. The two-runway configuration (Phase II) is the ultimate layout for long-term, post 2018, and has these additional components: Decommissioning of Runway 3/21 and its conversion to Taxiway D; Construction of T-hangar structures in the runway midfield area; and 3-LNA_ENVOVERVIEW#2.DOC 2 2-1
68 SECTION 2 ENVIRONMENTAL IMPACTS Construction of approximately 410,000 square feet of additional apron to meet projected aircraft parking demand. Table 2-1 summarizes the environmental impacts that may result from the projects proposed at LNA. For categories with potential impacts, a brief summary follows. TABLE 2-1 LNA Environmental Impact Summary Environmental Category Air Quality Coastal Resources Compatible Land Use Construction Impacts Department of Transportation Act, Section 4(f) Farmlands Fish, Wildlife and Plants Floodplains Hazardous Materials, Pollution Prevention and Solid Wastes Historical, Architectural, Archeological, and Cultural Resources Light Emissions and Visual Impacts Natural Resources and Energy Supply Noise Resources in Study Area and Impacts Identified In attainment area. Proposed projects will not generate additional aircraft or vehicle traffic; therefore, no increase in or impacts from emissions due to proposed projects. Within state coastal zone boundary. Consistency determination required. Structures to be acquired to the north of Runway 15. Demolition of structures and relocation of individuals and/or businesses requires additional analyses and adherence to Uniform Relocation and Real Property Acquisition Policies Act. Reconstruction of hangars damaged by hurricanes. Demolition or relocation of hangars presently within the Object Free Area for Runway 15/33. Structures to be demolished/rehabbed/relocated require inspection for asbestos, lead-based paint, hazardous materials and so on; if found, specific demolition and disposal procedures are triggered. Three parks located within study area: John Prince Park, Paul Kents Park and a recently-constructed one on the county-owned Nealon Property. No impacts to 4(f) properties foreseen. None present in study area Gopher frog (Rana capito) and a gopher tortoise (Gopherus polyphemus) have been known to occur in study area. Potential Habitat for Rare Species identified in John Prince Park. Coordination with U.S. Fish and Wildlife Service and FL Fish and Wildlife Conservation Commission required in NEPA process. Portions of airport located within the 500-year floodplain (Zone B). Some airport property bordering Lake Osborne falls within the 100- year floodplain, but no work will occur in these areas. No impact to the 100-year floodplain foreseen. Four on-airport businesses have been cited for improper handling of hazardous materials and are now working to comply with the Resource Conservation and Recovery Act (RCRA). Reconstruction/demolition/ relocation of hangars require inspection for asbestos, lead-based paint, hazardous materials and so on; if found, specific demolition and disposal procedures are triggered. No historic resources known to exist in study area. However, coordination with State Historic Preservation Officer (SHPO) required as integral part of NEPA process. REIL to be installed on Runways 9/27 and 15/33; 15/33 may also get a non-directional beacon (NDB). Given distance and screening between runway ends and adjacent properties, no impacts are projected. None anticipated Proposed projects will not generate additional aircraft or vehicle traffic; 3-LNA_ENV-OVERVIEW_NOVEMBER
69 SECTION 2 ENVIRONMENTAL IMPACTS Environmental Category Socioeconomic Impacts, Environmental Justice, and Children s Environmental Health and Safety Risks Water Quality Wetlands Wild and Scenic River Prepared by: CH2M HILL Resources in Study Area and Impacts Identified therefore, no impacts from noise due to proposed projects anticipated. Property acquisitions at north end of Runway 15/33 and avigation easements at ends of Runways 3, 33 and 9 to control heights and land use in these areas. Non-aviation-related commercial development planned for two airport-owner parcels along Congress Avenue. No impacts foreseen due to these acquisitions and development. One airport configuration scenario entails a new stormwater detention area. As the airport is located in the streamflow and recharge zones of the Biscayne sole source aquifer, coordination with the South Florida Water Management District and the U.S. Environmental Protection Agency is required through the NEPA process. No adverse impacts to surface water and groundwater quality are anticipated and Best Management Practices are to be pursued in all construction projects. Palustrine emergent and scrub shrub wetlands along north/northwest/ west boundary of airport. Minor fill may be required for construction of new access road from Congress Avenue. A more precise delineation of wetland boundaries required and recommended to quantify any impacts to wetlands. None present in study area 2.1 Fish, Wildlife and Plants The FL Natural Areas Inventory database indicates recorded occurrences at LNA in 1994 of a gopher frog (Rana capito) and a gopher tortoise (Gopherus polyphemus), listed as State Species of Special Concern. 1 Coordination with the U.S. Fish and Wildlife Service and the FL Fish and Wildlife Conservation Commission will be required. 2.2 Hazardous Materials, Pollution Prevention and Solid Waste Hangars (and surrounding soils) falling within the OFA at the south end of Runway 15/33 should be evaluated for evidence of spills, hazardous materials, asbestos, lead-based paint and so on prior to demolition or relocation. 2.3 Light Emissions and Visual Impacts Runway End Identifier Lights (REIL) to be installed on Runways 9/27 and 15/33; 15/33 may also get a non-directional beacon (NDB). Given distance and screening between runway ends and adjacent properties, no impacts are projected. 2.4 Socioeconomic Impacts, Environmental Justice and Children s Health and Safety Risks A number of properties would be acquired at the north end of Runway 15/33. As such, an analysis would need to be completed to evaluate whether these acquisitions result in a 1 A population which warrants special consideration because it has an inherent significant vulnerability which, in the foreseeable future, may result in its becoming a threatened species. 3-LNA_ENV-OVERVIEW_NOVEMBER
70 SECTION 2 ENVIRONMENTAL IMPACTS disproportionately high and adverse impact on low-income or minority communities. An unknown number of non-residential relocations may also need to occur, depending on which parcels are acquired in fee simple. Relocations would need to occur in accordance with the Uniform Relocation and Real Property Acquisition Policies Act of 1970, as amended. 2.5 Water Quality The ultimate long-term configuration entails an expanded stormwater detention basin in the runway midfield area. As the airport is located in the streamflow and recharge zones of the Biscayne sole source aquifer, coordination with the South Florida Water Management District and the U.S. Environmental Protection Agency is required through the NEPA process. Given nature of the proposed development, Best Management Practices should prevent any damage to the identified resources. No adverse impacts to surface water and groundwater quality are anticipated. 3-LNA_ENV-OVERVIEW_NOVEMBER
71 SECTION 3 Mitigation and Permitting 3.1 Further NEPA Processing It is recommended that the proposed development program be assessed under a single Environmental Assessment (EA) prepared in accordance with FAA Orders B and E. This all-inclusive approach presents economies of scale for DOA and enables the cumulative impacts, if any, of the projects to be assessed at one time. Also, the EA process would trigger consultation/coordination with various agencies and authorities where conceptual mitigation plans and proposals could be aired and assessed. As early mitigation planning and permitting are proven means of expediting projects, it is recommended that the EA process also include elements of both. 3.2 Mitigation The proposed developments at LNA present little likelihood of environmental impact, and that foreseen is mitigated readily. For the most part, potential impacts are foreseen around the proposed acquisition/demolition/relocation of hangars and other properties on- and off-airport. Prior to any action on properties to be acquired, demolished or relocated, the structures should be assessed for the presence of asbestos, lead-based paint, mercury light ballasts, hazardous wastes, underground tanks and so on. The results of these assessments will dictate appropriate and approved demolition and disposal and/or relocation methodologies. Any individuals and/or businesses displaced must be compensated in accordance with the Uniform Relocation Assistance and Real Property Acquisition Policies Act of 1970, as amended. Given the presence of Lake Osborne and several major drainage canals and the fact that airport activities have the potential to impact the Biscayne sole source aquifer, coordination with the South Florida Water Management District and the U.S. Environmental Protection Agency is advised. Mitigation also will be required for any wetland filling associated with construction of a new access road from Congress Avenue. 3.3 Permitting Table 3-1 identifies the necessary permits and their issuing authorities required for the proposed LNA development program. 3-LNA_ENV-OVERVIEW_NOVEMBER
72 SECTION 3 MITIGATION AND PERMITTING TABLE 3-1 Required Permits/Actions for the Proposed Measures Federal Agencies Federal Aviation Administration Approval of Airport Layout Plan (ALP) Review under National Environmental Policy Act (NEPA) U.S. Environmental Protection Agency Consultation regarding potential impacts to the Biscayne sole source aquifer U.S. Fish & Wildlife Service Consultation regarding potential impacts to threatened and endangered species State of Florida Department of Environmental Protection NPDES Notice of Intent Coastal Zone Program Consistency 1 Stormwater discharge related to construction activities Development within the coastal zone Underground Tank Removal Permit New Tank Construction Permit Department of Transportation Roadway Permit For new access road from Congress Avenue Fish & Wildlife Conservation Commission Consultation regarding potential impacts to threatened and endangered species Division of Historical Resources/ State Historic Preservation Officer Consultation regarding potential impacts to historically, architecturally, archeologically and culturally significant resources Palm Beach County Development Review Officer Development review Environmental Resource Management Department Vegetation Removal Permit Notice of Intent to Construct Removal of vegetation for multiple projects on airport property Construction of lakes 3-LNA_ENV-OVERVIEW_NOVEMBER
73 SECTION 3 MITIGATION AND PERMITTING Building Department Building/Demolition Permit Demolition of existing hangars and construction of new hangars Health Department Water & Sewer Permit Construction of a water main, force main and gravity sewer extensions for new hangars South Florida Water Management District Environmental Resource Permit or modification to the existing ERP Coastal Zone Program Consistency 1 Water Use Permit 1 Water Use Permit 2 Filling of wetlands and stormwater drainage system revisions (including increases in impervious surface) Development within the coastal zone Increases in operational water consumption Dewatering operations during construction Note: 1. Shared review responsibility. 3-LNA_ENV-OVERVIEW_NOVEMBER
74 Technical Report #4 Palm Beach County Park Airport Development Alternatives Palm Beach County Park Airport Prepared for Palm Beach County Department of Airports OCTOBER 2006 In Association with Ricondo & Associates, Inc.
75 Contents Section...Page 1 Overview Summary of Facility Requirements Airfield Facilities GA/FBO Facilities FBO Terminal Building Requirements Aircraft Apron Requirements Hangar Facilities Automobile Parking Ground Access and Transportation Networks Airfield Alternatives General Aviation/FBO Alternatives General Aviation/FBO Expansion Area General Aviation/FBO Layout Tables 2-1 Forecast and Airfield Capacity Summary GA/FBO Facility Requirements Summary (square feet) Exhibits General Aviation Facility Layout with Runway 3/21 Decommissioned General Aviation Facility Layout Phase LNA_ALTS_OCTOBER2006 ii
76 SECTION 1 Overview The previous chapter, Demand/Capacity and Facility Requirements, determined the facilities needed at Palm Beach County Park Airport (LNA) based on projected aviation demand over the 20-year planning period (through 2025). The purpose of this chapter is to review and verify the validity of previously evaluated alternatives from the most recent master plan 1 to ensure the preferred alternative previously selected reasonably satisfies future aviationrelated demand. The previous Master Plan s forecast is similar to the updated 2006 forecast, although the facility needs identified in that plan were much lower than those identified in this effort (presented in the previous chapter). Therefore, the previous preferred alternative does not fully meet the current needs, and this analysis contains a brief look at options available which would satisfy future aviation-related demand, and a new preferred alternative is presented. Alternatives were prepared based on the facility requirements associated with the forecast demand for LNA presented in the Demand/Capacity and Facility Requirements analysis, and include the facility needs for the 2025 time period. The preferred facilities development alternative will serve as the basis for the future Airport Layout Plan (ALP). The Palm Beach County Department of Airports is cognizant of the ever-changing state of the aviation industry. As such, the County will evaluate future industry changes as they relate to fleet mix, technological advances, use restrictions, etc., to determine their impact on the flying public at LNA, as well as the surrounding communities. 2 1 Dames and Moore, Master Plan Update for Palm Beach County Park Airport, Recommendations of the AAAB Addendum #1, March 10, LNA_ALTS_OCTOBER
77 SECTION 2 Summary of Facility Requirements This section summarizes the requirements for the airfield and general aviation (GA)/Fixed Based Operator (FBO) facilities identified in the Demand/Capacity and Facility Requirements chapter. 2.1 Airfield Facilities To determine whether the Airport s existing runway system will experience a capacity deficiency over the planning period, the airport s capacity was estimated through use of the 2006 FAA Terminal Area Forecast (TAF) and the hourly runway capacity estimates, as discussed in the previous chapter. Summaries of the forecast and the findings from the demand/capacity analysis are provided in Table 2-1. TABLE 2-1 Forecast and Airfield Capacity Summary Based Aircraft 1/ Annual Operations 1/ 155, ,649 ASV 2/ 447, ,139 Percent of Operations to ASV 2/ 35% 49% Prepared by: CH2M HILL, October Notes: 1/ Source: FAA Terminal Area Forecast, February / Source: CH2M HILL and Ricondo & Associates, LNA Demand/Capacity and Facility Requirements, Oct Based on the forecast activity levels, the Airport s existing runway system will not experience a capacity deficiency over the planning period, as it is projected to operate at approximately 50 percent of capacity by GA/FBO Facilities The GA/FBO facilities alternatives were developed for the projected space requirements for Additional facilities are required in the following areas: FBO terminal building, aircraft apron, hangars, and auto parking FBO Terminal Building Requirements To meet the 2025 demand level, 5,764 square feet of additional terminal space is needed. This was estimated using a ratio of 0.10 square feet per annual GA aircraft operation, a ratio similar to other comparable airports. As described in the previous chapter, due to the 4-LNA_ALTS_OCTOBER
78 SECTION 3 - SUMMARY OF FACILITY REQUIREMENTS anticipated demand levels at LNA, it is reasonable to consider that an additional FBO could start operation at the Airport over the 20-year planning period Aircraft Apron Requirements To meet 2025 forecast demand levels for apron space, LNA will require 1,121,942 square feet by This equates to a 475,562 square-foot deficiency from existing space, to be considered in the airport alternatives Hangar Facilities Hangar types at the Airport include a variety of storage options, such as t-hangars, conventional hangars, and corporate hangars. These hangars account for 290,000 square feet of hangar space on the airport. By the end of the planning horizon, the forecast indicates that hangar space needs will nearly double, to 525,753 square feet, by The specific types of facilities needed will be determined by user needs and preferences at that time Automobile Parking Automobile parking requirements were established in the area associated with the hangar facilities and includes approximately 29,076 square feet. This area will need to be increased to a total area of 57,853 square feet in order to accommodate the hangar growth. A summary of the facility requirements is provided in Table 2-2. TABLE GA/FBO Facility Requirements Summary (square feet) Facilities Existing Facilities 2025 Requirement Shortfall Terminal Building/FBO 14,000 19,764 (5,764) Aircraft Apron 646,380 1,121,942 (475,562) Hangars 290, ,753 (235,753) Auto Parking 1 29,076 57,853 (28,777) Source: CH2M HILL and Ricondo & Associates Demand Capacity/ Facility Requirements, October Prepared by: CH2M HILL, October Notes: 1/ Only represents the automobile parking associated with hangar facilities. 2.3 Ground Access and Transportation Networks Ground access at LNA is considered to be adequate and is therefore not included in the alternatives analysis. 4-LNA_ALTS_OCTOBER
79 SECTION 3 Airfield Alternatives The previous chapter identified the future requirements necessary to accommodate aviation demand for LNA over the planning period. As the Airport s existing runway system will not experience a capacity deficiency over the planning period (2025), airfield improvements are not needed. However, there are several issues relevant to the future of Runway 3/21: As noted in the last two LNA Master Plans, there have been several near-misses and other incidents as this runway also serves as a taxiway, and LNA has no ATCT It does not add to capacity due to the intersections with Runways 9/27 and 15/33 (and therefore closing it would not reduce the airport s ASV) The runway is only used approximately three percent of the time The FAA has previously stated in correspondence to the DOA, that the runway (for the above reasons) is not eligible for federal funding Options for the runway therefore consist of the DOA continuing to keep it open and funding the capital costs, or closing the runway. Given the potential safety enhancement due to the simplification of operations for the uncontrolled field, it is recommended that the decommissioning of this runway be considered over the long-term. An additional benefit is the reduced amount of pavement to be maintained. No pavement maintenance costs are available in a manner that would allow calculation of the savings; however, the reduction in pavement to be maintained should also reduce operating costs commensurately. Timing of this recommended closure should occur prior to the next major rehabilitation project, and before any GA/FBO facility expansion takes place. 2 2 An ancillary benefit of the closure of Runway 3/21 includes opening up an area which could be utilized for a future FBO. 4-LNA_ALTS_OCTOBER
80 SECTION 4 General Aviation/FBO Alternatives Options for expansion of the GA/FBO facilities for 2025 demand-levels are limited to one area with the decommissioned runway. That area and a typical GA/FBO layout are discussed below. 4.1 General Aviation/FBO Expansion Area The location available on airport property to accommodate the 2025 demand level for GA/FBO facilities includes the areas to the west of Runway 3/21, to the west of the existing FBO terminal area, and to the north and west of the drainage basin, between Runways 9/27 and 15/33. This general area and layout is illustrated in Exhibit 4-1. Because there are no other areas available for airport run-off, the area directly north of Runway 9/27 must be reserved for this (existing) function, and cannot be considered for airport expansion. 4.2 General Aviation/FBO Layout The layout shown in Exhibit 4-1 lends itself to a practical phased approach, which would be suitable for the airport in the interim, prior to the decommissioning of Runway 3/21, as illustrated in Exhibit 4-2. The layout of the facilities within the area described above is intended to illustrate one typical expansion option. As such, the actual future layout of the future GA area will be determined by the County and the FBO tenant. 4-LNA_ALTS_OCTOBER
81 RPZ Palm Beach County Park Airport RPZ Pa y g to be Relocated Legend: Existing Buildings RPZ RPZ RPZ T-Hangars Congress Avenue, SR 807 RPZ Realign Property Line Commercial Development Future FBO Facilities OFA OFA OFA OFA OFA OFA OFA RSA RSA RSA RSA RSA RSA RSA RSA OFA OFA OFA OFA Existing Runway (3,426 feet x 100 feet) OFA John Prince Park OFA Lake Osbourne RPZ New Apron Area Proposed Aircraft Wash Rack New Taxiway FBO Terminal Building Roadway Automobile Parking Wetlands (National Wetlands Inventory [Dec 1992]) Property Line RSA RSA RSA RSA RSA RSA RSA Existing Runway 9-27 (3,489 feet x 75 feet) RSA RSA 0 RPZ Commercial Development 1,000 ft. north OFA Taxiway A Existing FBO/Terminal Lantana Road, SR 872 Sources: Airport Layout Plan, December 1999.; Land Design Studio, July 2004 (DRC Approved); Ricondo & Associates, Inc., June 2006 Prepared by: Ricondo & Associates, Inc., July 2006 OFA Drawing: P:\PBIA\System Wide Airport Master Planning Study - Phase II\Task 7 - Airport Facilities Alternatives\Task FBO GA and Other DLNA_Alternative_Fits All_with 2ndFBO_RWY3-21Close_DRC APPROVED_REV6.dwg_Layout: 3A_Mar 01, 2007, 5:23pm FBO/General Aviation Development Alternatives RPZ RPZ RPZ Total 2025 Facility Requirements Summary (square feet) Facilities Hangars*: Apron: Required 525,753 s.f. 1,121,942 s.f. * Includes Hangars and T-Hangars Available 526,082 s.f. 1,122,317 s.f. Exhibit General Aviation Facility Layout With Runway 3-21 Decommissioned (Projected Post 2018) July 2006
82 RPZ Palm Beach County Park Airport Legend: RPZ RPZ Conventional Hangars RPZ Wetlands T-Hangars RPZ RPZ Congress Avenue, SR 807 Realign Property Line Commercial Development Wetlands Commercial Development OFA Future FBO Facilities OFA Runway 3-21 (3,256 feet x 75 feet) RSA RSA OFA OFA OFA RSA RSA RSA RSA RSA RSA RSA OFA OFA Existing FBO/Terminal OFA RSA Runway 9-27 (3,489 feet x 75 feet) Taxiway A Midfield Area OFA Runway (3,426 feet x 100 feet) RSA Future Access Road John Prince Park RPZ OFA RSA Lake Osborne RPZ Facilities Hangars*: Apron: Required 525,753 s.f. 1,121,942 s.f. FBO Terminal Building Proposed Aircraft Wash Rack New Apron Area Future Taxiway/ Taxilane Removed Runway Roadway Automobile Parking Property Line Total 2025 Facility Requirements Summary (square feet) Available 453,492 s.f. 709,928 s.f. FBO/Terminal: 6,000 s.f. 6,000 s.f. * Includes Hangars and T-Hangars Lantana Road, SR 872 Sources: Airport Layout Plan, December 1999.; Land Design Studio, July 2004 (DRC Approved); Ricondo & Associates, Inc., June 2006 Prepared by: Ricondo & Associates, Inc., July ,000 ft. north Exhibit 4-2 General Aviation Facility Layout - Phase 1 (Maximized Buildout With Runway 3-21) Projected Buildout Year: 2018 (Assuming Overflow Apron is Provided Within Midfield Area) Drawing: P:\PBIA\System Wide Airport Master Planning Study - Phase II\Task 7 - Airport Facilities Alternatives\Task FBO GA and Other DLNA_Alternative 2_What Fits_With 2nd FBO_REV6.dwg_Layout: Alternative 2_Mar 01, 2007, 5:24pm FBO/General Aviation Development Alternatives July 2006
83 Technical Report #5 Palm Beach County Airports Financial Planning Prepared for Palm Beach County Department of Airports SEPTEMBER 2007 In Association with Ricondo & Associates, Inc.
84 Contents Section Page 1 Financial Analysis Financial Structure of the Airport Accounting Practices Airline Agreement Bond Resolution Capital Improvement Plan Phasing and Funding Sources Projects Funding Sources AIP Grants FDOT Funds Passenger Facility Charge Revenues Airport Funds General Airport Revenue Bonds (GARBs) Debt Service Requirements O&M Expenses Airport Revenues (Nonairline and Airline) Nonairline Revenues Airside Terminal Ground Transportation Aviation Air Cargo Building Non-Aviation Other Revenues Airline Revenues Terminal Rentals Landing Fees Cost per Enplaned Passenger Cash Flow Debt Service Coverage Summary of Baseline Scenario Sensitivity Analysis Sensitivity Analysis FINAL DRAFT II SEPTEMBER 05, 2007
85 1.0 Financial Analysis The financial viability of implementing the Master Plan recommendations for the Airport and its three reliever airports collectively known as the Airport System is discussed in this chapter. As noted previously, the actual implementation schedule for the various improvements identified in the Master Plan will be defined by development triggers and demand growth rather than specific calendar years. For purposes of this illustrative financial analysis, a specific implementation schedule was assumed; however, it should be noted that this schedule and the resulting financial analysis are intended only to demonstrate financial viability and that the actual financing strategies used will be determined as implementation approaches. The projected financial results are presented in detail for the short term, Fiscal Year (FY) 2007 through FY 2017, and a more general overview is presented for the longer term of the Master Plan period, FY 2018 through FY 2025 (for Fiscal Years ending September 30). This chapter is presented in the following sections: I. Financial Structure of the Airport II. Capital Improvement Plan Phasing and Funding Sources III. Debt Service Requirements IV. Operation and Maintenance (O&M) Expenses V. Airport Revenues (Airline and Nonairline) VI. Cost per Enplaned Passenger VII. Cash Flow VIII Debt Service Coverage IX. Summary of Baseline Scenario X. Sensitivity Analysis 1 XI. Sensitivity Analysis 2 FINAL DRAFT 1-1 SEPTEMBER 05, 2007
86 2.0 Financial Structure of the Airport This section presents a discussion of the Airport System s accounting practices, a summary of the Airport-Airline Use and Lease Agreement (the Airline Agreement) between Palm Beach County and the airlines that have executed the Airline Agreement (the Signatory Airlines), and the Bond Resolution that was adopted in 1984 and subsequently amended in full. 2.1 Accounting Practices Airport System-related expenditures are categorized by type of expense into Direct Cost Centers and Indirect Cost Centers, as defined in the Airline Agreement. Revenues are allocated in the same manner. Direct Cost Centers include those areas or functional activities of the Airport System used for the purposes of accounting for Revenues, O&M Expenses, and Debt Service. Revenues are not usually associated with Indirect Cost Centers, which include those areas or functional activities of the Airport System used to account for O&M Expenses and Debt Service. The expenses included in Indirect Cost Centers are allocated to Direct Cost Centers as defined in the Airline Agreement. Direct Cost Centers defined in the Airline Agreement include, but are not necessarily limited to: Airside - Includes all Debt Service, all Direct and Indirect O&M Expenses, Capital Expenditures, and Operating Revenues for the Airside. The Airside includes the landing area, taxiways and Ramp Area. Terminal - Includes all Debt Service, all Direct and Indirect O&M Expenses, and Operating Revenues for the Terminal, which consists of airline terminal facilities at the Airport. Tenant Equipment - Includes all Debt Service, all Direct and Indirect O&M Expenses, and Operating Revenues related to loading bridges, aircraft supply systems, holdroom furnishings, and certain bag makeup and bag claim equipment. Ground Transportation - Includes all Debt Service, all Direct and Indirect O&M Expenses, and Operating Revenues for terminal access roadways (including the enplanement/deplanement drives), all Airport roads, Airport parking facilities, and other areas and facilities accommodating ground transportation. Aviation - Includes all Debt Service, all Direct and Indirect O&M Expenses, and Operating Revenues for air cargo, general aviation, flight kitchen, and military activities. Non-Aviation - Includes all Debt Service, all Direct and Indirect O&M Expenses, and Operating Revenues for Airport areas related to non-aviation purposes that provide support functions (e.g., rental car maintenance areas, and miscellaneous ground areas and facilities leased by Airport tenants). Terminal FIS - Includes all Debt Service, all Direct and Indirect O&M Expenses, and Operating Revenues for Airport areas related to areas in the Terminal, and/or elsewhere on FINAL DRAFT 2-1 SEPTEMBER 05, 2007
87 2.0 FINANCIAL STRUCTURE OF THE AIRPORT the Airport, to be used by agencies of the United States Government for the inspection of passengers and their baggage, and for the exercise of the responsibilities of said agencies with respect to the movement of persons and property to and from the United States. Palm Beach County Park (Lantana Airport) - Includes all Debt Service, all Direct and Indirect O&M Expenses, and Operating Revenues for all activities and facilities at Lantana Airport. Palm Beach County Glades Airport (Glades Airport) - Includes all Debt Service, all Direct and Indirect O&M Expenses, and Operating Revenues for all activities and facilities at Glades Airport. North Palm Beach County General Aviation Airport (North County Airport) - Includes all Debt Service, all Direct and Indirect O&M Expenses, and Operating Revenues for all activities and facilities at North County Airport. Air Cargo Building - Includes all Debt Service, all Direct and Indirect O&M Expenses, and Operating Revenues for all activities at and facilities surrounding the Air Cargo Building. Indirect Cost Centers defined in the Airline Agreement include, but are not necessarily limited to: Administrative and Operations - Includes all Direct O&M Expenses for all administration activities and facilities, including charges for County administrative services provided on behalf of the Airport System (e.g. accounting, finance, data processing services). Administrative O&M Expenses are allocated based on each Direct Cost Center s share of O&M Expenses attributable to all Direct Cost Centers. Maintenance - Includes all Direct O&M Expenses for maintenance activities and facilities of the Airport System. Maintenance O&M Expenses are allocated to Direct Cost Centers to the extent possible based on actual staff hours charged to each respective Direct Cost Center, and other O&M Expenses that can be directly charged. Fire Department - Includes all Direct O&M Expenses for fire, and rescue activities and facilities, including those required under FAR Part 139. Fire department O&M Expenses are allocated to Direct Cost Centers to the extent possible based on actual staff hours charged to each respective Direct Cost Center, and other O&M Expenses that can be directly charged. 2.2 Airline Agreement The County recently negotiated a new Airline Agreement, effective October 1, 2006, with a five year term. The rate-making structure for FY 2007 through FY 2015 includes the following key elements: A compensatory average rental rate for the Terminal, using total rentable square feet as the divisor. Differential Terminal rental rates are calculated for the purpose of differentiating space by location and function. A residual landing fee rate for the Airside using total landed weight as the divisor. FINAL DRAFT 2-2 SEPTEMBER 05, 2007
88 2.0 FINANCIAL STRUCTURE OF THE AIRPORT A revenue-sharing provision, by which a portion of funds remaining after the payment of debt service, O&M expenses and replenishment of required fund balances, equivalent to 50 percent, is credited to the Signatory Airline rate base in the subsequent year. There is no majority in interest provision in the Airline Agreement for any capital projects at the Airport. 2.3 Bond Resolution The Bond Resolution authorizes the issuance of Airport System Revenue Bonds by the County. The requirements of the Bond Resolution and the methodology contained in the Airline Agreement were adhered to in developing the application of revenues included in these financial analyses. The principal funds and accounts created in the Bond Resolution are summarized below: Revenues (or Operating Revenues ) as defined in the Bond Resolution, include, generally, all revenue due and payable to the County from the ownership or operation of the Airport System, including all rentals, concession revenue, use charges, and landing fees. An O&M Reserve requirement was established in an amount equal to one-sixth of the amount appropriated in the annual budget for O&M Expenses for the then-current Fiscal Year. Pursuant to the Bond Resolution, the County covenants that it will fix, charge, and collect rates, fees, rentals, and charges for the use of the Airport System, and shall revise such rates, fees, rentals, and charges as often as may be necessary or appropriate to produce Revenues in each Fiscal Year at least equal to the sum of Operation and Maintenance Expenses, including reserves therefore provided for in the annual budget, plus the greater of (a) an amount equal to the sum of 1.25 times the Aggregate Debt Service for such Fiscal Year, or (b) the sum of (i) the amount to be paid during such Fiscal Year into the Debt Service Account, plus (ii) the amount, if any, to be paid during the Fiscal Year into the Debt Service Reserve Account (including amounts payable to the issuer of any Debt Service Reserve Account Facility and excluding amounts required to be paid into such account out of the proceeds of Bonds), plus (iii) the amount, if any, to be paid into the Renewal and Replacement Fund as provided in the Annual Budget, plus (iv) all other charges and liens whatsoever payable out of Revenues during such Fiscal Year, plus (v) to the extent not otherwise provided for, all amounts payable on Subordinated Indebtedness. FINAL DRAFT 2-3 SEPTEMBER 05, 2007
89 3.0 Capital Improvement Plan Phasing and Funding Sources This section presents a discussion of the Master Plan s long-term Capital Improvement Plan (CIP) including discussion of major projects and funding sources. 3.1 Projects Funding for the CIP is expected to be secured from various sources. The estimated capital costs were developed in current dollars and escalated to inflated dollars using an annual growth rate of five percent. Table 1.1 presents the CIP by Airport by funding source. The CIP is estimated to cost $922.1 million in inflated dollars, and consists of the following projects: Airside projects in the CIP are estimated to total approximately $390.2 million. Terminal improvements are estimated to total $75 million and include redevelopment of Concourse A, expansion of Concourse C, and construction of a new baggage system. A new parking garage for the Airport is planned for FY 2023 at an estimated cost of $224 million. A cargo facility is planned for FY 2015 at an estimated cost of $33 million. Projects at the general aviation airports are planned as follows: Lantana Airport - $23 million North County Airport - $26 million Glades Airport $5 million 3.2 Funding Sources The County intends to finance the recommended CIP through a combination of FAA Airport Improvement Program (AIP) grants (entitlements and discretionary), Florida Department of Transportation (FDOT) grants, passenger facility charge (PFC) revenues, County funds, and proceeds from the sale of General Airport Revenue Bonds (GARBs). The County has been actively seeking maximum discretionary funding for certain Airfield projects and may pursue an FAA Letter of Intent (LOI) for certain Airfield projects. Table 1.2 presents the CIP for FY 2007 through FY 2025 and funding sources for each project. For purposes of this report, funding sources have been identified on the basis of project eligibility and are presented as a Base Case. Actual funding may not be secured at this level of eligibility and alternative funding scenarios are presented later in the chapter. The following sections briefly describe the anticipated funding sources for these projects. FINAL DRAFT 3-1 SEPTEMBER 05, 2007
90 3.0 CAPITAL IMPROVEMENT PLAN PHASING AND FUNDING SOURCES Table 1.1 (1 of 2) Capital Improvement Plan Summary of Funding Sources Funding Source Total Project AIP Project Escalated Dollars Ent & Disc FDOT PFC Airport Cash GARBs PALM BEACH INTERNATIONAL AIRPORT Expand and Rehab Overnight Parking Apron $740,000 $0 $370,000 $370,000 $0 $0 Apron "A" Expansion 3,420, ,220,000 2,200, NAVAID Relocation Study 300, , Construct Maintenance Compound 1,000, ,000, Rehabilitate Aircraft Parking Apron 1,090, , , Extension of Taxiway "F" to RW 13 13,400, ,236,500 8,163, Extend Runway 9R-27L Environmental & Design 8,284, ,142,000 4,142, Extension of Taxiway "L" (Lima) 17,700, ,850,000 8,850, Miscellaneous taxiway rehab 5,250, ,625,000 2,625, New Taxiway Connector - Runway 9L-27R 5,300,000 3,975, , , Taxiway Romeo West of R1 & East of R1 20,825,398 15,619,049 2,603,175 2,603, Taxiway C4 High Speed Exit - Rwy 9L-27R 5,084,000 4,067, , , Taxiway D High Speed Exit - Rwy 9L-27R 4,721,000 3,776, , , Replace (2) Fire Rescue Vehicles 2,250, ,000,000 1,250, Concourse "A" Redevelopment 20,375, ,075,000 18,300, Acquire land runway 9L-27R 7,094,817 3,000, ,000 3,719, Taxiway Lima (West) Upgrades and Improvements 17,048,000 12,786,000 2,131,000 2,131, Runway 9R Property Acquisition 35,846,700 24,802,632 4,272,034 6,772, Golfview Apron, Taxilanes/Taxiways and Infrastructure 74,000,000 55,500, ,500, Golfview Facilities 130,000,000 97,500, ,500, Relocate VOR 3,939,281 2,954, , , Taxiway Charlie (East) Improvements 7,800, ,020, , Extend, Relocate and Upgrade RWY 9R-27L 77,101,000 43,039,000 17,031,000 17,031, Construct Apron Golfview 2 6,000,000 4,500, , , Construct Surface Parking Lot 1,426, ,426,946 0 Demolition East of Runway ,600,000 13,200,000 2,200,000 2,200, Demolition West of Runway ,600,000 7,950,000 1,325,000 1,325, Runway Pavement Removal 2,500,000 1,875, , , Runway 13-31, Taxiway F and Taxiway B Extensions and Taxiway Connectors 23,000,000 17,250,000 2,875,000 2,875, Part 150 Study PBIA 800, ,000 40,000 40, Rehabilitate Taxiway C 8,500,000 3,609,000 2,445,500 2,445, New Parking Revenue Center 2,609, ,609,546 0 New Cargo Apron 5,461,307 4,915, , , Concourse "B" Expansion 29,500,000 2,000,000 3,582,157 18,917,843 5,000,000 0 Miscellaneous Taxiway Rehab 2,687,834 1,707, , , New Belly Cargo/All Cargo Facility 33,131, ,131, Cargo Apron Expansion 3,070,758 2,763, , , Construct Surface Parking Lot 4,270, ,416, , Terminal Building Baggage System Expansion 24,979, ,979, Construct Surface Parking Lot 5,806, ,806,149 0 New Parking Garage 224,176, ,176,582 Subtotal Palm Beach International Airport $868,690,724 $327,510,501 $79,494,816 $222,666,185 $14,842,641 $224,176,582 FINAL DRAFT 3-2 SEPTEMBER 05, 2007
91 3.0 CAPITAL IMPROVEMENT PLAN PHASING AND FUNDING SOURCES Table 1.1 (2 of 2) Capital Improvement Plan Summary of Funding Sources Funding Source Total Project AIP Project Escalated Dollars Ent & Disc FDOT PFC Airport Cash GARBs LANTANA Runway 33 Threshold Improvements $150,000 $142,500 $3,750 $3,750 $0 $0 Construct Hangars at Lantana 1,875, ,500, ,000 0 Construct Hangars (Rows 500, 600 & 700) 5,000, ,000, ,000,000 0 Upgrade Airfield Signage 400, ,000 10,000 10, Expand Itinerant Apron 6,200, ,960,000 1,240, Relocate Airport Rotating Beacon 100,000 95, , Taxiway C Rehab 1,100, , , Apron Rehab 275, ,000 55, Rehab Runway 15/33 1,500, ,200, , Rehab Runway 3/21 200, ,000 40, Construct Apron 2,200, ,760, , Construct Hangars (Rows 1600, 1700, 1800 & 1900) 3,600, ,880, ,000 0 Construct Access Road to West Side Development 250, ,000 50, Subtotal Lantana $22,850,000 $617,500 $17,773,750 $2,363,750 $2,095,000 $0 NORTH COUNTY AIRPORT Miscellaneous Pavement Rehab $250,000 $237,500 $6,250 $6,250 $0 $0 Construct Hangars at North County 1,875, ,500, ,000 0 Construct Apron and Taxilanes 1,875, ,500, , Construct Service Road from Terminal to North T-Hangars 550, , , Construct Additional Tie-Down/Transient Apron 4,200, ,360, , Construct Hangars 5,000, ,000, ,000,000 0 Hangar Construction Environmental Mitigation 2,500, ,000, , Construct Parallel Runway 4,450,000 4,227, , , Environmental Mitigation Runway ,000, ,000,000 1,000, Subtotal North County Airport $25,700,000 $4,465,000 $16,917,500 $2,942,500 $1,375,000 $0 GLADES T-Hangar Taxilane Rehab $143,000 $135,850 $3,575 $3,575 $0 $0 Construct T-Hangar Facilities 500, , ,000 0 Runway 17/35 Crack Sealing 80,000 76, , Construct T-Hangars 1,250, ,000, ,000 0 Install PAPIs and REILs 360, , , Expand Aircraft Parking Apron 1,500, ,200, , Property Acquisition 1,000, , , Subtotal Glades $4,833,000 $553,850 $3,403,575 $525,575 $350,000 $0 TOTAL $922,073,724 $333,146,851 $117,589,641 $228,498,010 $18,662,641 $224,176,582 Total Funding Sources By Cost Center: Airside $390,164,095 $228,010,501 $69,420,889 $92,732,706 $0 $0 Terminal 74,854,506 2,000,000 5,657,157 62,197,349 5,000,000 0 Ground Transportation 238,290, ,416, ,192 9,842, ,176,582 Aviation 130,000,000 97,500, ,500, Lantana 22,850, ,500 17,773,750 2,363,750 2,095,000 0 Glades 4,833, ,850 3,403, , ,000 0 North County Airport 25,700,000 4,465,000 16,917,500 2,942,500 1,375,000 0 Air Cargo Building 33,131, ,131, Fire Rescue 2,250, ,000,000 1,250, TOTAL $922,073,724 $333,146,851 $117,589,641 $228,498,010 $18,662,641 $224,176,582 Source: Palm Beach County Prepared by: Ricondo & Associates, Inc. FINAL DRAFT 3-3 SEPTEMBER 05, 2007
92 3.0 CAPITAL IMPROVEMENT PLAN PHASING AND FUNDING SOURCES Table 1.2 (1 of 2) Capital Improvement Plan Total Project Costs by Year Project Total Project Escalated Dollars PALM BEACH INTERNATIONAL AIRPORT Expand and Rehab Overnight Parking Apron $740,000 $740,000 Apron "A" Expansion $3,420,000 $3,420,000 NAVAID Relocation Study $300,000 $300,000 Construct Maintenance Compound $1,000,000 $1,000,000 Rehabilitate Aircraft Parking Apron $1,090,000 $1,090,000 Extension of Taxiway "F" to RW 13 $13,400,000 $776,000 $12,624,000 Extend Runway 9R-27L Environmental & Design $8,284,000 $3,000,000 $5,284,000 Extension of Taxiway "L" (Lima) $17,700,000 $1,717,000 $15,983,000 Miscellaneous taxiway rehab $5,250,000 $5,250,000 New Taxiway Connector - Runway 9L-27R $5,300,000 $5,300,000 Taxiway Romeo West of R1 & East of R1 $20,825,398 $6,700,000 $2,825,080 $8,475,239 $2,825,080 Taxiway C4 High Speed Exit - Rwy 9L-27R $5,084,000 $5,084,000 Taxiway D High Speed Exit - Rwy 9L-27R $4,721,000 $4,721,000 Replace (2) Fire Rescue Vehicles $2,250,000 $2,250,000 Concourse "A" Redevelopment $20,375,000 $20,375,000 Acquire land runway 9L-27R $7,094,817 $7,094,817 Taxiway Lima (West) Upgrades and Improvements $17,048,000 $17,048,000 Runway 9R Property Acquisition $35,846,700 $25,846,700 $10,000,000 Golfview Apron, Taxilanes/Taxiways and Infrastructure $74,000,000 $74,000,000 Golfview Facilities $130,000,000 $130,000,000 Relocate VOR $3,939,281 $3,939,281 Taxiway Charlie (East) Improvements $7,800,000 $7,800,000 Extend, Relocate and Upgrade RWY 9R-27L $77,101,000 $27,545,150 $49,555,850 Construct Apron Golfview 2 $6,000,000 $6,000,000 Construct Surface Parking Lot $1,426,946 $1,426,946 Demolition East of Runway $17,600,000 $17,600,000 Demolition West of Runway $10,600,000 $10,600,000 Runway Pavement Removal $2,500,000 $2,500,000 Runway 13-31, Taxiway F and Taxiway B Extensions and Taxiway Connectors $23,000,000 $23,000,000 Part 150 Study PBIA $800,000 $800,000 Rehabilitate Taxiway C $8,500,000 $8,500,000 New Parking Revenue Center $2,609,546 $2,609,546 New Cargo Apron $5,461,307 $5,461,307 Concourse "B" Expansion $29,500,000 $29,500,000 Miscellaneous Taxiway Rehab $2,687,834 $2,687,834 New Belly Cargo/All Cargo Facility $33,131,938 $33,131,938 Cargo Apron Expansion $3,070,758 $3,070,758 Construct Surface Parking Lot $4,270,962 $4,270,962 Terminal Building Baggage System Expansion $24,979,506 $24,979,506 Construct Surface Parking Lot $5,806,149 $5,806,149 New Parking Garage $224,176,582 $224,176,582 FINAL DRAFT 3-4 SEPTEMBER 05, 2007
93 3.0 CAPITAL IMPROVEMENT PLAN PHASING AND FUNDING SOURCES Table 1.2 (2 of 2) Capital Improvement Plan Total Project Costs by Year Total Project Project Escalated Dollars LANTANA Runway 33 Threshold Improvements $150,000 $150,000 Construct Hangars at Lantana $1,875,000 $1,875,000 Construct Hangars (Rows 500, 600 & 700) $5,000,000 $5,000,000 Upgrade Airfield Signage $400,000 $400,000 Expand Itinerant Apron $6,200,000 $6,200,000 Relocate Airport Rotating Beacon $100,000 $100,000 Taxiway C Rehab $1,100,000 $1,100,000 Apron Rehab $275,000 $275,000 Rehab Runway 15/33 $1,500,000 $1,500,000 Rehab Runway 3/21 $200,000 $200,000 Construct Apron $2,200,000 $2,200,000 Construct Hangars (Rows 1600, 1700, 1800 & 1900) $3,600,000 $3,600,000 Construct Access Road to West SIde Development $250,000 $250,000 NORTH COUNTY AIRPORT Miscellaneous Pavement Rehab $250,000 $250,000 Construct Hangars at North County $1,875,000 $1,875,000 Construct Apron and Taxilanes $1,875,000 $1,875,000 Construct Service Road from Terminal to North T-Hangars $550,000 $550,000 Construct Additional Tie-Down/Transient Apron $4,200,000 $4,200,000 Construct Hangars $5,000,000 $5,000,000 Hangar Construction Environmental Mitigation $2,500,000 $2,500,000 Construct Parallel Runway $4,450,000 $4,450,000 Environmental Mitigation Runway $5,000,000 $5,000,000 GLADES T-Hangar Taxilane Rehab $143,000 $143,000 Construct T-Hangar Facilities $500,000 $500,000 Runway 17/35 Crack Sealing $80,000 $80,000 Construct T-Hangars $1,250,000 $625,000 $625,000 Install PAPIs and REILs $360,000 $360,000 Expand Aircraft Parking Apron $1,500,000 $1,500,000 Property Acquisition $1,000,000 $1,000,000 TOTAL $922,073,724 $5,503,000 $38,468,000 $341,454,798 $57,772,096 $82,205,850 $34,125,080 $18,775,239 $10,895,933 $65,569,772 $7,341,720 $24,979,506 $0 $0 $10,806,149 $0 $0 $224,176,582 $0 $0 Total Project Costs By Cost Center: Airside $390,164,095 $4,460,000 $34,638,000 $169,619,798 $43,545,150 $77,755,850 $28,325,080 $17,775,239 $8,286,387 $2,687,834 $3,070,758 $0 $0 $0 $0 $0 $0 $0 $0 $0 Terminal 74,854, ,375, ,500, ,979, Ground Transportation 238,290, ,426, ,609, ,270, ,806, ,176, Aviation 130,000, ,000, Lantana 22,850, ,000 1,875,000 11,600,000 3,175, ,800, , Glades 4,833, ,000 80, ,000 2,125, ,000, North County Airport 25,700, ,000 1,875,000 6,625,000 7,500,000 4,450, ,000, Air Cargo Building 33,131, ,131, Fire Rescue 2,250, ,250, TOTAL $922,073,724 $5,503,000 $38,468,000 $341,454,798 $57,772,096 $82,205,850 $34,125,080 $18,775,239 $10,895,933 $65,569,772 $7,341,720 $24,979,506 $0 $0 $10,806,149 $0 $0 $224,176,582 $0 $0 Source: Palm Beach County Prepared by: Ricondo & Associates, Inc. FINAL DRAFT 3-5 SEPTEMBER 05, 2007
94 3.0 CAPITAL IMPROVEMENT PLAN PHASING AND FUNDING SOURCES AIP Grants One of the main sources of funding for airport improvements is the federal AIP. The AIP was initially authorized by the Airport and Airway Improvement Act of 1982 to assist airport sponsors in funding planning, development, and noise compatibility projects at public-use airports nationwide to accommodate projected civil aviation growth. To be eligible for funding assistance under this 1982 act, an airport must be included in the National Plan of Integrated Airport Systems (NPIAS). The AIP is funded through the Aviation Trust Fund, which was established by the Airport and Airway Revenue Act of Revenues for the Aviation Trust Fund are derived through the levying of taxes and fees on aviation fuel and lubricants, airline tickets, international departing passengers, aircraft freight, and other components of the aviation industry. Funds deposited into the Aviation Trust Fund are distributed to eligible airports throughout the United States and its territories through grants administrated by the FAA under appropriations limits established by the United States Congress. The FAA allocates funds to the nation s airports based on a number of eligibility criteria tied to a priority system used to rank each request and determine which projects will be funded and which will not during any given federal fiscal year (also ending September 30). The priority system used by the FAA is based on different criteria for different types of projects. Generally, projects that enhance the safety of aircraft operations and those that enhance capacity in the national air transportation system are higher priority projects. Projects are also ranked based on the size of the airport and the number of aircraft and aircraft operations at the facility. The County has assumed that approximately $333.1 million of projects are eligible for AIP funding (discretionary and entitlements), including the extension and relocation of Runway 9R- 27L at Palm Beach International Airport. The County intends to pursue an LOI for the airfield projects that comprise the Airfield Improvement Projects. As the runway and other airfield improvements will significantly enhance the capacity of the national air transportation system, the runway and associated airfield projects are ideally suited for LOI funding. The proposed runway project is expected to be economically justifiable with a positive net present value and a benefit-cost ratio significantly greater than FDOT Funds Similar to the federal AIP, the FDOT Aviation Grant Program is funded from the State Transportation Trust Fund. The State Transportation Trust Fund consists, in part, of funds collected through the State s aviation fuel tax. The FDOT Aviation Office administers the aviation grant program to help provide a safe, cost-effective, and efficient Statewide aviation system. The FDOT Aviation Grant Program supplements the AIP, providing a portion of the sponsor s matching share when federal funding is available and up to 80 percent of the overall project cost when it is not. FDOT grant funds help airport sponsors to construct T-hangars, construct and maintain runways and taxiways, eliminate airport hazards, protect the airspace, and construct terminals and other facilities. All publicly owned Florida airports that are open for public use are eligible for State funding. In addition, privately owned airports that are classified as reliever airports are eligible for FAA funding. Florida law generally allows FDOT to fund any capital project on airport property and any service that leads to capital projects, such as planning and design services. FINAL DRAFT 3-6 SEPTEMBER 05, 2007
95 3.0 CAPITAL IMPROVEMENT PLAN PHASING AND FUNDING SOURCES The only off-airport projects eligible for FDOT funding are the purchase of lands for mitigation purposes, the purchase of avigation easements, and the access projects for intercontinental airports. Airport capital equipment is eligible, except equipment closely related to day-to-day operations (mowing machines, weed eaters, airport vehicles, etc.). In general, operational expenses, such as for maintenance services, equipment, and supplies, are not eligible for FDOT aviation grants. To be eligible for FDOT grants, each airport project must be consistent with the airport s role as defined in the Florida Aviation System Plan (FASP), and capital projects must be part of an FDOT approved airport master plan or airport layout plan. Additionally, for projects to be eligible for State funding, they must also be included in the Joint Automated Capital Improvement Plan (JACIP). Under this plan, the State accepts requests from airport sponsors for project funding along with each airport sponsor s priority for individual airport projects. Inclusion in the JACIP does not represent a commitment by the FDOT or FAA to fund a particular project or projects. The JACIP is intended to coordinate State and federal funding efforts and provide a realistic approach to funding based on the best and most current information available regarding projects at Florida grant-eligible airports. FDOT grants are expected to fund approximately $117.6 million of the Master Plan projects Passenger Facility Charge Revenues In accordance with the Aviation Safety and Capacity Expansion Act of 1990, as amended by the Aviation Investment and Reform Act for the 21st Century (AIR-21), the County recently filed a PFC application to impose a $4.50 PFC at the Airport. PFC revenues may be used to fund the local share of eligible Airport project costs (PFC eligibility for projects generally follows the same general guidelines for determining AIP grant eligibility outlined earlier). In June 2007, the County filed a PFC Application to collect PFC at a $4.50 level, which is expected to be approved and will become effective May 1, The County is therefore, required by AIR-21 to demonstrate to the FAA that the project will make a significant contribution to improving air safety and security, increasing competition among air carriers, reducing current or anticipated congestion, or reducing the impact of aviation noise on people living near the Airport. The finding of significant contribution is in addition to the finding of adequate justification already required for all PFC-eligible projects. In particular, the FAA considers all relevant factors, including but not limited to the following, in assessing whether the significant contribution requirement has been met: Safety and security projects. Does the project advance airport safety and/or security? In the case of AIP discretionary funds, highest priority is usually given to those projects that meet regulatory requirements for safety and security under 14 CFR Part 139 and Part 107, respectively. A similar approach to assessing PFC significance may be appropriate. Congestion (capacity). Does the project support or is it part of a capacity project to which the FAA has allocated federal resources or that would qualify for such resources? For example, is the project included in an LOI or does it satisfy the FAA's benefit-cost criteria for large AIP discretionary investments? Has the project been identified as an important item in an FAA Airport Capacity Enhancement Plan? Does the project alleviate an important constraint on airport growth or service? Noise. Does the project affect the noise-impacted areas around the airport? Historically, higher priority for AIP discretionary grants has been given to projects in noisier areas over FINAL DRAFT 3-7 SEPTEMBER 05, 2007
96 3.0 CAPITAL IMPROVEMENT PLAN PHASING AND FUNDING SOURCES projects in less noisy areas, all other factors being equal. A similar approach to assessing PFC significance may be appropriate. Competition. Does the project mitigate or remove barriers to increased airline competition at the airport? Has the project been identified as an essential component in the airport's competition plan or other similar documents? When submitting PFC applications for projects identified as being partially funded with PFC revenues, the County will need to provide sufficient information to support its assertion that a project makes a significant contribution to one or more of the above factors. In the case of a project that would reduce congestion, the information may include a quantified measure of reduced delay per aircraft operation or reference a study that included measures of the expected congestion reduction benefits. Similarly, an assertion that a project enhances competition may be supported by information on the number of new operations that the project would provide for, the number of new entrant airlines it would accommodate, the effect on fares at the airport, and/or other measures of increased competition. In general, because significant contribution is a higher standard than adequate justification, more documentation is required to establish significant contribution than is typically needed for adequate justification. The annual cost of projects identified as PFC-eligible exceeds the PFC capacity in the years in which the project costs are expected to be incurred. Thus, it is anticipated that the County may issue PFC-backed bonds to fund certain projects and that a portion of annual PFC collections will be used to pay the outstanding debt service on any PFC-backed bonds. Master Plan projects totaling $228.5 million are expected to be funded from PFC revenues. Of this amount, approximately $43.4 million is anticipated to be funded on a pay-as-you-go basis and the remaining $185.1 million is expected to be funded with bond proceeds that will subsequently be repaid with PFC revenues. Table 1.3 presents projections of PFC revenues and PFC expenditures and reflects that ample PFC capacity exists to fund those Airport System projects identified as PFC-eligible. Funding assumptions incorporated into the calculation of annual debt service resulting from the issuance of the bonds include the following: Three debt series - Series 2009 is to include a portion of the projects expected to be undertaken in FY 2009 through FY 2011; Series 2015 is to include all projects expected to be undertaken in FY 2015; and Series 2017 is to include all projects expected to be undertaken in FY year term No capitalized interest 6.5 percent interest rate Establishment of a Debt Service Reserve Account equivalent to the maximum annual debt service Level annual debt service Airport Funds Under the County s existing Bond Resolution and the Airline Agreement, an Improvement and Development Fund is established that can be used for Airport System capital projects at the County s sole discretion. The Improvement and Development Fund is funded from any remaining Airport System earnings after the payment of O&M Expenses, the payment of FINAL DRAFT 3-8 SEPTEMBER 05, 2007
97 3.0 CAPITAL IMPROVEMENT PLAN PHASING AND FUNDING SOURCES Table 1.3 Projection of PFC Revenue Fiscal Year Enplanements 1 3,723,800 3,842,600 3,979,500 4,138,700 4,264,600 4,394,900 4,529,900 4,669,700 4,814,700 4,958,600 5,107,400 5,261,400 5,420,700 5,585,600 5,748,100 5,916,900 6,092,300 6,274,500 6,463,900 PFC per passenger $4.50 $4.50 $6.00 $6.00 $6.00 $6.00 $6.00 $6.00 $6.00 $6.00 $6.00 $6.00 $6.00 $6.00 $6.00 $6.00 $6.00 $6.00 $6.00 Admin. $0.11 $0.11 $0.11 $0.11 $0.11 $0.11 $0.11 $0.11 $0.11 $0.11 $0.11 $0.11 $0.11 $0.11 $0.11 $0.11 $0.11 $0.11 $0.11 % eligible 90% 90% 90% 90% 90% 90% 90% 90% 90% 90% 90% 90% 90% 90% 90% 90% 90% 90% 90% PFC Revenues 14,712,734 15,182,113 21,095,330 21,939,249 22,606,645 23,297,365 24,013,000 24,754,080 25,522,725 26,285,539 27,074,327 27,890,681 28,735,131 29,609,266 30,470,678 31,365,487 32,295,282 33,261,125 34,265,134 Investment Earnings 3.50% 3.50% 3.50% 3.50% 3.50% 3.50% 3.50% 3.50% 3.50% 3.50% 3.50% 3.50% 3.50% 3.50% 3.50% 3.50% 3.50% 3.50% 3.50% Net PFC Revenues Capacity $14,970,207 $15,447,800 $21,464,498 $22,323,186 $23,002,261 $23,705,069 $24,433,227 $25,187,276 $25,969,372 $26,745,536 $27,548,128 $28,378,768 $29,237,995 $30,127,428 $31,003,915 $31,914,383 $32,860,450 $33,843,194 $34,864,774 Pay-As-You-Go (FY FY 2025) 2,883,575 11,442,000 20,365,500 7,991,500 11,273,065 2,237,834 1,007, ,000, Future PFC Debt Service Series 2009 (FY '09-'10 Projects) 4,604,709 4,604,709 4,604,709 4,604,709 4,604,709 4,604,709 4,604,709 4,604,709 4,604,709 4,604,709 4,604,709 4,604,709 4,604,709 4,604,709 4,604,709 4,604,709 Future PFC Debt Service Series 2011 (FY '11-12 projects) 14,010,097 14,010,097 14,010,097 14,010,097 14,010,097 14,010,097 14,010,097 14,010,097 14,010,097 14,010,097 14,010,097 14,010,097 14,010,097 14,010,097 Future PFC Debt Service - Series 2013 (FY '13 projects) 6,981,109 6,981,109 6,981,109 6,981,109 6,981,109 6,981,109 6,981,109 6,981,109 6,981,109 6,981,109 6,981,109 6,981,109 6,981,109 Future PFC Debt Service - Series 2017 (FY '17 projects) 2,117,355 2,117,355 2,117,355 2,117,355 2,117,355 2,117,355 2,117,355 2,117,355 2,117,355 Annual Remaining for PAYG or Future Debt Service $12,086,632 $4,005,800 ($3,505,711) $1,735,477 $4,387,455 $5,090,263 ($1,162,687) ($11,681,704) ($1,864,376) $141,891 ($165,142) $665,498 $1,524,725 $1,414,158 $3,290,645 $4,201,113 $5,147,180 $6,129,924 $7,151,504 Ending Balance $12,086,632 $16,092,431 $12,586,720 $14,322,197 $18,709,652 $23,799,915 $22,637,228 $10,955,524 $9,091,148 $9,233,039 $9,067,897 $9,733,395 $11,258,120 $12,672,278 $15,962,923 $20,164,036 $25,311,215 $31,441,139 $38,592,643 Note: 1/ Based on forecast growth rate calculated by Ricondo & Associates, Inc., for the County s Series 2006 Bonds. Source: Palm Beach County Department of Airports; Ricondo & Associates, Inc. Prepared by: Ricondo & Associates, Inc. FINAL DRAFT 3-9 SEPTEMBER 05, 2007
98 3.0 CAPITAL IMPROVEMENT PLAN PHASING AND FUNDING SOURCES outstanding debt service, the funding of other reserves, and the payment of Airline Rebates. Any additional local funding, beyond what can be funded from the Improvement and Development Fund, would require the issuance of GARBs. Approximately $18.7 million of Master Plan project costs is expected to be funded from Airport funds General Airport Revenue Bonds (GARBs) The County anticipates funding the $224 million long-term parking garage with GARB proceeds. This project is not anticipated to be necessary until FY 2023 and resulting annual debt service on the bonds is anticipated to be approximately $20 million per year based on the following assumptions: 30-year term One year construction period and capitalized interest period 6.5 percent interest rate Establishment of a Debt Service Reserve Account equivalent to the maximum annual debt service. Final Draft 3-10 SEPTEMBER 05, 2007
99 4.0 Debt Service Requirements Table 1.4 presents the annual estimated debt service requirements on the outstanding Airport Bonds as well as estimated debt service on projects expected to be funded with PFC-backed bonds for FY 2007 through FY As presented in Table 1.4, the annual debt service requirement is approximately $15.2 million from FY 2007 until FY 2011 when existing annual debt service increases to $17.3 million. In FY 2015, existing annual debt service decreases to $6.8 million. Debt service on the County s Series 2006B Bonds was structured to increase in FY 2015 to coincide with the retirement of the outstanding Series 2001 and Series 2002 Bonds. As described previously, estimated annual PFC-backed debt on projects included in this Master Plan is projected to total $15.7 million in FY 2017 and ample capacity is expected to be available to fund the debt service from PFC revenues. As described above, the parking garage is the only project included in this Master Plan that is planned to be funded with future long-term debt ($224 million) projected to begin in FY Resulting annual debt service is conservatively projected to be $20 million beginning in FY More detailed analysis should be performed as the project start date nears to determine if revenue bonds are the optimal funding source for this project. FINAL DRAFT 4-1 SEPTEMBER 05, 2007
100 SECTION 4.0 DEPT SERVICE REQUIREMENTS Table 1.4 Projected Debt Service Fiscal Year SUBORDINATED INDEBTEDNESS $1,262,500 $40,000 $1,080,000 $1,040, Existing Debt: Series ,205,813 8,267,363 8,288,363 8,313, Series ,611,075 2,611,075 2,611,075 2,611,075 12,881,075 13,015,550 13,033,338 13,218, Series 2006A 1,2 3,418,480 3,418,480 3,418,480 3,418,480 3,418,480 3,418,480 3,418,480 3,418,480 3,418,480 3,418,480 3,418,480 Series 2006B 1,2 995, , , , , , , ,288 3,420,288 3,417,092 3,415,628 TOTAL GARB DEBT SERVICE $15,230,655 $15,292,205 $15,313,205 $15,338,780 $17,294,843 $17,429,318 $17,447,105 $17,632,518 $6,838,768 $6,835,572 $6,834,108 Future Debt: Series 2009 (PFC) 0 0 9,116,141 9,116,141 9,116,141 9,116,141 9,116,141 9,116,141 9,116,141 9,116,141 9,116,141 Series 2015 (PFC) ,457,719 4,457,719 4,457,719 Series 2017 (PFC) ,117,355 TOTAL FUTURE PFC DEBT SERVICE $0 $0 $9,116,141 $9,116,141 $9,116,141 $9,116,141 $9,116,141 $9,116,141 $13,573,860 $13,573,860 $15,691,215 Notes: 1/ Series 2006 A & B Bonds Official Statement 2/ Columns may not add due to rounding. Source: Series 2006 A & B Bonds Official Statement Prepared by: Ricondo & Associates, Inc. FINAL DRAFT 4-2 SEPTEMBER 05, 2007
101 5.0 O&M Expenses Projections of future O&M Expenses are based on analysis of historical activity, the anticipated effects of inflation, planned facility improvements and expansions, and forecast activity increases. Table 1.5 presents projected O&M Expenses for FY 2007 through FY As shown, O&M Expenses are projected to increase from $42.7 million in FY 2007 to $69.6 million in FY 2017, at a compounded annual growth rate of 5.0 percent. FINAL DRAFT 5-1 SEPTEMBER 05, 2007
102 SECTION 5.0 O&M EXPENSES Table 1.5 Projected O&M Expenses Fiscal Year Airside $6,030,836 $6,332,378 $6,648,997 $6,981,447 $7,330,519 $7,697,045 $8,081,897 $8,485,992 $8,910,292 $9,355,806 $9,823,597 Terminal 14,534,052 15,260,755 16,023,792 16,824,982 17,666,231 18,549,543 19,477,020 20,450,871 21,473,414 22,547,085 23,674,439 Tenant Equipment 1,690,460 1,774,983 1,863,732 1,956,918 2,054,764 2,157,502 2,265,377 2,378,646 2,497,579 2,622,458 2,753,580 Ground Transportation 13,131,749 13,788,336 14,477,753 15,201,641 15,961,723 16,759,809 17,597,799 18,477,689 19,401,574 20,371,652 21,390,235 Aviation 2,468,380 2,591,799 2,721,389 2,857,459 3,000,332 3,150,348 3,307,866 3,473,259 3,646,922 3,829,268 4,020,732 Non-Aviation 1,096,528 1,151,354 1,208,922 1,269,368 1,332,836 1,399,478 1,469,452 1,542,925 1,620,071 1,701,074 1,786,128 Terminal FIS 298, , , , , , , , , , ,709 Lantana 687, , , , , , , ,281 1,015,645 1,066,427 1,119,749 Glades 810, , , , ,821 1,034,062 1,085,765 1,140,054 1,197,056 1,256,909 1,319,754 North County Airport 1,855,819 1,948,610 2,046,041 2,148,343 2,255,760 2,368,548 2,486,975 2,611,324 2,741,890 2,878,985 3,022,934 Air Cargo Building 132, , , , , , , , , , ,882 TOTAL O&M EXPENSES $42,736,183 $44,872,993 $47,116,642 $49,472,474 $51,946,098 $54,543,403 $57,270,573 $60,134,102 $63,140,807 $66,297,847 $69,612,739 Source: Palm Beach County Department of Airports; Ricondo & Associates, Inc. Prepared by: Ricondo & Associates, Inc. FINAL DRAFT 5-2 SEPTEMBER 05, 2007
103 6.0 Airport Revenues (Nonairline and Airline) Airport revenues are generated from nonairline sources, such as tenant leases and other miscellaneous agreements, and from airline sources in accordance with the Airline Agreements, Cargo Agreements, and the Bond Resolution. Nonairline revenues are categorized by the Direct Cost Center in which they occur. 6.1 Nonairline Revenues Nonairline revenues for FY 2007 through FY 2017 are presented in Table 1.6. As shown, total Nonairline revenues are projected to increase from approximately $45.6 million in FY 2007 to approximately $63.0 million in FY 2017 at a compounded annual growth rate of 3.5 percent throughout the projection period Airside The major source of nonairline revenues in the Airside Cost Center is aviation fueling. Total Airside revenues are projected to increase from approximately $1.3 million in FY 2007 to approximately $2.1 million in FY This increase represents a compounded annual growth rate of 4.6 percent during this period, and is the result of forecast growth in aircraft operations and the effects of inflation during the projection period Terminal Nonairline revenues in the Terminal Cost Center primarily consist of rentals and fees from news and gift and food and beverage concessionaires, advertisers, and miscellaneous concessionaires, as well as nonairline Terminal rental revenues, airline reimbursements for tenant equipment and security charges, and federal inspection services (FIS) facility fees. These revenues are projected to increase from approximately $7.0 million in FY 2007 to approximately $9.5 million in FY This increase represents a compounded annual growth rate of 3.2 percent during this period, and is the result of forecast growth in numbers of enplaned passengers and the effects of inflation during the projection period Ground Transportation Revenues from the Ground Transportation Cost Center primarily consist of automobile parking revenues, taxicab and limousine parking fees, and rental car concession fees. Total Ground Transportation revenues are projected to increase from approximately $29.4 million budgeted for FY 2007 to approximately $40.9 million in FY This increase represents a compounded annual growth rate of 3.4 percent during this period, and is the result of forecast growth in numbers of enplaned passengers and anticipated parking rate increases as well as the effects of inflation during the projection period. FINAL DRAFT 6-1 SEPTEMBER 05, 2007
104 SECTION 6 AIRPORT REVENUES (NONAIRLINE AND AIRLINE) Table 1.6 Projected Nonairline Revenues Projected Fiscal Year Airside Revenues $1,326,699 $1,387,170 $1,452,929 $1,524,923 $1,593,351 $1,664,962 $1,739,932 $1,818,410 $1,900,604 $1,985,439 $2,074,188 Terminal Revenues $6,914,483 $7,121,823 $7,346,609 $7,591,917 $7,826,078 $8,070,915 $8,327,012 $8,594,857 $8,875,141 $9,164,401 $9,466,760 Ground Transportation $29,331,816 $30,133,886 $31,018,838 $32,002,464 $34,785,123 $35,718,278 $36,686,575 $37,691,203 $38,734,582 $39,792,780 $40,890,506 Aviation $1,652,179 $1,696,344 $1,741,835 $1,788,690 $1,836,950 $1,886,659 $1,937,859 $1,990,594 $2,044,912 $2,100,860 $2,158,485 Air Cargo Facility $236,900 $244,007 $251,327 $258,867 $266,633 $274,632 $282,871 $291,357 $300,098 $309,101 $318,374 Non-Aviation $1,745,850 $1,798,226 $1,852,172 $1,907,737 $1,964,970 $2,023,919 $2,084,636 $2,147,175 $2,211,591 $2,277,938 $2,346,276 Other Revenues $4,429,838 $4,594,906 $4,737,035 $4,845,357 $4,992,905 $5,188,212 $5,381,814 $5,553,745 $5,687,643 $5,732,447 $5,778,594 Total Nonairline Revenues $45,637,765 $46,976,362 $48,400,745 $49,919,955 $53,266,011 $54,827,577 $56,440,699 $58,087,342 $59,754,571 $61,362,966 $63,033,183 Source: Palm Beach County Department of Airports; Ricondo & Associates, Inc. Prepared by: Ricondo & Associates, Inc. Final Draft 6-2 SEPTEMBER 05, 2007
105 SECTION 6 AIRPORT REVENUES (NONAIRLINE AND AIRLINE) Aviation Revenues from the Aviation Cost Center consist primarily of facility and ground rents and flight kitchen revenues. These revenues are projected to increase from approximately $1.7 million in FY 2007 to approximately $2.2 million in FY This increase represents a compounded annual growth rate of 2.7 percent during this period, and reflects the expected effects of inflation during the projection period Air Cargo Building Revenues from the Air Cargo Building are projected to increase from approximately $237,000 in FY 2007 to approximately $318,000 in FY This increase represents a compounded annual growth rate of 3.0 percent during this period, and is the result of the expected effects of inflation during the projection period Non-Aviation Revenues from the Non-Aviation Cost Center consist of non-aviation ground and building rents. These revenues are projected to increase from approximately $1.7 million in FY 2007 to approximately $2.3 million in FY This increase represents a compounded annual growth rate of 3.0 percent during this period, and is the result of the expected effects of inflation during the projection period Other Revenues Revenues from the three reliever general aviation airports and investment earnings are projected to increase from approximately $4.4 million in FY 2007 to approximately $5.8 million in FY This increase represents a compounded annual growth rate of 3.3 percent during this period, as a result of the expected effects of inflation and increasing fund balances during the projection period. 6.2 Airline Revenues The remaining revenues generated at the Airport include Terminal rentals, landing fees, and apron fees payable by the airlines. In general, the airline rate-base for the Terminal rental rate and landing fee calculations consists of the following elements: O&M Expenses - These expenses are attributed to the various rate-setting areas for the Terminal and Airside Cost Centers and the allocated portion of indirect O&M Expenses. O&M Reserve - This requirement represents the amount necessary to fund and replenish the O&M Reserve Fund as required by the Bond Resolution, equal to one-sixth of O&M Expenses. Debt Service - Debt service requirements attributable to the rate-setting areas resulting from all GARBs and subordinate indebtedness. Debt Service Coverage - The County must maintain rental rates, fees, and charges sufficient to meet the rate covenant in the Bond Resolution. FINAL DRAFT 6-3 SEPTEMBER 05, 2007
106 SECTION 6 AIRPORT REVENUES (NONAIRLINE AND AIRLINE) Debt Service Reserve Funding - As required by the Bond Resolution, the amount, if any, required to replenish the Debt Service Reserve Account to its minimum balance. Amortization - This amount represents the annual capital expenditures that were initially funded by the County and then amortized through the airline rate base over the useful life of the project. Certain Terminal and Airside revenues offset these rate base items. As described previously, a portion of the funds remaining from the previous year (known as the Transfer) is allocated to the Signatory Airlines to partially offset their rentals, fees, and charges Terminal Rentals The Terminal rental rate calculation combines Terminal Cost Center-specific Direct and Indirect O&M Expenses and the O&M Reserve requirement; total debt service, debt service coverage, and the debt service reserve requirement; and amortization; less: Concourse Security Reimbursements, Air Carrier FIS facility fees, and a portion of airline catering revenues. This net requirement is divided by the sum of rentable square footage in the Terminal to determine the average Terminal rental rate per square foot. Currently, the County assigns 80 percent of the Transfer to the Terminal rental rate calculation. The Transfer reduces the average Terminal rental rate to the Signatory Airline rental rate. Table 1.7 presents the Terminal rental rate for FY 2007 through FY As shown, the Signatory Airline Terminal rental rate is projected to increase from $49.17 per square foot in FY 2007 to $56.50 per square foot in FY 2017 as a result of increasing O&M expenses partially offset by increased parking revenues and decreasing debt service that positively affect the airline Transfer included in the rate base Landing Fees The Signatory Airline landing fee calculation combines Airside Cost Center-specific Direct and Indirect O&M Expenses and the O&M Reserve requirement; total debt service, debt service coverage and the debt service reserve requirement; and amortization; less: non-signatory airline landing fees, Airside services revenues, aviation fueling revenues, a portion of airline catering revenues, and 10% of the Airside requirement that is recovered from Apron fees. This net requirement is divided by landed weight to determine the Signatory Airline landing fee rate. The non-signatory airlines are assessed a 25 percent surcharge on the Signatory Airline landing fee rate. Table 1.8 presents Signatory Airline landing fees for FY 2007 through FY As shown, the Signatory Airline landing fee rate is projected to decrease from $0.88 per 1,000 pounds of landed weight in FY 2007 to $0.94 per 1,000 pounds of landed weight in FY 2017 as a result of increased parking revenues and decreasing debt service that positively affect the airline Transfer included in the rate base partially offset by increasing O&M expenses. FINAL DRAFT 6-4 SEPTEMBER 05, 2007
107 SECTION 6 AIRPORT REVENUES (NONAIRLINE AND AIRLINE) Table 1.7 Terminal Rental Rates Projected Fiscal Year TERMINAL RENTAL RATES: Operating Expenses $14,534,052 $15,260,755 $16,023,792 $16,824,982 $17,666,231 $18,549,543 $19,477,020 $20,450,871 $21,473,414 $22,547,085 $23,674,439 O&M Reserve (1/6 annual) 140, , , , , , , , , , ,581 Debt Service 5,698,193 5,727,885 5,738,015 5,750,353 6,693,957 6,758,828 6,767,409 6,856,852 1,649,947 1,648,405 1,647,699 Debt Service Coverage (25%) 1,424,548 1,431,971 1,434,504 1,437,588 1,673,489 1,689,707 1,691,852 1,714, , , ,925 Debt Service Reserve Requirement Amortization Charges 461, , , , , , , , , , ,912 Total Terminal Requirement $22,259,057 $23,266,194 $24,049,294 $24,873,675 $26,897,343 $27,789,199 $28,736,396 $29,831,494 $24,182,997 $25,265,152 $26,402,556 Less: Concourse Security Reimbursements Air Carrier FIS Facility 30,000 30,000 30,000 30,000 30,000 30,000 30,000 30,000 30,000 30,000 30,000 Applicable Direct Revenue and Reimburs: Airline Catering (25%) 45,000 45,000 45,000 45,000 45,000 45,000 45,000 45,000 45,000 45,000 45,000 NET REQUIREMENT $22,184,057 $23,191,194 $23,974,294 $24,798,675 $26,822,343 $27,714,199 $28,661,396 $29,756,494 $24,107,997 $25,190,152 $26,327,556 Rentable Terminal Area 329, , , , , , , , , , ,339 Average Terminal Rental Rate $67.27 $66.58 $68.82 $71.19 $77.00 $79.56 $82.28 $85.42 $69.21 $72.32 $75.58 Total Airline Terminal Space 274, , , , , , , , , , ,843 Signatory Airline Leased Terminal Space 231, , , , , , , , , , ,077 Airline Share of Net Requirement $15,562,717 $16,067,560 $16,610,116 $17,181,272 $19,512,496 $20,161,296 $20,850,355 $22,729,359 $18,414,780 $19,241,380 $20,110,180 Less Transfers 4,188,085 2,233,831 2,574,432 2,133,072 2,128,739 3,242,534 3,183,193 3,120,767 3,439,933 5,283,148 5,077,601 Signatory Airline Requirement 11,374,632 13,833,729 14,035,684 15,048,200 17,383,757 16,918,762 17,667,163 19,608,592 14,974,848 13,958,231 15,032,579 Signatory Airline Leased Terminal Space 231, , , , , , , , , , ,077 Signatory Terminal Rental Rate $49.17 $57.32 $58.16 $62.35 $68.60 $66.77 $69.72 $73.70 $56.28 $52.46 $56.50 Terminal Revenue by Type: Type 1 $566,309 $658,809 $668,427 $716,646 $827,873 $805,729 $841,370 $933,828 $713,153 $664,738 $715,902 Type 2 3,663,902 4,539,827 4,606,103 4,938,381 5,704,843 5,552,245 5,797,848 6,434,969 4,914,309 4,580,685 4,933,255 Type 3 3,661,169 4,259,178 4,321,357 4,633,094 5,352,173 5,209,009 5,439,429 6,037,163 4,610,510 4,297,510 4,628,284 Type 4 3,041,034 3,861,465 3,917,837 4,200,465 4,852,399 4,722,603 4,931,507 5,473,426 4,179,990 3,896,218 4,196,105 Type 5 442, , , , , , , , , , ,033 Total Terminal Revenue $11,374,632 $13,833,729 $14,035,684 $15,048,200 $17,383,757 $16,918,762 $17,667,163 $19,608,592 $14,974,848 $13,958,231 $15,032,579 Notes: 1/ Effective October 1, 2006, the County discontinued a separate passenger screening charge. Source: Palm Beach County Department of Airports; Ricondo & Associates, Inc. Prepared by: Ricondo & Associates, Inc. FINAL DRAFT 6-5 SEPTEMBER 05, 2007
108 SECTION 6 AIRPORT REVENUES (NONAIRLINE AND AIRLINE) Table 1.8 Projected Landing Fees Projected Fiscal Year Landing Fees: Operating Expenses $6,030,836 $6,332,378 $6,648,997 $6,981,447 $7,330,519 $7,697,045 $8,081,897 $8,485,992 $8,910,292 $9,355,806 $9,823,597 O&M Reserve (1/6 annual) 20,570 21,624 22,705 23,840 25,032 26,284 27,598 28,978 30,427 31,948 33,545 Debt Service 1,146,962 1,152,939 1,154,978 1,157,461 1,347,395 1,360,452 1,362,180 1,380, , , ,657 Debt Service Coverage (25%) 286, , , , , , , ,046 83,027 82,950 82,914 Debt Service Reserve Requirement Amortization Charges 84,018 84,018 84,018 77,169 77,169 77,169 77,169 77,169 18,073 18,073 18,073 Total Airside Requirement $7,569,127 $7,879,193 $8,199,442 $8,529,282 $9,116,964 $9,501,063 $9,889,388 $10,317,368 $9,373,929 $9,820,577 $10,289,787 Less: Applicable Direct Revenue and Reimburse: Nonsignatory Landing Fee Revenue $75,869 $88,080 $90,451 $96,240 $104,210 $104,135 $109,132 $114,698 $97,238 $94,757 $101,404 Airside Services 30,900 31,827 32,782 33,765 34,778 35,822 36,896 38,003 39,143 40,317 41,527 Aviation Fueling 1,295,799 1,355,343 1,420,147 1,491,158 1,558,573 1,629,141 1,703,036 1,780,407 1,861,461 1,945,122 2,032,661 Airline Catering (25%) 45,000 45,000 45,000 45,000 45,000 45,000 45,000 45,000 45,000 45,000 45,000 Apron Fees (10%) 756, , , , , , ,939 1,031, , ,058 1,028,979 ADJUSTED REQUIREMENT $5,364,646 $5,571,023 $5,791,118 $6,010,191 $6,462,705 $6,736,860 $7,006,385 $7,307,524 $6,393,694 $6,713,323 $7,040,216 Less: Transfers 1,047, , , , , , , , ,983 1,320,787 1,269,400 NET REQUIREMENT $4,317,625 $5,012,565 $5,147,510 $5,476,923 $5,930,521 $5,926,226 $6,210,587 $6,527,332 $5,533,711 $5,392,536 $5,770,816 Signatory Landed Weight (1,000 pounds) 4,807,150 4,928,695 5,049,693 5,169,868 5,291,309 5,415,078 5,529,116 5,655,400 5,767,365 5,882,712 6,000,366 Nonsignatory Landed Weight (1,000 pounds) 78,165 80,141 82,109 84,063 86,038 88,050 89,904 91,958 93,778 95,654 97,567 Total Landed Weight (1,000 pounds) 4,885,315 5,008,837 5,131,802 5,253,930 5,377,346 5,503,128 5,619,020 5,747,358 5,861,143 5,978,366 6,097,933 Landing Fee Rate $0.88 $1.00 $1.00 $1.04 $1.10 $1.08 $1.10 $1.13 $0.94 $0.90 $0.94 Nonsignatory Surcharge 10.0% 10.0% 10.0% 10.0% 10.0% 10.0% 10.0% 10.0% 10.0% 10.0% 10.0% Nonsignatory Landing Fee Rate $0.97 $1.10 $1.10 $1.14 $1.21 $1.18 $1.21 $1.25 $1.04 $0.99 $1.04 Signatory Landing Fee Revenue $4,241,756 $4,924,485 $5,057,058 $5,380,683 $5,826,310 $5,822,091 $6,101,456 $6,412,634 $5,436,473 $5,297,779 $5,669,412 Nonsignatory Landing Fee Revenue 75,869 88,080 90,451 96, , , , ,698 97,238 94, ,404 Source: Palm Beach County Department of Airports; Ricondo & Associates, Inc. Prepared by: Ricondo & Associates, Inc. FINAL DRAFT 6-6 SEPTEMBER 05, 2007
109 7.0 Cost per Enplaned Passenger Airline revenues are divided by the number of enplaned passengers to yield the cost per enplaned passenger for the airlines in total. The number of enplaned passengers is forecast to increase at a compounded annual growth rate of 3.0 percent from FY 2007 through FY As presented in Table 1.9, the airline cost per enplaned passenger is projected to decrease from $4.93 in FY 2007 to $4.71 in FY FINAL DRAFT 7-1 SEPTEMBER 05, 2007
110 SECTION 7.0 COST PER ENPLANED PASSENGER Table 1.9 Projected Cash Flow / Coverage Calculation / Cost per Enplaned Passenger Projected Fiscal Year Airline Revenues: Landing Fees $4,317,625 $5,012,565 $5,147,510 $5,476,923 $5,930,521 $5,926,226 $6,210,587 $6,527,332 $5,533,711 $5,392,536 $5,770,816 Landing Fee Rebate Apron Fees 756, , , , , , ,939 1,031, , ,058 1,028,979 Terminal Rentals 11,374,632 13,833,729 14,035,684 15,048,200 17,383,757 16,918,762 17,667,163 19,608,592 14,974,848 13,958,231 15,032,579 Tenant Equipment Charges 2,200,000 2,200,000 2,200,000 2,200,000 2,200,000 2,200,000 2,200,000 2,200,000 2,200,000 2,200,000 2,200,000 Passenger Screening Revenues FIS Revenues 30,000 30,000 30,000 30,000 30,000 30,000 30,000 30,000 30,000 30,000 30,000 Total Airline Revenues $18,679,170 $21,864,214 $22,233,138 $23,608,051 $26,455,974 $26,025,094 $27,096,689 $29,397,660 $23,675,952 $22,562,825 $24,062,374 Nonairline Revenues 1 43,407,765 44,746,362 46,170,745 47,689,955 51,036,011 52,597,577 54,210,699 55,857,342 57,524,571 59,132,966 60,803,183 PFC Revenues Available for DS and Coverage ,395,176 11,395,176 11,395,176 11,395,176 11,395,176 11,395,176 16,967,325 16,967,325 19,614,019 Subtotal Revenues $62,086,935 $66,610,576 $79,799,059 $82,693,183 $88,887,161 $90,017,847 $92,702,564 $96,650,178 $98,167,847 $98,663,115 $104,479,576 Prior Year Transfer 5,608,942 3,166,125 3,591,876 3,040,176 3,034,760 4,427,004 4,352,827 4,274,795 4,673,752 6,843,292 6,586,246 TOTAL REVENUES $67,695,877 $69,776,701 $83,390,935 $85,733,358 $91,921,921 $94,444,851 $97,055,391 $100,924,973 $102,841,599 $105,506,408 $111,065,822 Less: O&M Expenses 42,736,183 44,872,993 47,116,642 49,472,474 51,946,098 54,543,403 57,270,573 60,134,102 63,140,807 66,297,847 69,612,739 NET REVENUES $24,959,694 $24,903,708 $36,274,292 $36,260,884 $39,975,823 $39,901,448 $39,784,818 $40,790,871 $39,700,793 $39,208,561 $41,453,083 Less: O&M Reserve 338, , , , , , , , , , ,482 Debt Service 15,230,655 15,292,205 15,313,205 15,338,780 17,294,843 17,429,318 17,447,105 17,632,518 6,838,768 6,835,572 6,834,108 Future PFC Debt Service 0 0 9,116,141 9,116,141 9,116,141 9,116,141 9,116,141 9,116,141 13,573,860 13,573,860 15,691,215 Debt Service Reserve Requirement Subordinated Debt Repayment 1,262,500 40,000 1,080,000 1,040, FUNDS REMAINING $8,127,756 $9,215,368 $10,391,005 $10,373,324 $13,152,569 $12,923,106 $12,767,043 $13,564,958 $18,787,048 $18,272,956 $18,375,278 Coverage Calculation: Net Revenues less O&M Reserve 24,620,912 24,547,573 35,900,351 35,868,245 39,563,552 39,468,564 39,330,289 40,313,617 39,199,675 38,682,387 40,900,601 Debt Service 15,230,655 15,292,205 24,429,346 24,454,921 26,410,984 26,545,459 26,563,246 26,748,659 20,412,627 20,409,432 22,525,323 Coverage Cost per Enplaned Passenger: Airline Revenues $18,679,170 $21,864,214 $22,233,138 $23,608,051 $26,455,974 $26,025,094 $27,096,689 $29,397,660 $23,675,952 $22,562,825 $24,062,374 Enplanements 3,723,800 3,842,600 3,979,500 4,138,700 4,264,600 4,394,900 4,529,900 4,669,700 4,814,700 4,958,600 5,107,400 Cost Per Enplaned Passenger $5.02 $5.69 $5.59 $5.70 $6.20 $5.92 $5.98 $6.30 $4.92 $4.55 $4.71 Notes: 1/ Does not include Tenant Equipment Charges, Passenger Screening Revenues, or FIS Revenues. Source: Palm Beach County Department of Airports; Ricondo & Associates, Inc. Prepared by: Ricondo & Associates, Inc. FINAL DRAFT 7-2 SEPTEMBER 05, 2007
111 8.0 Cash Flow Table 1.9 also shows the funds remaining after O&M Expenses and debt service are deducted from total revenues. The funds remaining are available for the calculation of debt service coverage and to fund capital projects. This table also shows the calculation of debt service coverage. FINAL DRAFT 8-1 SEPTEMBER 05, 2007
112 9.0 Debt Service Coverage Debt service coverage is calculated by subtracting O&M Expenses and O&M Reserve from total revenues and then dividing the result by debt service for the period. Coverage must be at least 1.25 times debt service as required by the Bond Resolution. As presented in Table 1.9, debt service coverage for the Airport is projected to be higher than the minimum 1.25 times required in every year of the projection period, indicating that the Airport System is projected to have adequate resources to meet its debt service obligations throughout the projection period. FINAL DRAFT 9-1 SEPTEMBER 05, 2007
113 10.0 Summary of Baseline Scenario Based on analyses of forecast activity at the Airport, in addition to projected revenues and expenses, and the Airport System Capital Improvement Plan for FY 2007 through FY 2025, it appears that the County has adequate resources and the Airport System has adequate growth capacity to meet future demand. The County has access to various sources of funding and, through a mix of FAA funding, State funding, PFC revenues, General Airport Revenue Bonds and PFC-backed bonds, and Airport funds. The capital projects recommended in the Master Plan appear to be financially feasible and the County can reasonably expect to implement these projects. The airline rates and overall airline cost per enplaned passenger remain reasonable over the shorter term planning period (through FY 2017) and projected Airport System funds appear to be adequate to effectively operate the Airport System. As required in the Bond Resolution, debt service coverage is projected to be significantly above the minimum 125 percent of debt service throughout the projection period. FINAL DRAFT 10-1 SEPTEMBER 05, 2007
114 11.0 Sensitivity Analysis 1 The baseline financial scenario was based on eligibility of projects for various types of funding. This section evaluates a modified funding scenario based on the following assumptions: FAA and State Funding are capped at Historical Levels experienced by the airport system. PFCs are collected at a $4.50 per enplaned passenger level. FAA entitlement are calculated based on the existing FAA formula incorporating the baseline forecast of enplanements and a $4.50 PFC. FAA discretionary funds for FY 2008 through FY 2016 are estimated to be $500,000 per year. Additional FAA discretionary funds for FY 2010 through FY 2014 are estimated to be $100 million for the five-year period, secured with an LOI and distributed over the five-year period ($20 million annually) FDOT funds are estimated to be $2.5 million per year for PBI; and $500,000 per year (total) for the 3 GA airports. FDOT (SIS) Funding is estimated to be $10,898,000 in FY Timing of projects is projected to be delayed when necessary to ensure adequate funding availability. Hangars at reliever / general aviation airports will be funded with bond proceeds and will only be undertaken if hangar revenues are sufficient to repay annual debt service. Based on analyses of forecast activity at the Airport, in addition to projected revenues and expenses, and the Airport System Capital Improvement Plan for FY 2007 through FY 2025 based on the above assumptions, it appears that the County has adequate financial resources and the Airport System has adequate growth capacity to meet future demand under this scenario. However, airline rates and charges would increase significantly over the baseline scenario. Table 1.10 presents the funding sources assumed in Scenario 1. After incorporating the funding sources and other assumptions, Table 1.11 illustrates selected airline rates and charges, cost per enplanement, debt service coverage and ending balance in the Airport s capital account through FY 2017 that result from this scenario and compares the financial results to the baseline scenario. As presented, airline rates and charges are projected to be higher and the balance in the Airport s Improvement and Development fund is projected to be lower in Scenario 1 compared to the Baseline Scenario. FINAL DRAFT 11-1 SEPTEMBER 05, 2007
115 11.0 SENSITIVITY ANALYSIS 1 Table 1.10 (1 of 3) Capital Improvement Plan Summary of Funding Sources Funding Source Total Project AIP AIP Project Escalated Dollars Ent Disc FDOT PFC Airport Cash GARBs PALM BEACH INTERNATIONAL AIRPORT Expand and Rehab Overnight Parking Apron $740,000 $0 $0 $370,000 $370,000 $0 $0 Apron "A" Expansion 3,420, ,220,000 2,200, NAVAID Relocation Study 300, , Construct Maintenance Compound 1,000, ,000, Rehabilitate Aircraft Parking Apron 1,090, ,090, Extension of Taxiway "F" to RW 13 13,400, ,888,000 10,512, Extend Runway 9R-27L Environmental & Design 8,284, ,284, Extension of Taxiway "L" (Lima) 17,700, ,500 16,841, Miscellaneous taxiway rehab 5,250, ,253,500 2,625,000 1,371,500 0 New Taxiway Connector - Runway 9L-27R 5,300,000 1,676, , ,500 2,461,250 0 Taxiway Romeo (West of R1) 20,825, ,733, ,500 3,629,167 12,625,398 Taxiway C4 High Speed Exit - Rwy 9L-27R 5,084, ,400 4,575,600 0 Taxiway D High Speed Exit - Rwy 9L-27R 4,721, ,100 4,248,900 0 Replace (2) Fire Rescue Vehicles 2,250, ,250,000 1,000,000 0 Concourse "A" Redevelopment 20,375, ,300,000 2,075,000 0 Acquire land runway 9L-27R 7,094,817 1,705,100 5,014, , Taxiway Lima (West) Upgrades and Improvements 17,048,000 1,731,150 1,303,050 2,500,000 11,513, Runway 9R Property Acquisition 35,846, ,948,900 5,974,000 9,923, ,000,000 Golfview Apron, Taxilanes/Taxiways and Infrastructure 74,000, ,000, ,000, Golfview Facilities 130,000, ,500, ,500, Relocate VOR 3,939, ,414,000 2,525, Taxiway Charlie (East) Improvements 7,800, ,510,000 4,290, Extend, Relocate and Upgrade RWY 9R-27L 77,101, ,000, ,000,000 5,000,000 39,101,000 Construct Apron Golfview 2 6,000, ,000, Construct Surface Parking Lot 1,426, ,426,946 0 Demolition East of Runway ,600, ,200,000 1,000,000 14,400,000 Demolition West of Runway ,600,000 1,755, ,325, ,519,500 Runway Pavement Removal 2,500,000 1,779, , ,550 0 Runway 13-31, Taxiway F and Taxiway B Extensions and Taxiway Connectors 23,000, ,500,000 2,875,000 17,625,000 0 Part 150 Study PBIA 800, ,000 40, ,000 Final Draft 11-2 SEPTEMBER 05, 2007
116 11.0 SENSITIVITY ANALYSIS 1 Table 1.10 (2 of 3) Capital Improvement Plan Summary of Funding Sources Funding Source Total Project AIP AIP Project Escalated Dollars Ent Disc FDOT PFC Airport Cash GARBs Rehabilitate Taxiway C 8,500,000 1,804, ,445,500 2,445, ,804,500 New Parking Revenue Center 2,609, ,609,546 0 New Cargo Apron 5,461,307 1,829, , , ,086,077 Concourse "B" Expansion 29,500,000 1,853, ,500, ,000,000 20,146,250 Miscellaneous Taxiway Rehab 2,687, , ,187,834 New Belly Cargo/All Cargo Facility 33,131, ,131,938 Cargo Apron Expansion 3,070,758 1,878, , ,038,795 Construct Surface Parking Lot 4,270, ,500, , ,770 Terminal Building Baggage System Expansion 24,979, ,979, Construct Surface Parking Lot 5,806, ,806,149 0 New Parking Garage 224,176, ,176,582 Subtotal Palm Beach International Airport $868,690,724 $16,013,725 $103,000,000 $32,746,565 $289,839,182 $58,236,608 $368,854,644 LANTANA Runway 33 Threshold Improvements $150,000 $0 $142,500 $3,750 $3,750 $0 $0 Construct Hangars at Lantana 1,875, ,875,000 Construct Hangars (Rows 500, 600 & 700) 5,000, ,000,000 Upgrade Airfield Signage 400, , ,000 0 Expand Itinerant Apron 6,200, ,240,000 4,960,000 0 Relocate Airport Rotating Beacon 100, , ,000 Taxiway C Rehab 1,100, , ,000 Apron Rehab 275, , ,000 Rehab Runway 15/33 1,500, , ,200,000 Rehab Runway 3/21 200, , ,000 Construct Apron 2,200, , ,700,000 0 Construct Hangars (Rows 1600, 1700, 1800 & 1900) 3,600, ,600,000 Construct Access Road to West SIde Development 250, ,000 50, Subtotal Lantana $22,850,000 $0 $142,500 $703,750 $1,923,750 $7,050,000 $13,030,000 Final Draft 11-3 SEPTEMBER 05, 2007
117 11.0 SENSITIVITY ANALYSIS 1 Table 1.10 (3 of 3) Capital Improvement Plan Summary of Funding Sources Funding Source Total Project AIP AIP Project Escalated Dollars Ent Disc FDOT PFC Airport Cash GARBs NORTH COUNTY AIRPORT Miscellaneous Pavement Rehab $250,000 $0 $237,500 $6,250 $6,250 $0 $0 Construct Hangars at North County 1,875, ,875,000 Construct Apron and Taxilanes 1,875, , ,000 1,000,000 0 Construct Service Road from Terminal to North T-Hangars 550, , ,000 0 Construct Additional Tie-Down/Transient Apron 4,200, ,000 3,360,000 0 Construct Hangars 5,000, ,000,000 Hangar Construction Environmental Mitigation 2,500, , ,000,000 Construct Parallel Runway 4,450, , , , ,338,750 Environmental Mitigation Runway ,000, ,000,000 1,000, Subtotal North County Airport $25,700,000 $0 $737,500 $5,006,250 $2,942,500 $4,800,000 $12,213,750 GLADES T-Hangar Taxilane Rehab $143,000 $0 $135,850 $3,575 $3,575 $0 $0 Construct T-Hangar Facilities 500, ,000 0 Runway 17/35 Crack Sealing 80, , Construct T-Hangars 1,250, ,250,000 Install PAPIs and REILs 360, , ,000 0 Expand Aircraft Parking Apron 1,500, , , , ,000 Property Acquisition 1,000, ,000,000 0 Subtotal Glades $4,833,000 $0 $635,850 $583,575 $321,575 $1,842,000 $1,450,000 TOTAL $922,073,724 $16,013,725 $104,515,850 $39,040,140 $295,027,007 $71,928,608 $395,548,394 Total Funding Sources By Cost Center: Airside $390,164,095 $14,159,975 $103,000,000 $25,246,565 $116,955,484 $40,318,967 $90,483,104 Terminal 74,854,506 1,853, ,500,000 43,279,506 7,075,000 20,146,250 Ground Transportation 238,290, ,500, ,192 9,842, ,093,352 Aviation 130,000, ,500, ,500, Lantana 22,850, , ,750 1,923,750 7,050,000 13,030,000 Glades 4,833, , , ,575 1,842,000 1,450,000 North County Airport 25,700, ,500 5,006,250 2,942,500 4,800,000 12,213,750 Air Cargo Building 33,131, ,131,938 Fire Rescue 2,250, ,250,000 1,000,000 0 TOTAL $922,073,724 $16,013,725 $104,515,850 $39,040,140 $295,027,007 $71,928,608 $395,548,394 Source: Palm Beach County Department of Airports; Ricondo & Associates, Inc. Prepared by: Ricondo & Associates, Inc. Final Draft 11-4 SEPTEMBER 05, 2007
118 11.0 SENSITIVITY ANALYSIS 1 Table 1.11 Cash Flow / Coverage Calculation / Cost Per Enplanement Budget Projected Fiscal Year Sensitivity Scenario 1: Signatory Landing Fee Rate $1.06 $0.88 $1.00 $1.00 $1.05 $1.12 $1.66 $1.67 $2.73 $2.49 $2.43 $2.50 Average Terminal Rental Rate $57.88 $49.17 $57.33 $58.39 $63.29 $69.95 $68.13 $70.54 $75.06 $55.91 $53.21 $63.52 Cost Per Enplanement $6.24 $5.02 $5.69 $5.60 $5.77 $6.30 $6.81 $6.81 $8.57 $7.00 $6.65 $7.14 Debt Service Coverage Airport Improvement and Development Fund Ending Balance $39,780,563 $43,698,396 $38,851,750 $21,688,540 $23,644,887 $27,409,430 $12,457,154 $10,966,743 $13,843,325 $16,270,419 $23,628,478 $29,154,868 Baseline Scenario: Signatory Landing Fee Rate $1.06 $0.88 $1.00 $1.00 $1.04 $1.10 $1.08 $1.10 $1.13 $0.94 $0.90 $0.94 Average Terminal Rental Rate $57.88 $49.17 $57.32 $58.16 $62.35 $68.60 $66.77 $69.72 $73.70 $56.28 $52.46 $56.50 Cost Per Enplanement $6.24 $5.02 $5.69 $5.59 $5.70 $6.20 $5.92 $5.98 $6.30 $4.92 $4.55 $4.71 Debt Service Coverage Airport Improvement and Development Fund Ending Balance $39,780,563 $44,101,396 $47,724,889 $50,421,682 $51,679,266 $56,875,796 $61,197,039 $66,160,252 $68,912,877 $71,213,167 $78,256,412 $85,086,148 Source: Palm Beach County Department of Airports; Ricondo & Associates, Inc. Prepared by: Ricondo & Associates, Inc. Final Draft 11-5 SEPTEMBER 05, 2007
119 12.0 Sensitivity Analysis 2 The baseline financial scenario was based on eligibility of projects for various types of funding. This section evaluates a modified funding scenario based on the following assumptions: FAA and State Funding are capped at Historical Levels experienced by the airport system. PFCs are collected at a $6.00 per enplaned passenger level starting in FY FAA entitlements are calculated based on the existing FAA formula incorporating the baseline forecast of enplanements and the PFC level. When the PFC level is assumed to increase to $6.00, entitlements will be eliminated. FAA discretionary funds for FY 2008 through FY 2016 are estimated to be $500,000 per year. Additional FAA discretionary funds for FY 2010 through FY 2014 are estimated to be $100 million for the five-year period, secured with an LOI and distributed over the five-year period ($20 million annually) FDOT funds are estimated to be $2.5 million per year for PBI; and $500,000 per year (total) for the 3 GA airports. FDOT (SIS) Funding is estimated to be $10,898,000 in FY Timing of projects is projected to be delayed when necessary to ensure adequate funding availability. Hangars at reliever / general aviation airports will be funded with bond proceeds and will only be undertaken if hangar revenues are sufficient to repay annual debt service. Based on analyses of forecast activity at the Airport, in addition to projected revenues and expenses, and the Airport System Capital Improvement Plan for FY 2007 through FY 2025 based on the above assumptions, it appears that the County has adequate financial resources and the Airport System has adequate growth capacity to meet future demand under this scenario. However, airline rates and charges would increase over the baseline scenario. Table 1.12 presents the funding sources assumed in Scenario 2. After incorporating the funding sources and other assumptions, Table 1.13 illustrates selected airline rates and charges, cost per enplanement, debt service coverage and ending balance in the Airport s capital account through FY 2017 that result from this scenario and compares the financial results to the baseline scenario. As presented, airline rates and charges are projected to be higher and the balance in the Airport s Improvement and Development Fund is projected to be lower in Scenario 2 compared to the Baseline Scenario. However, this scenario is projected to reflect lower rates and charges and a higher balance in the Improvement and Development Fund than Scenario 1 presented in the previous section. FINAL DRAFT 12-1 SEPTEMBER 05, 2007
120 12.0 SENSITIVITY ANALYSIS 2 Table 1.12 (1 of 2) Capital Improvement Plan Summary of Funding Sources Project Funding Source Total Project AIP AIP Escalated Dollars Ent Disc FDOT PFC Airport Cash GARBs PALM BEACH INTERNATIONAL AIRPORT Expand and Rehab Overnight Parking Apron $740,000 $0 $0 $370,000 $370,000 $0 $0 Apron "A" Expansion 3,420, ,220,000 2,200, NAVAID Relocation Study 300, , Construct Maintenance Compound 1,000, ,000, Rehabilitate Aircraft Parking Apron 1,090, ,090, Extension of Taxiway "F" to RW 13 13,400, ,888,000 10,512, Extend Runway 9R-27L Environmental & Design 8,284, ,284, Extension of Taxiway "L" (Lima) 17,700, ,500 16,841, Miscellaneous taxiway rehab 5,250, ,253,500 2,625,000 1,371,500 0 New Taxiway Connector - Runway 9L-27R 5,300,000 1,676, , ,500 2,461,250 0 Taxiway Romeo (West of R1) 20,825, ,733, ,070,833 1,395,833 12,625,398 Taxiway C4 High Speed Exit - Rwy 9L-27R 5,084, ,050,400 2,033,600 0 Taxiway D High Speed Exit - Rwy 9L-27R 4,721, ,832,600 1,888,400 0 Replace (2) Fire Rescue Vehicles 2,250, ,250, Concourse "A" Redevelopment 20,375, ,300,000 2,075,000 0 Acquire land runway 9L-27R 7,094, ,014, ,080, Taxiway Lima (West) Upgrades and Improvements 17,048, ,303,050 2,500,000 13,244, Runway 9R Property Acquisition 35,846, ,948,900 5,974,000 17,923, Golfview Apron, Taxilanes/Taxiways and Infrastructure 74,000, ,000, ,000, Golfview Facilities 130,000, ,500, ,500, Relocate VOR 3,939, ,414,000 2,525, Taxiway Charlie (East) Improvements 7,800, ,510,000 4,290, Extend, Relocate and Upgrade RWY 9R-27L 77,101, ,000, ,545,150 24,555,850 0 Construct Apron Golfview 2 6,000, ,000, Construct Surface Parking Lot 1,426, ,426,946 0 Demolition East of Runway ,600, ,600, Demolition West of Runway ,600, ,600, Runway Pavement Removal 2,500, ,500, Runway 13-31, Taxiway F and Taxiway B Extensions and Taxiway Connectors 23,000, ,500,000 20,500, Part 150 Study PBIA 800, , , Rehabilitate Taxiway C 8,500, ,445,500 6,054, New Parking Revenue Center 2,609, ,609,546 0 New Cargo Apron 5,461, , , ,915,177 Concourse "B" Expansion 29,500, ,500, ,000,000 22,000,000 Miscellaneous Taxiway Rehab 2,687, , ,187, New Belly Cargo/All Cargo Facility 33,131, ,131,938 Cargo Apron Expansion 3,070, , ,538 2,417,220 0 Construct Surface Parking Lot 4,270, ,500, , ,770 Terminal Building Baggage System Expansion 24,979, ,979, Construct Surface Parking Lot 5,806, ,806,149 0 New Parking Garage 224,176, ,176,582 Subtotal Palm Beach International Airport $868,690,724 $1,676,250 $103,500,000 $32,746,565 $379,960,749 $53,041,294 $297,765,865 Final Draft 12-2 SEPTEMBER 05, 2007
121 12.0 SENSITIVITY ANALYSIS 2 Table 1.12 (2 of 2) Capital Improvement Plan Summary of Funding Sources Funding Source Total Project AIP AIP Project Escalated Dollars Ent Disc FDOT PFC Airport Cash GARBs LANTANA Runway 33 Threshold Improvements $150,000 $0 $142,500 $3,750 $3,750 $0 $0 Construct Hangars at Lantana 1,875, ,875,000 Construct Hangars (Rows 500, 600 & 700) 5,000, ,000,000 Upgrade Airfield Signage 400, , ,000 0 Expand Itinerant Apron 6,200, ,240,000 4,960,000 0 Relocate Airport Rotating Beacon 100, ,000 95,000 0 Taxiway C Rehab 1,100, , ,000 0 Apron Rehab 275, , ,000 0 Rehab Runway 15/33 1,500, ,000 1,200,000 0 Rehab Runway 3/21 200, , ,000 0 Construct Apron 2,200, , ,700,000 0 Construct Hangars (Rows 1600, 1700, 1800 & 1900) 3,600, ,600,000 Construct Access Road to West SIde Development 250, ,000 50, Subtotal Lantana $22,850,000 $0 $142,500 $703,750 $1,923,750 $9,605,000 $10,475,000 NORTH COUNTY AIRPORT Miscellaneous Pavement Rehab $250,000 $0 $237,500 $6,250 $6,250 $0 $0 Construct Hangars at North County 1,875, ,875,000 Construct Apron and Taxilanes 1,875, , ,000 1,000,000 0 Construct Service Road from Terminal to North T-Hangars 550, , ,000 0 Construct Additional Tie-Down/Transient Apron 4,200, ,000 3,360,000 0 Construct Hangars 5,000, ,000,000 Hangar Construction Environmental Mitigation 2,500, , ,000,000 Construct Parallel Runway 4,450, , , ,838,750 Environmental Mitigation Runway ,000, ,000,000 1,000, Subtotal North County Airport $25,700,000 $0 $237,500 $5,006,250 $2,942,500 $4,800,000 $12,713,750 GLADES T-Hangar Taxilane Rehab $143,000 $0 $135,850 $3,575 $3,575 $0 $0 Construct T-Hangar Facilities 500, ,000 0 Runway 17/35 Crack Sealing 80, , Construct T-Hangars 1,250, ,250,000 Install PAPIs and REILs 360, , ,000 0 Expand Aircraft Parking Apron 1,500, , , ,000 Property Acquisition 1,000, ,000,000 0 Subtotal Glades $4,833,000 $0 $135,850 $583,575 $321,575 $1,842,000 $1,950,000 TOTAL $922,073,724 $1,676,250 $104,015,850 $39,040,140 $385,148,574 $69,288,294 $322,904,615 Total Funding Sources By Cost Center: Airside $390,164,095 $1,676,250 $103,500,000 $25,246,565 $206,077,051 $36,123,653 $17,540,575 Terminal 74,854, ,500,000 43,279,506 7,075,000 22,000,000 Ground Transportation 238,290, ,500, ,192 9,842, ,093,352 Aviation 130,000, ,500, ,500, Lantana 22,850, , ,750 1,923,750 9,605,000 10,475,000 Glades 4,833, , , ,575 1,842,000 1,950,000 North County Airport 25,700, ,500 5,006,250 2,942,500 4,800,000 12,713,750 Air Cargo Building 33,131, ,131,938 Fire Rescue 2,250, ,250, TOTAL $922,073,724 $1,676,250 $104,015,850 $39,040,140 $385,148,574 $69,288,294 $322,904,615 Source: Palm Beach County Department of Airports Prepared by: Ricondo & Associates, Inc. Final Draft 12-3 SEPTEMBER 05, 2007
122 12.0 SENSITIVITY ANALYSIS 2 Table 1.13 Financial Results for Sensitivity 2 and Baseline Scenario Budget Projected Fiscal Year Sensitivity Scenario 2: Signatory Landing Fee Rate $1.06 $0.88 $1.00 $1.00 $1.05 $1.11 $1.09 $1.12 $1.47 $1.27 $1.24 $1.27 Average Terminal Rental Rate $57.88 $49.17 $57.33 $58.39 $63.08 $69.62 $67.83 $70.82 $74.81 $57.93 $55.11 $66.41 Cost Per Enplanement $6.24 $5.02 $5.69 $5.60 $5.76 $6.28 $6.00 $6.06 $6.81 $5.45 $5.14 $5.66 Debt Service Coverage Airport Improvement and Development Fund Ending Balance $39,780,563 $43,698,396 $38,851,750 $29,885,874 $29,391,926 $34,251,051 $37,242,362 $40,835,370 $18,484,377 $20,042,742 $23,996,922 $28,497,294 Baseline Scenario: Signatory Landing Fee Rate $1.06 $0.88 $1.00 $1.00 $1.04 $1.10 $1.08 $1.10 $1.13 $0.94 $0.90 $0.94 Average Terminal Rental Rate $57.88 $49.17 $57.32 $58.16 $62.35 $68.60 $66.77 $69.72 $73.70 $56.28 $52.46 $56.50 Cost Per Enplanement $6.24 $5.02 $5.69 $5.59 $5.70 $6.20 $5.92 $5.98 $6.30 $4.92 $4.55 $4.71 Debt Service Coverage Airport Improvement and Development Fund Ending Balance $39,780,563 $44,101,396 $47,724,889 $50,421,682 $51,679,266 $56,875,796 $61,197,039 $66,160,252 $68,912,877 $71,213,167 $78,256,412 $85,086,148 Source: Ricondo & Associates, Inc. Prepared by: Ricondo & Associates, Inc. Final Draft 12-4 SEPTEMBER 05, 2007
123 Technical Report #6 Palm Beach County Park Airport Layout Plan Palm Beach County Park Airport Prepared for Palm Beach County Department of Airports OCTOBER 2006 In Association with Ricondo & Associates, Inc.
124 Contents Section Page 1 Airport Layout Plan Narrative Introduction Runway System Land Acquisition Runway Approach Aids and Lighting Taxiway System Landside Facilities Terminal Building Commercial Development Aircraft Storage Facilities Airside Development Airspace Attachments 1 Airport Layout Plan Appendix A FAA Airport Layout Plan Drawing Set Checklist 6-LNA_ALPNARRATIVE_OCTOBER2006 ii
125 SECTION 1 Airport Layout Plan Narrative 1.1 Introduction The proposed 20-year development plan for Palm Beach County Park (Lantana or LNA) Airport Layout Plan (ALP) is a graphic depiction of existing and ultimate airport facilities that will be required to enable the airport to accommodate the forecast demand. The drawing was prepared in accordance with Federal Aviation Administration (FAA) guidelines as defined in FAA Advisory Circular 150/5070-6A, Airport Master Plans, and Advisory Circular 150/ , Change 10, Airport Design. The ALP provides both airport and airfield facility data and design criteria to define relationships with applicable planning and design standards. The following paragraphs describe the major components of the future LNA development plan, as illustrated in the Airport Layout Plan. Additionally, the FAA ALP Drawing Set Checklist for the Southern Region Airports Division is provided in Appendix A. 1.2 Runway System The LNA runway system consists of three asphalt concrete runways: Runway 9/27, which is 3,490 feet long by 75 feet wide; Runway 15/33, which is 3,426 feet long by 100 feet wide (to be reduced to 75 feet wide); and Runway 3/21, which is 3,256 feet long by 75 feet wide. Runway 9/27 is currently a non-precision instrument runway with 20:1 approach slopes and will remain a non-precision runway for the 20-year planning period. The runway is currently served by parallel Taxiway A at a separation distance of 240 feet. Taxiway A was constructed, and the runway was reconstructed and shifted north, in 2003; therefore, the runway pavement is generally in very good condition with no plans for maintenance or rehabilitation in the near future. Runway 15/33 is currently a non-precision runway with 20:1 approach slopes, and will remain a non-precision runway for the 20-year planning period. The existing asphalt concrete pavement is in fair condition, with some minor maintenance needed in order to prevent major rehabilitation. The DOA has no major plans to reconstruct this runway in the near future. Runway 3/21 is currently a non-precision runway with 20:1 approach slopes, and will remain a non-precision runway for the 20-year planning period. Due to potential safety enhancements and reduction in County operating costs, long-term future plans may include closing this runway at some time during the 20-year planning period. The runway may eventually be converted to a taxiway providing access to future hangars northwest of the existing runway. 6-LNA_ALPNARRATIVE_OCTOBER
126 SECTION 1 - PALM BEACH COUNTY PARK AIRPORT (LNA) ALP NARRATIVE 1.3 Land Acquisition In association with runway approach protection zones, object clearing criteria, and land use compatibility issues, parcels at each end of Runway are recommended for acquisition as shown on the ALP. Once these parcels are acquired, the existing structures are recommended for demolition to clear them from the RPZs. Avigation easements will be obtained to control heights and land use within the Runway 3, Runway 33 and Runway 9 RPZs for parcels that will not be acquired in fee simple. 1.4 Runway Approach Aids and Lighting All runways at LNA are equipped with medium intensity runway edge lighting. Precision Approach Path Indicator (PAPI) systems are installed on all runways for vertical approach guidance. Runway End Identifier Lights (REIL) are planned to be installed on Runway 15/33 and Runway 9/27 in the future. Runway 15/33 may also be equipped with a nondirectional beacon within the 20-year planning period. 1.5 Taxiway System The parallel taxiway systems serving Runways 9/27 and 15/33 meet FAA standards for separation between runway centerline and taxiway centerline. The taxiways at LNA are generally equipped with Medium Intensity Taxiway Lights (MITL). The taxiway pavement system is generally in good condition, with the exception of Taxiway C, which will require major rehabilitation in the near future. No additional taxiway work is planned. 1.6 Landside Facilities Terminal Building The existing terminal building is centrally located with adequate landside and airside access. An additional FBO is shown to meet anticipated demand levels over the planning period Commercial Development The DOA currently owns two parcels along Congress Avenue near the southwest side of the airport, which are currently being marketed for commercial development. These parcels are approximately 14 acres and 19 acres, and will likely be developed for non-aviation related uses. 1.7 Aircraft Storage Facilities Many existing conventional aircraft hangars and t-hangars were severely damaged during the hurricane seasons. Many hangars have been torn down and are planned to be rebuilt in the 20 year planning period. Furthermore, new corporate hangars and t-hangars are proposed west of Runway Long-term facilities, assuming Runway 3/21 may 6-LNA_ALPNARRATIVE_OCTOBER
127 SECTION 1 - PALM BEACH COUNTY PARK AIRPORT (LNA) ALP NARRATIVE eventually be closed, are also shown toward the central portion of the airfield. Additional vehicle parking and access roads are also proposed to serve the future hangar facilities. Existing hangars on the south side of the airport currently violate FAA Object Free Area criteria for Runway and are recommended for demolition or relocation. 1.8 Airside Development Apron expansion and taxilane construction is recommended for airside development at LNA to accommodate anticipated future growth as shown on the ALP. Approximately 500,000 square feet of apron expansion and taxilane construction is depicted on the ALP to provide sufficient aircraft parking for anticipated growth over the 20-year planning period. 1.9 Airspace All runway approaches at LNA are 20:1 approaches and will remain as such for the forecast future. Approaches to Runway 9/27 are programmed to be upgraded from visual approaches to non-precision instrument approaches within the 20-year planning period. 6-LNA_ALPNARRATIVE_OCTOBER

128
129 Appendix A
 Location of Airport: Lantana, Florida Date of Review: Reviewed by: Significant Development Changes Since Previous ALP Approval/ or Narrative 1. Relocation of Runway 9-27.")
130 U.S. Department of Transportation Federal Aviation Administration Southern Region Airports Division Effective Date: May 2004 Airport Layout Plan Drawing Set Checklist Name of Airport: Palm Beach County Park Airport (Lantana) Location of Airport: Lantana, Florida Date of Review: Reviewed by: Significant Development Changes Since Previous ALP Approval/ or Narrative 1. Relocation of Runway Construction of Taxiway A. 3. Replacement of Automated Weather Observing System (AWOS) In order to protect the airspace for future conditions, complete the following information: Future Airport Reference Point (ARP) (if same as existing, provide existing ARP) ARP Latitude: 26 deg, 35', 34.56", ARP Longitude: 80 deg, 05', 06.45" Future Rwy End Coordinates & Rwy End Elevation (if same as existing, provide existing coordinates) Rwy End: 3, Rwy End Latitude: 26d, 35',24.42", Rwy End Longitude: 80d, 05',21.54", Rwy End Elevation: 14.0' Rwy End: 21, Rwy End Latitude: 26d, 35',51.78", Rwy End Longitude: 80d, 05', 02.55", Rwy End Elevation: 15.3' Rwy End: 9, Rwy End Latitude: 26d, 35',28.73", Rwy End Longitude: 80d, 05', 27.52", Rwy End Elevation: 13.4' Rwy End: 27, Rwy End Latitude: 26d, 35',27.55", Rwy End Longitude: 80d, 04', 04.11", Rwy End Elevation: 14.5' Rwy End: 15, Rwy End Latitude: 26d, 35',53.93", Rwy End Longitude: 80d, 05', 07.46", Rwy End Elevation: 15.1' Rwy End: 33, Rwy End Latitude: 26d, 35',27.55", Rwy End Longitude: 80d, 04', 49.73", Rwy End Elevation: 14.2' Existing and Proposed Modification of Standards (MOS) Existing Deviation of Standard/ FAA Approved MOS FAA Approval Date (if any) Expiration Date (if any) Proposed Deviation of Standard/ FAA Modification of Standards Runway Safety Area Re-Evaluations (X ) Concur with Runway Safety Area Determination currently on file with FAA. ( ) Reevaluation of Runway Safety Area Determination completed as part of planning document and shown on this ALP set.
CHAPTER 1 EXECUTIVE SUMMARY
 CHAPTER 1 EXECUTIVE SUMMARY 1 1 EXECUTIVE SUMMARY INTRODUCTION William R. Fairchild International Airport (CLM) is located approximately three miles west of the city of Port Angeles, Washington. The airport
1.1.3 Taxiways. Figure 1-15: Taxiway Data. DRAFT Inventory TYPICAL PAVEMENT CROSS-SECTION LIGHTING TYPE LENGTH (FEET) WIDTH (FEET) LIGHTING CONDITION
 WIDTH (FEET) LIGHTING CONDITION") 1.1.3 Taxiways EWN has an extensive network of taxiways and taxilanes connecting the terminal, air cargo, and general aviation areas with the runways as listed in Figure 1-15. A 50-foot wide parallel taxiway
1.1.3 Taxiways EWN has an extensive network of taxiways and taxilanes connecting the terminal, air cargo, and general aviation areas with the runways as listed in Figure 1-15. A 50-foot wide parallel taxiway
Addendum - Airport Development Alternatives (Chapter 6)
") Bowers Field Addendum - Airport Development Alternatives (Chapter 6) This addendum to the Airport Development Alternatives chapter includes the preferred airside development alternative and the preliminary
Bowers Field Addendum - Airport Development Alternatives (Chapter 6) This addendum to the Airport Development Alternatives chapter includes the preferred airside development alternative and the preliminary
Table of Contents. Overview Objectives Key Issues Process...1-3
 Table of Contents Chapter One Introduction Overview...1-1 Objectives...1-1 Key Issues...1-2 Process...1-3 Chapter Two Inventory of Existing Conditions Airport Setting...2-1 Locale...2-1 Airport Surroundings...2-5
Source: Chippewa Valley Regional Airport ASOS, Period of Record
 Chapter 1 Inventory Runway wind coverage is the percentage of time a runway can be used without exceeding allowable crosswind velocities. Allowable crosswind velocities vary depending on aircraft size
According to FAA Advisory Circular 150/5060-5, Airport Capacity and Delay, the elements that affect airfield capacity include:
 4.1 INTRODUCTION The previous chapters have described the existing facilities and provided planning guidelines as well as a forecast of demand for aviation activity at North Perry Airport. The demand/capacity
Document prepared by MnDOT Office of Aeronautics and HNTB Corporation. MINNESOTA GO STATE AVIATION SYSTEM PLAN
 LAST UPDATE JULY 2013 Acknowledgements The preparation of this document was financed in part by a grant from the Federal Aviation Administration (Project No: 3-27-0000-07-10), with the financial support
CHAPTER 3 ALTERNATIVES CONSIDERED
 CHAPTER 3 ALTERNATIVES CONSIDERED 3.0 ALTERNATIVES The 2010 Stevensville Airport Master Plan contained five (5) airside development options designed to meet projected demands. Each of the options from
Milton. PeterPrinceAirportislocatedinSantaRosaCounty, approximatelythreemileseastofmilton.
 Milton GeneralAviationAirport PeterPrinceAirportislocatedinSantaRosaCounty, approximatelythreemileseastofmilton. Existing Facilities Peter Prince Airport is served by one runway, Runway 18/36, 3,700 feet
CATCODE ] CATCODE
![CATCODE ] CATCODE](/thumbs/82/85644630.jpg "CATCODE ] CATCODE") Runways. FAC: 1111 CATCODE: 111111 OPR: AFCEC/COS OCR: AF/A3O-A 1.1. Description. The runway is the paved surface provided for normal aircraft landings and take offs. Runways are classified as either Class
Runways. FAC: 1111 CATCODE: 111111 OPR: AFCEC/COS OCR: AF/A3O-A 1.1. Description. The runway is the paved surface provided for normal aircraft landings and take offs. Runways are classified as either Class
Hartford-Brainard Airport Potential Runway Closure White Paper
 Hartford-Brainard Airport Potential Runway 11-29 Closure White Paper June 2012 In recent years there has been discussion regarding the necessity of Runway 11-29 to the Hartford- Brainard Airport (HFD)
Merritt Island Airport
 TABLE OF CONTENTS CHAPTER 1 INTRODUCTION... 1-1 INTRODUCTION AND PROJECT OVERVIEW... 1-1 General Guidelines... 1-1 Prior Planning Documentation... 1-2 Key Issues... 1-2 Goals and Objectives... 1-2 Regulatory
TECHNICAL REPORT #7 Palm Beach International Airport Airport Layout Plan
 TECHNICAL REPORT #7 Palm Beach International Airport Airport Layout Plan Technical Report #7 Palm Beach International Airport Layout Plan Palm Beach International Airport Prepared for Palm Beach County
Yolo County Airport. ALP Narrative Report. April Prepared by Mead & Hunt, Inc. for the County of Yolo, California
 Yolo County Airport ALP Narrative Report April 2016 Prepared by Mead & Hunt, Inc. for the County of Yolo, California Yolo County Airport ALP Narrative Report Prepared for the County of Yolo Mindi Nunes,
Grants Pass Airport Master Plan & Airport Layout Plan Update
 Attendees: Grants Pass Airport Master Plan & Airport Layout Plan Update Meeting #3 January 26, 2010 Merlin Community Center 100 Acorn Street, Merlin 5:45 7:15 p.m. Josephine County Department of Airports:
STUDY WORK GROUP MEETING No. 3. November 29, 2016
 STUDY WORK GROUP MEETING No. 3 November 29, 2016 Agenda Welcome and introductions Update project schedule Brief overview of previous SWG meeting Update on aviation forecasts Introduction to airfield demand/capacity
Tallahassee International Airport Master Plan. Technical Advisory Committee Meeting #2 October 19, 2016
 Tallahassee International Airport Master Plan Technical Advisory Committee Meeting #2 October 19, 2016 Agenda Welcome / Introductions Master Plan Process and Project Status Forecast of Aviation Demand
The purpose of this Demand/Capacity. The airfield configuration for SPG. Methods for determining airport AIRPORT DEMAND CAPACITY. Runway Configuration
 Chapter 4 Page 65 AIRPORT DEMAND CAPACITY The purpose of this Demand/Capacity Analysis is to examine the capability of the Albert Whitted Airport (SPG) to meet the needs of its users. In doing so, this
Airport Master Plan for. Brown Field Municipal Airport PAC Meeting #3
 Airport Master Plan for Brown Field Municipal Airport PAC Meeting #3 Public Meeting #1 > 8/24/17 from 5:30 to 8:00 pm > 41 attendees signed-in > Comments: > EAA area > Environmental constraints > Focus
DRAFT MASTER PLAN UPDATE
 DRAFT MASTER PLAN UPDATE CHAPTER VI: AIRPORT LAYOUT PLAN NARRATIVE DRAFT REPORT APRIL 2017 PREPARED BY: Table of Contents WESTCHESTER COUNTY AIRPORT 6 AIRPORT LAYOUT PLAN NARRATIVE REPORT... 6-1 6.1 AGIS
Chapter 4 AIRPORT DEVELOPMENT ALTERNATIVES
 Chapter 4 AIRPORT DEVELOPMENT ALTERNATIVES Chapter Four Airport Development Alternatives Prior to formulating a development program for Ryan Airfield, it is important to consider development potential
CHAPTER 1 BACKGROUND AND PROPOSED ACTION
 CHAPTER 1 BACKGROUND AND PROPOSED ACTION 1.0 INTRODUCTION An Environmental Assessment (EA) evaluates the effects of a proposed Federal action on the surrounding environment and is prepared in compliance
Executive Summary. MASTER PLAN UPDATE Fort Collins-Loveland Municipal Airport
 Executive Summary MASTER PLAN UPDATE Fort Collins-Loveland Municipal Airport As a general aviation and commercial service airport, Fort Collins- Loveland Municipal Airport serves as an important niche
Airport Master Plan for Montgomery-Gibbs Executive Airport PAC Meeting #3
 Airport Master Plan for Montgomery-Gibbs Executive Airport PAC Meeting #3 Agenda > Introductions > Public Meetings Overview > Working Paper 3 - Facility Requirements > Working Paper 4 - Environmental Baseline
Punta Gorda Airport Master Plan Update
 Punta Gorda Airport Master Plan Update Draft Executive Summary Prepared for: The Charlotte County Airport Authority January 2018 Charlotte County Airport Authority James Herston, Chair Robert D. Hancik,
Appendix C AIRPORT LAYOUT PLANS
 Appendix C AIRPORT LAYOUT PLANS Appendix C AIRPORT LAYOUT PLANS Airport Master Plan Santa Barbara Airport As part of this Airport Master Plan, the Federal Aviation Administration (FAA) requires the development
AIRSIDE CAPACITY AND FACILITY REQUIREMENTS
 AIRSIDE CAPACITY AND FACILITY REQUIREMENTS This Section investigates the capacity of the airport, its ability to meet current demand, and the facilities required to meet forecasted needs as established
Chapter Three AIRPORT FACILITY REQUIREMENTS/ALTERNATIVES
 Chapter Three AIRPORT FACILITY REQUIREMENTS/ALTERNATIVES Airport Layout Plan Report In this chapter, existing components of the Airport are evaluated so that the capacities of the overall system are identified.
Chapter 9 - AIRPORT SYSTEM DESIGN
 Chapter 9 - AIRPORT SYSTEM DESIGN 9.01 GENERAL This chapter discusses the development program for Dutchess County Airport to the year 2020. This airport system design is based upon the airport's existing
FACILITY REQUIREMENTS SUMMARY OF KEY ISSUES OVERVIEW
 FACILITY REQUIREMENTS SUMMARY OF KEY ISSUES OVERVIEW This summary is intended to provide a brief overview of the key issues associated with conformance to FAA standards at Methow Valley State Airport.
CHAPTER 1: INTRODUCTION
 CHAPTER 1: INTRODUCTION Purpose and Scope The information presented in this report represents the study findings for the 2016 Ronan Airport Master Plan prepared for the City of Ronan and Lake County, the
1.0 Project Background Mission Statement and Goals Objectives of this Sustainable Master Plan
 TABLE OF CONTENTS CHAPTER 1 INTRODUCTION 10 Project Background 1-1 11 Mission Statement and Goals 1-1 12 Objectives of this Sustainable Master Plan 1-2 CHAPTER 2 INVENTORY 20 Airport Background 2-1 201
Airfield Design OVERVIEW BASIC DESIGN FACTORS. Airport Role
 3 Airfield Design OVERVIEW Due to the presence of significant physical constraints, little change to the existing airfield is anticipated. The emphasis in this plan is on identifying airfield improvements
Westover Metropolitan Airport Master Plan Update
 Westover Metropolitan Airport Master Plan Update June 2008 INTRODUCTION Westover Metropolitan Airport (CEF) comprises the civilian portion of a joint-use facility located in Chicopee, Massachusetts. The
Lake Tahoe Airport Master Plan Public Meeting March 16, 2015
 Lake Tahoe Airport Master Plan Public Meeting March 16, 2015 What is an Airport Master Plan? a comprehensive study of an airport [that] usually describes the short, medium, and long term development plans
Preliminary Findings of Proposed Alternative
 Preliminary Findings of Proposed Alternative The attached drawing provides a schematic layout of the proposed alternative that will be discussed on July 27, 2010. A full report will follow and should be
Chapter 5. Facility Requirements
 Chapter 5 Facility Requirements Chapter 5 Facility Requirements INTRODUCTION The Baseline Forecast was used to determine facility requirements. Chapter 4 produced a forecast of traffic volumes expected
Appendix D Project Newsletters. Tacoma Narrows Airport. Master Plan Update
 Appendix D Project Newsletters Tacoma Narrows Airport Master Plan Update This appendix contains the newsletters distributed throughout the project. These newsletters provided updates and information on
CHAPTER FOUR AIRPORT ALTERNATIVES
 4.0 INTRODUCTION CHAPTER FOUR The goal of the master planning process is to provide the City of New Smyrna Beach with an assessment of the adequacy and capabilities of the Airport as well as to identify
Lopez Island Airport Master Plan Update. Public Meeting June 15, 2017
 Lopez Island Airport Master Plan Update Public Meeting June 15, 2017 Master Plan Update Team Reid Middleton/Everett, WA Shannon Kinsella, Project Manager Melania Haagsma, Project Engineer Mead & Hunt/Tulsa,
Chapter 4 Airport Facility Requirements
 Chapter 4 Airport Facility Requirements Introduction CHAPTER 4 AIRPORT FACILITY REQUIREMENTS MAY 2013-1 Organization of Materials CHAPTER 4 AIRPORT FACILITY REQUIREMENTS MAY 2013-2 RPZ - ROAD RPZ - NON-AIRPORT
CHAPTER 3 AIRPORT FACILITY REQUIREMENTS
 CHAPTER 3 AIRPORT FACILITY REQUIREMENTS 3.1 Introduction The existing runway and taxiway system at Skyhaven Airport provides more than adequate operational capacity to accommodate future peak hour and
SECTION 5 ALTERNATIVE DEVELOPMENT CONCEPT ANALYSES
 SECTION 5 ALTERNATIVE DEVELOPMENT CONCEPT ANALYSES 5.1 INTRODUCTION This section investigates Airfield Development Alternatives, generalized Land Use Alternatives, and more detailed General Aviation Alternatives.
Chapter Six ALP Drawings. Tacoma Narrows Airport. Master Plan Update
 Chapter Six ALP Drawings Master Plan Update The master planning process for the (Airport) has evolved through efforts in the previous chapters to analyze future aviation demand, establish airside and landside
Chapter 2 FINDINGS & CONCLUSIONS
 Chapter 2 FINDINGS & CONCLUSIONS 2.01 GENERAL Dutchess County acquired the airport facility in 1947 by deed from the War Assets Administration. Following the acquisition, several individuals who pursued
6.1 INTRODUCTION 6.2 AIRSIDE ALTERNATIVES NORTH PERRY AIRPORT MASTER PLAN UPDATE RUNWAY LENGTH REQUIREMENTS SECTION 6: ALTERNATIVES ANALYSIS
 6.1 INTRODUCTION In the previous chapter, facility needs for the 20-year planning horizon were identified. The next step in the planning process is to identify and evaluate the various ways certain facilities
CHAPTER 5 - FACILITY REQUIREMENTS
 CHAPTER 5 - FACILITY REQUIREMENTS This chapter identifies the requirements for airfield and landside facilities to accommodate the forecast demand level. Facility requirements have been developed for the
MASTER PLAN CONCEPT 1 DRAFT
 The Airport Master Plan Update for Dallas Executive Airport has included the development of aviation demand forecasts, an assessment of future facility needs, and the evaluation of airport development
DRAFT FINAL REPORT AIRPORT MASTER PLAN. Rifle Garfield County Airport Revised May 15, 2014
 DRAFT FINAL REPORT AIRPORT MASTER PLAN Rifle Garfield County Airport Revised May 15, 2014 As required by Paragraph 425.B(4) of FAA Order 5100.38C, Airport Improvement Program (AIP) Handbook: The preparation
Technical Advisory Committee Meeting February 29, 2016
 Technical Advisory Committee Meeting February 29, 2016 Meeting Agenda Introduction Recap of Planning Process Project Status Goals and Objectives Forecasts of Aviation Demand Overview of Facility Requirements
Acronyms. Airport Layout Plan Report Appendix A A-1
 Appendix A Acronyms AC... Advisory Circular ADG... Airplane Design Group ADO... Airport District Office AGL... Above Ground Level AIM... Aeronautical Information Manual AIP... Airport Improvement Program
OVERVIEW BASIC DESIGN FACTORS. Demand Determinants
 3 Airfield Airfield Design Design OVERVIEW The basic configuration of the runway and taxiway system at Hanford Municipal Airport has changed moderately since the airport was constructed in 1950. These
1 DRAFT. General Aviation Terminal Services Aircraft Hangars Aircraft Parking Aprons Airport Support Facilities
 To properly plan for improvements at Dallas Executive Airport, it is necessary to translate forecast aviation demand into the specific types and quantities of facilities that can adequately serve the demand.
15 Precision Approach Path Indicator 33 None RSA 150 feet wide by 300 feet long 150 feet wide by 300 feet long
 The first (AMP) was completed in 1984 and updated in 2000. The current FAA approved Airport Layout Plan (ALP) is dated November 9, 2001. The FAA suggests updating the AMP every five year in accordance
TECHNICAL REPORT #3 Palm Beach International Airport Demand/Capacity and Facility Requirements
 TECHNICAL REPORT #3 Palm Beach International Airport Demand/Capacity and Facility Requirements Technical Report #3 Palm Beach International Airport Demand/Capacity and Facility Requirements Palm Beach
ArcadiaMunicipalAirportislocatedonthesoutheast sideofarcadia,southofstateroute70,westofstate Route31,andisaccessiblefrom AirportRoad.
 Arcadia GeneralAviationAirport ArcadiaMunicipalAirportislocatedonthesoutheast sideofarcadia,southofstateroute70,westofstate Route31,andisaccessiblefrom AirportRoad.Arcadia islocatedapproximately30milesnortheastoftheport
General Aviation Master Plan Update
 Peter O. Knight Airport Public Meeting #2 Peter O. Knight Airport Agenda Welcome and Introductions HCAA System of Airports Purpose of Public Meetings Master Plan Status Update Next Steps Q & A 2 Our System
Safety, Infrastructure, and Tenant Improvement Project. Public Hearing Informational Brochure February 26, 2013
 New York State Department of Transportation Safety, Infrastructure, and Tenant Improvement Project Public Hearing Informational Brochure February 26, 2013 This DEIS/Draft EA evaluates the potential impacts
chapter 5 Recommended Master Plan Concept airport master plan MASTER PLAN CONCEPT
 chapter 5 Recommended Master Plan Concept airport master plan The planning process for Coolidge Municipal Airport has included several analytical efforts in the previous chapters intended to project potential
Prepared By: Mead & Hunt, Inc Port Lansing Road Lansing, MI 48906
 Master Plan The preparation of this document was financed in part through a planning grant from the Federal Aviation Administration (FAA) as provided under Section 505 of the Airport and Airway Improvement
STAFF REPORT. Airport Land Use Plan Consistency Review: Santa Barbara Airport Master Plan. MEETING DATE: November 19, 2015 AGENDA ITEM: 7D
 STAFF REPORT SUBJECT: Airport Land Use Plan Consistency Review: Santa Barbara Airport Master Plan MEETING DATE: AGENDA ITEM: 7D STAFF CONTACT: Peter Imhof, Andrew Orfila RECOMMENDATION: Adopt findings
Runway Length Analysis Prescott Municipal Airport
 APPENDIX 2 Runway Length Analysis Prescott Municipal Airport May 11, 2009 Version 2 (draft) Table of Contents Introduction... 1-1 Section 1 Purpose & Need... 1-2 Section 2 Design Standards...1-3 Section
FORT LAUDERDALE-HOLLYWOOD INTERNATIONAL AIRPORT ENVIRONMENTAL IMPACT STATEMENT DRAFT
 D.3 RUNWAY LENGTH ANALYSIS Appendix D Purpose and Need THIS PAGE INTENTIONALLY LEFT BLANK Appendix D Purpose and Need APPENDIX D.3 AIRFIELD GEOMETRIC REQUIREMENTS This information provided in this appendix
CHAPTER 3 FACILITY REQUIREMENTS
 CHAPTER 3 FACILITY REQUIREMENTS 3.1 INTRODUCTION To properly plan for the future requirements of Newport News/Williamsburg International Airport, it is necessary to translate the forecasts of aviation
CHAPTER 4 DEMAND/CAPACITY ANALYSIS
 CHAPTER DEMAND/CAPACITY ANALYSIS INTRODUCTION The demand/capacity analysis examines the capability of the airfield system at Blue Grass Airport (LEX) to address existing levels of activity as well as determine
TABLE OF CONTENTS. General Study Objectives Public Involvement Issues to Be Resolved
 TABLE OF CONTENTS Description Page Number LIST OF ACRONYMS... a CHAPTER ONE INTRODUCTION General... 1-1 Study Objectives... 1-1 Public Involvement... 1-2 Issues to Be Resolved... 1-2 CHAPTER TWO EXISTING
Vista Field Airport. Master Plan Update. February, Prepared for: Port of Kennewick One Clover Island Kennewick, Washington
 Vista Field Airport February, 2006 Prepared for: Port of Kennewick One Clover Island Kennewick, Washington 99336 Prepared by: J-U-B ENGINEERS, Inc. 2810 W. Clearwater Avenue, Suite 201 Kennewick, Washington
Draft Concept Alternatives Analysis for the Inaugural Airport Program September 2005
 Draft Concept Alternatives Analysis for the Inaugural Airport Program September 2005 Section 1 - Introduction This report describes the development and analysis of concept alternatives that would accommodate
Agenda: SASP SAC Meeting 3
 Agenda: SASP SAC Meeting 3 Date: 04/12/18 Public Involvement Plan Update Defining the System Recommended Classifications Discussion Break Review current system Outreach what we heard Proposed changes Classification
Draft Concept Alternatives Analysis for the Inaugural Airport Program September 2005
 Draft Concept Alternatives Analysis for the Inaugural Airport Program September 2005 Section 3 - Refinement of the Ultimate Airfield Concept Using the Base Concept identified in Section 2, IDOT re-examined
CHAPTER 5: Landside Facility Requirements and Development Concepts
 CHAPTER 5: Landside Facility Requirements and Development Concepts Overview Implementation of the preferred intermediate-term (10-year) and long-term (20-year) airside alternatives will have a significant
Appendix 6.1: Hazard Worksheet
 Appendix 6.1: Appendix 6.1: Ref. Condition, real or potential; that can cause injury, illness, etc. This is a prerequisite for an Airfield Hazards 1. Taxiway Geometry Direct access to runway from ramp
1 PURPOSE AND NEED 1.1 INTRODUCTION
 1.1 INTRODUCTION 1 PURPOSE AND NEED This Environmental Assessment (EA) addresses projects at Juneau International Airport (JIA) that are the direct outcome of a Master Plan prepared for the airport and
STUDY OVERVIEW MASTER PLAN GOALS AND OBJECTIVES
 INTRODUCTION An Airport Master Plan provides an evalua on of the airport s avia on demand and an overview of the systema c airport development that will best meet those demands. The Master Plan establishes
Airport Master Plan. Rapid City Regional Airport. October 2015 FAA Submittal
 Airport Master Plan Rapid City Regional Airport October 2015 FAA Submittal Rapid City Regional Airport Master Plan Update Table of Contents Executive Summary... i Scope & Timeline... i Forecasts... i Preferred
CHAPTER 1 INTRODUCTION AND BACKGROUND
 CHAPTER 1 INTRODUCTION AND BACKGROUND An Environmental Assessment (EA) evaluates the effects of a proposed Federal action on the surrounding environment and is prepared in compliance with the National
3 INTRODUCTION. Chapter Three Facility Requirements. Facility Requirements PEAKING CHARACTERISTICS
 Chapter Three Facility Requirements 3 INTRODUCTION This chapter identifies the long-range airfield and terminal area facilities needed to satisfy the 20-year forecast of aviation demand at Monett Municipal
8.0 AIRPORT LAYOUT PLANS
 8.0 AIRPORT LAYOUT PLANS This chapter presents a detailed graphic and narrative description of the selected development concept for General Mitchell International Airport (MKE). The plans package presented
AERONAUTICAL SURVEYS & INSTRUMENT FLIGHT PROCEDURES
 AERONAUTICAL SURVEYS & INSTRUMENT FLIGHT PROCEDURES Current as of November 2012 ALASKA AVIATION SYSTEM PLAN UPDATE Prepared for: State of Alaska Department of Transportation & Public Facilities Division
Draft Concept Alternatives Analysis for the Inaugural Airport Program September 2005
 Section 10 Preferred Inaugural Airport Concept 10.0 Introduction The Preferred Inaugural Airport Concept for SSA was developed by adding the preferred support/ancillary facilities selected in Section 9
Table of Contents. List of Tables. Cincinnati/Northern Kentucky International Airport 2035 Master Plan Update
 Table of Contents 7.1. Airport Layout Plan (Existing Conditions)... 2 7.2. Airport Layout Plan (Future Conditions)... 3 7.3. Technical Data Sheet... 5 7.4. Commercial Terminal Area Drawing... 5 7.5. East
50 Ways to Improve Your Airport: Engaging Airport Management on Key Issues
 50 Ways to Improve Your Airport: Engaging Airport Management on Key Issues Tuesday, November 17, 2015 1:00 p.m. 2:00 p.m. PRESENTED BY: Charles D. Lamb, P.E. Airfield Lighting Image Source: Delta Airport
COMMERCIAL AND GENERAL AVIATION
 Existing Facilities Daytona Beach International Airport is served by a number of airside and landside facilities. The airport has three asphalt runways: Runway 07L/25R (10,500 feet long by 150 feet wide),
JOSLIN FIELD, MAGIC VALLEY REGIONAL AIRPORT DECEMBER 2012
 1. Introduction The Federal Aviation Administration (FAA) recommends that airport master plans be updated every 5 years or as necessary to keep them current. The Master Plan for Joslin Field, Magic Valley
Lake Tahoe Airport Master Plan
 Lake Tahoe Airport Master Plan City Council Briefing October 20, 2015 What is an Airport Master Plan? a comprehensive study of an airport [that] usually describes the short, medium, and long term development
Current Airport Roles
 Chapter Four: Current Airport Roles Introduction Current airport roles are defined differently from national, state, and local perspectives. The Federal Aviation Administration (FAA) has established two
Airfield Design. Public Review Draft OVERVIEW BASIC DESIGN FACTORS. Airport Role
 Public Review Draft 3 Airfield Design OVERVIEW The Facilities Plan, Figure 3D, presents the recommended airfield improvements. The principal airfield design issues examined in this chapter are the optimal
New Opportunities PUBLIC WORKSHOP. Venice Municipal. Bringing g the pieces together
 Bringing g the PUBLIC WORKSHOP Venice Municipal Airport New Opportunities Presented for Venice City Council & Citizens of Venice September 25, 2009 Slide 1 Bringing g the Welcome & Introductions May 12th
Chapter The All-new, World-class Denver International Airport Identify Describe Know Describe Describe
 Chapter 10 The aerospace subject is very large and diverse. As seen in previous chapters, there are many subject areas. So far you have learned about history, weather, space and aerodynamics. Now you will
R FAA
 Chapter Four Section 01 - Introduction Section 02 - Criteria for Determination of Facility Requirement Recommendations Section 03 - FAA Design Standards & Non-Standard Conditions Section 04 - Airfield
Washington Dulles International Airport (IAD) Aircraft Noise Contour Map Update
 Aircraft Noise Contour Map Update") Washington Dulles International Airport (IAD) Aircraft Noise Contour Map Update Ultimate ASV, Runway Use and Flight Tracks 4th Working Group Briefing 8/13/18 Meeting Purpose Discuss Public Workshop input
Washington Dulles International Airport (IAD) Aircraft Noise Contour Map Update Ultimate ASV, Runway Use and Flight Tracks 4th Working Group Briefing 8/13/18 Meeting Purpose Discuss Public Workshop input
3.1 CRITICAL AIRCRAFT
 The purpose of the demand capacity analysis is to determine an airport s capacity and its ability to support the forecasted aviation demand. Facility requirements identify development, replacement, and/or
Basic Design Factors. Airfield Design. Airport Role
 Chapter 3 Airfield Design Basic Design Factors The Federal Aviation Administration (FAA) provides guidance and standards for airport design through a series of Advisory Circulars (ACs). These guidelines
Airport Master Plan. Brookings Regional Airport. Runway Runway 17-35
 Runway 17-35 Airport Master Plan Runway 12-30 Brookings Regional Airport Table of Contents Table of Contents Chapter 1: Master Plan Goals... 1-1 1.1. Introduction... 1 1.2. Objective 1 Identify improvements
Chapter 4.0 Facility Requirements
 Chapter 4.0 Facility Requirements Having inventoried the existing infrastructure and forecasted demand, determining airport facility requirements is the next essential step in the airport master planning
1. Background and Proposed Action
 1. Background and Proposed Action This chapter describes Hillsboro Airport and the planning background for the proposed project. The Port of Portland (the Port) is the sponsor for the Hillsboro Airport
Technical Memorandum. Synopsis. Steve Carrillo, PE. Bryan Oscarson/Carmen Au Lindgren, PE. April 3, 2018 (Revised)
") Appendix D Orange County/John Wayne Airport (JWA) General Aviation Improvement Program (GAIP) Based Aircraft Parking Capacity Analysis and General Aviation Constrained Forecasts Technical Memorandum To:
Appendix D Orange County/John Wayne Airport (JWA) General Aviation Improvement Program (GAIP) Based Aircraft Parking Capacity Analysis and General Aviation Constrained Forecasts Technical Memorandum To:
Bremerton National Airport Airport Master Plan Project Update February 12, 2013
 Bremerton National Airport Airport Master Plan Project Update February 12, 2013 Project Team Century West Engineering Northwest firm founded in 1969 500+ airport projects completed throughout the Pacific
CHICO MUNICIPAL AIRPORT NON-MOVEMENT AREA DRIVER TRAINING PROGRAM
 CHICO MUNICIPAL AIRPORT NON-MOVEMENT AREA DRIVER TRAINING PROGRAM Introduction In an effort to provide the safest and most efficient operating environment for tenants and users of the Chico Municipal Airport
Reliever Airports: NOISE ABATEMENT PLAN Flying Cloud Airport (FCM)
") Reliever Airports: NOISE ABATEMENT PLAN Flying Cloud Airport (FCM) INTRODUCTION The Noise Abatement Plan (FCM Plan) for the Flying Cloud Airport has been prepared in recognition of the need to make the
Reliever Airports: NOISE ABATEMENT PLAN Flying Cloud Airport (FCM) INTRODUCTION The Noise Abatement Plan (FCM Plan) for the Flying Cloud Airport has been prepared in recognition of the need to make the