Airline Quality Rating 2011
|
|
|
- Jasmine Cox
- 6 years ago
- Views:
Transcription
1 Purdue University Purdue e-pubs Airline Quality Rating Report Advanced Aviation Analytics Institute for Research Center of Research Excellence (A3IR-CORE) Airline Quality Rating 2011 Brent D. Bowen Purdue University, Dean E. Headley Wichita State University, Follow this and additional works at: Bowen, Brent D. and Headley, Dean E., "Airline Quality Rating 2011" (2011). Airline Quality Rating Report. Paper 2. This document has been made available through Purdue e-pubs, a service of the Purdue University Libraries. Please contact epubs@purdue.edu for additional information.

2 Airline Quality Rating 2011 Dr. Brent D. Bowen College of Technology Department of Aviation Technology Purdue University Dr. Dean E. Headley W. Frank Barton School of Business Department of Marketing Wichita State University Our 21 st year of reporting airline performance
3 Airline Quality Rating 2011 Dr. Brent D. Bowen Purdue University College of Technology Department of Aviation Technology Dr. Dean E. Headley Wichita State University W. Frank Barton School of Business Department of Marketing April, 2011
4 ABOUT THE AUTHORS Dr. Brent Bowen is Professor and Head, Department of Aviation Technology within the Purdue University College of Technology. Previously, Dr. Bowen served as Professor and Chair, Aviation Science, Parks College of Engineering, Aviation and Technology, and directed the office of Air Transportation Policy and served as Senior Fellow for the National Center for Aviation Safety Research at Saint Louis University. Bowen attained his Doctorate in Aviation Sciences from Oklahoma State University and a Master of Business Administration degree from Oklahoma City University. His Federal Aviation Administration certifications include Airline Transport Pilot (Type-rated Douglas DC-3 SIC), Certified Flight Instructor (SEL, MEL, Instrument) with Gold Seal, Advanced- Instrument Ground Instructor, Aviation Safety Counselor, and Aerospace Education Counselor. Dr. Bowen has authored/co-authored numerous successful grand proposals totaling awards exceeding $25 million and has in excess of 300 publications, papers and professional program appearances to his credit. His research interests focus on aviation applications of public productivity enhancement and marketing channels, specifically in the areas of service quality evaluation, benchmarking, safety and security. Dr. Bowen is an active industry consultant, pilot, and former fixed-base operator and scheduled air carrier operator. Dr. Bowen served on the National Research Council Steering Group on the Small Aircraft Transportation System and was named by the FAA Administrator to a National Academy of Science study group on airspace optimization as a component of the Next Generation Air Transportation System. Additionally, Dr. Bowen was appointed by FAA Administrator to serve on a National Academy of Science panel to examine the need to cultivate a future generation of transportation leaders. Dr. Dean E. Headley is Associate Professor of Marketing in the Department of Marketing at the W. Frank Barton School of Business, Wichita State University. He holds a Doctorate in Marketing and Statistics from Oklahoma State University, a Master of Business Administration degree from Wichita State University, and a Master of Public Health Degree from the University of Oklahoma. Dr. Headley s research interests include methodology development for measurement of service quality, the connection between service quality and consumer behavior, consumer choice processes in service settings, and the effects of marketing activities on consumers and providers of services. Dr. Bowen s and Dr. Headley s research on the development of the national Airline Quality Rating (AQR) is viewed by more than 75 million people each year and is annually featured by national news outlets such as ABC s Good Morning America, The Cable News Network, The Today Show, C-Span, USA Today, The Associated Press, The Wall Street Journal, Aviation Week and Space Technology, the network evening news shows, and in numerous other national and international media. Bowen and/or Headley have served as invited expert witnesses before the U.S. House of Representatives Committee on Government Operations and have served as invited speakers and panelists for such groups as the National Academy of Sciences/Transportation Research Board, Department of Transportation and other Congressional and Executive panels. Their body of research has been recognized with awards from the American Marketing Association, the American Institute of Aeronautics and Astronautics, Embry- Riddle Aeronautical University, the Travel and Transportation Research Association and others.
5 AIRLINE QUALITY RATING 2011 Brent D. Bowen, Purdue University Dean E. Headley, Wichita State University Abstract The Airline Quality Rating (AQR) was developed and first announced in early 1991 as an objective method for assessing airline quality on combined multiple performance criteria. This current report, the Airline Quality Rating 2011, reflects monthly Airline Quality Rating scores for calendar year AQR scores for 2010 are based on 15 elements in four major areas that focus on airline performance aspects important to air travel consumers. The Airline Quality Rating 2011 is a summary of month-by-month quality ratings for U.S. airlines that are required to report performance by virtue of having at least 1% of domestic scheduled-service passenger revenue during Using the Airline Quality Rating system of weighted averages and monthly performance data in the areas of ontime arrivals, involuntary denied boardings, mishandled baggage, and a combination of 12 customer complaint categories, airlines comparative performance for the calendar year of 2010 is reported. This research monograph contains a brief summary of the AQR methodology, detailed data and charts that track comparative quality for domestic airline operations for the 12-month period of 2010, and industry results. Also, comparative Airline Quality Rating data for 2009 are included, where available, to provide historical perspective regarding performance quality in the industry. The Airline Quality Rating (AQR) System The majority of quality ratings available in the past have relied on subjective surveys of consumer opinion that were infrequently collected. This subjective approach yields a quality rating that is essentially non-comparable from survey to survey for any specific airline. Timeliness of survey-based results can be a problem in the fast-paced airline industry as well. Before the Airline Quality Rating, there was effectively no consistent method for monitoring the quality of airlines on a timely, objective, and comparable basis. With the introduction of the AQR, a multi-factor, weighted average approach became available that had not been used before in the airline industry. The method relies on utilizing published, publicly available data that reports actual airline performance on critical quality criteria important to consumers and combines them into a rating system. The final result is a rating for individual airlines with interval scale properties that is comparable across airlines and across time periods. The Airline Quality Rating (AQR) is a weighted average of multiple elements (see Table 1) important to consumers when judging the quality of airline services. Elements considered for inclusion in the rating scale were screened to meet two basic criteria; 1) an element must be obtainable from published data sources for each airline; and 2) an element must have relevance to consumer concerns regarding airline quality. Data for the elements used in calculating the ratings represent performance aspects (on-time arrival, mishandled baggage, involuntary denied boardings, and 12 customer complaint
6 areas) of airlines that are important to consumers. All of the elements are reported in the Air Travel Consumer Report maintained by the U.S. Department of Transportation. Weights were originally established by surveying 65 airline industry experts regarding their opinion as to what consumers would rate as important (on a scale of 0 to 10) in judging airline quality. Each weight and element was assigned a plus or minus sign to reflect the nature of impact for that criterion on a consumer's perception of quality. For instance, the criteria of on-time arrival performance are included as a positive element because it is reported in terms of on-time successes, suggesting that a higher number is favorable to consumers. The weight for this criterion is high due to the importance most consumers place on this aspect of airline service. Conversely, the criteria that includes mishandled baggage is included as a negative element, and is reported in terms of mishandled bags per 1000 passengers served, suggesting that a higher number is unfavorable to consumers. Because having baggage arrive with passengers is important to consumers the weight for this criterion is also high. Weights and positive/negative signs are independent of each other. Weights reflect importance of the criteria in consumer decision-making, while signs reflect the direction of impact that the criteria should have on the consumer's rating of airline quality. When all criteria, weights and impacts are combined for an airline over the year, a single interval scaled value is obtained. This value is comparable across airlines and across time periods. In the spring of 2002, a nationwide survey of frequent flyers was conducted that allowed a revisiting of the weighting for the AQR elements. Analysis of the sample of 766 opinions showed no appreciable difference in the relative weights for the AQR elements. To maintain comparability across the years, the weights have been held constant. The Airline Quality Rating criteria and the weighted average methodology allow a focused comparison of domestic airline performance. Unlike other consumer opinion approaches that have relied on consumer surveys and subjective opinion, the AQR continues to use a mathematical formula that considers multiple weighted objective criteria to arrive at a single, fully comparable rating for airline industry performance. The Airline Quality Rating provides both consumers and industry watchers a means for monitoring comparative quality for each airline on a timely basis, using objective, performance-based data. Over its 21 year history, the Airline Quality Rating has often been cited as an industry standard for comparing airline performance. Currently the AQR stands as the only regularly published rating available for airline performance. With the continued global trend in airline operations alliances, the argument becomes even stronger for the Airline Quality Rating to be used as a standard method for comparing the quality of airline performance for international operations as well.
7 Table 1 AIRLINE QUALITY RATING CRITERIA, WEIGHTS AND IMPACT CRITERIA WEIGHT IMPACT (+/-) OT On-Time DB Denied Boardings MB Mishandled Baggage CC Customer Complaints Flight Problems Oversales Reservations, Ticketing, and Boarding Fares Refunds Baggage Customer Service Disability Advertising Discrimination Animals Other Data for all criteria is drawn from the U.S. Department of Transportation's monthly Air Travel Consumer Report. ( The formula for calculating the AQR score is: (+8.63 x OT) + (-8.03 x DB) + (-7.92 x MB) + (-7.17 x CC) AQR = ( )
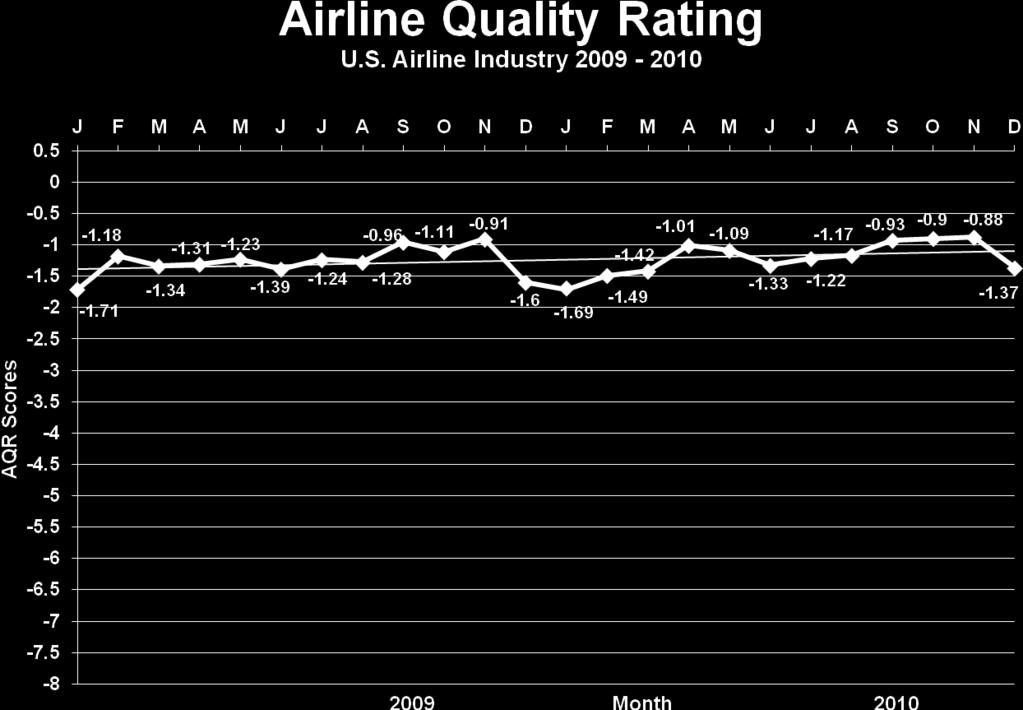
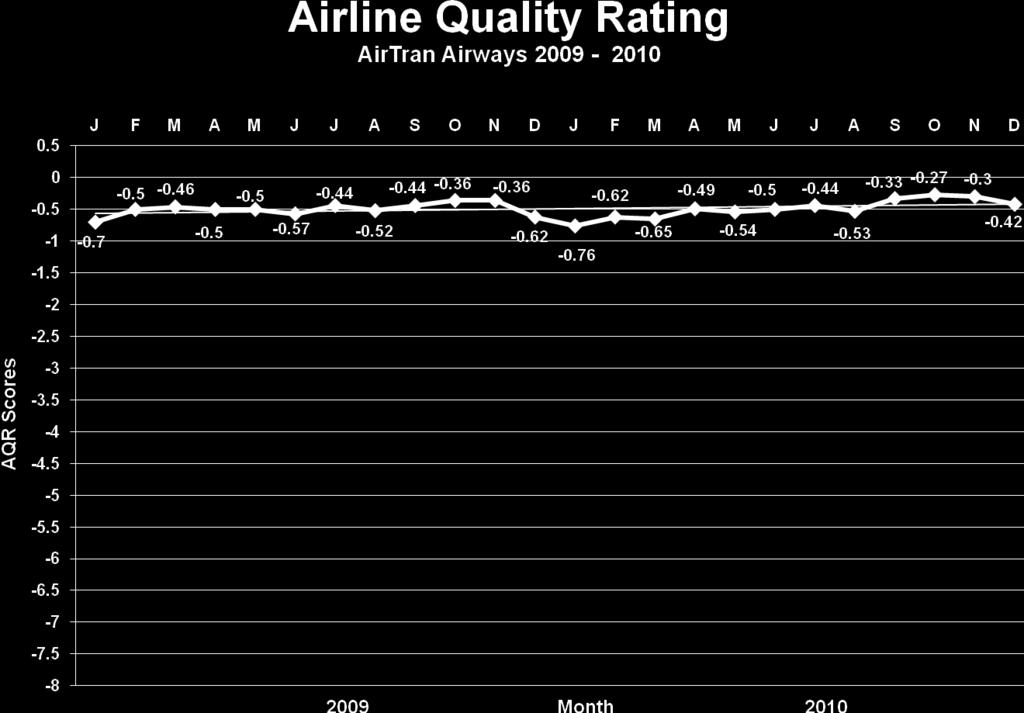
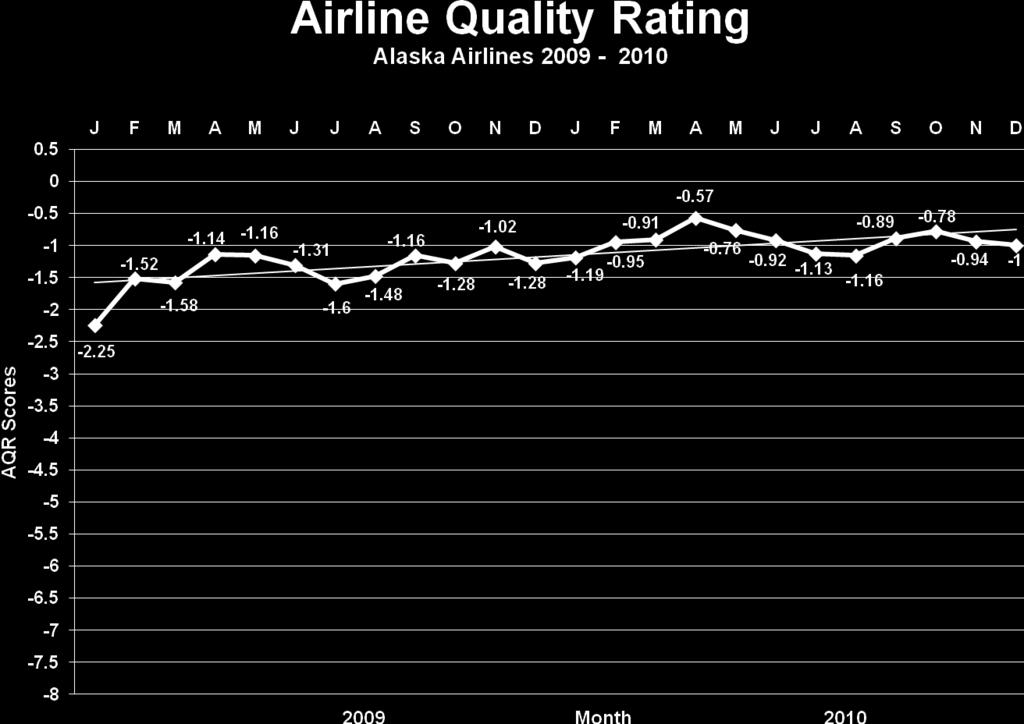
8 What the Airline Quality Rating Tells Us About 2010 The Airline Quality Rating industry score for 2010 shows an industry that has again improved in overall quality over the course of Of the 16 carriers rated in both 2009 and 2010, nine carriers improved and seven carriers declined in Airline Quality Rating scores. Atlantic Southeast had the largest improvement in overall score, while Frontier and Hawaiian had the largest decline in AQR score for The overall industry AQR score was better in 2010 than in 2009, due to improved industry performance in three of the four areas tracked. As an industry, the AQR criteria shows that on-time arrival percentage was better (80.0% in 2010 compared to 79.4% in 2009), mishandled baggage rates improved to 3.49 per 1,000 passengers in 2010 from 3.88 per 1,000 passengers in 2009, and involuntary denied boardings per passenger served decreased to 1.08 per 10,000 passengers in 2010 from 1.19 per 10,000 passengers in Consumer complaint rates increased to 1.22 per 100,000 passengers in 2010 from 0.97 per 100,000 passengers in Of the 9,119 complaints registered with DOT regarding U.S. domestic carriers, 48.8% were for either flight problems or baggage handling problems. Taking all 16 rated airlines together, the AQR score for the industry improved from a level of in 2009 to in With a mixed bag of gains and losses across the 16 carriers rated, the slight gain in AQR score for the industry is a positive sign. The improvement trend in AQR scores since 2007 speaks well of the industry efforts in difficult times. AirTran Airways (FL) On-time performance improved in 2010 (82.8% in 2010 compared to 75.8% in 2009). AirTran s denied boardings performance (0.24 per 10,000 passengers in 2009 compared to 0.39 in 2010) was worse. A decrease in customer complaint rate to 0.90 complaints per 100,000 passengers in 2010 was better than their 2009 rate of The mishandled baggage rate of 1.63 per 1,000 passengers in 2010 was improved from 1.67 for For the second year in a row, this was the best mishandled baggage rate of all airlines rated. Alaska Airlines (AS) had performance improvement in all of the four areas tracked. Better on-time arrival performance (87.6% in 2010 compared to 82.9% in 2009), fewer mishandled bags per 1,000 passengers (3.13 in 2010 compared to 3.98 in 2009), fewer involuntary denied boardings (1.18 in 2010 compared to 2.03 per 10,000 passengers in 2009), and a lower rate of customer complaints (0.44 per 100,000 passengers in 2010 compared to 0.50 in 2009) brought Alaska Airlines overall AQR score down for With all areas showing gains, the AQR score of for Alaska Airlines for 2009 was improved to for Alaska Airlines was one of four airlines showing a 30+% improvement in their AQR score for 2010 compared to 2009.
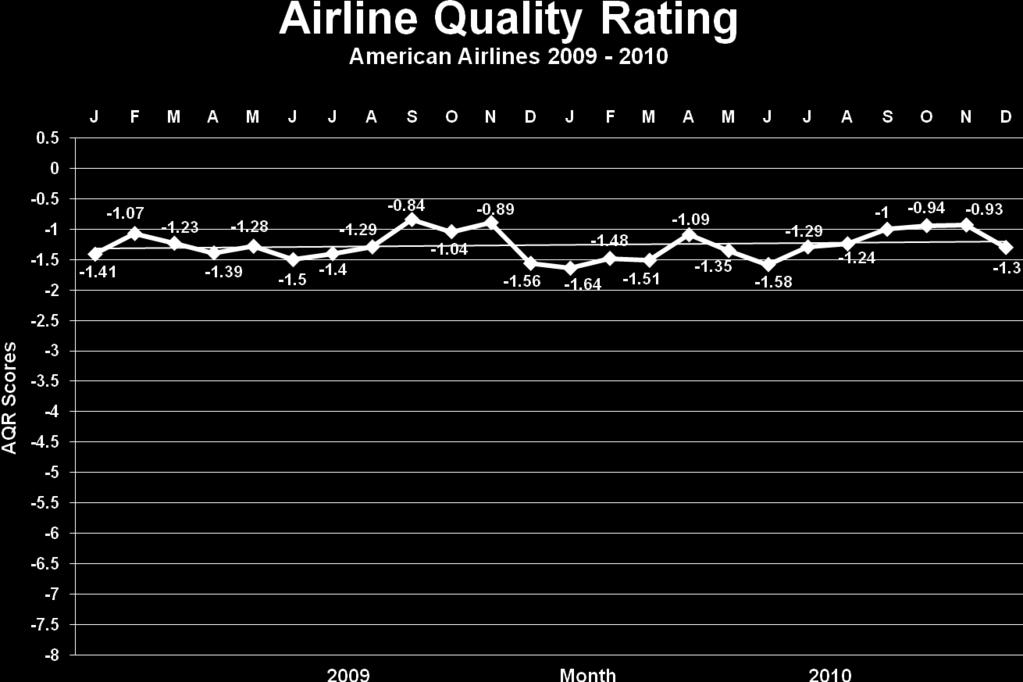
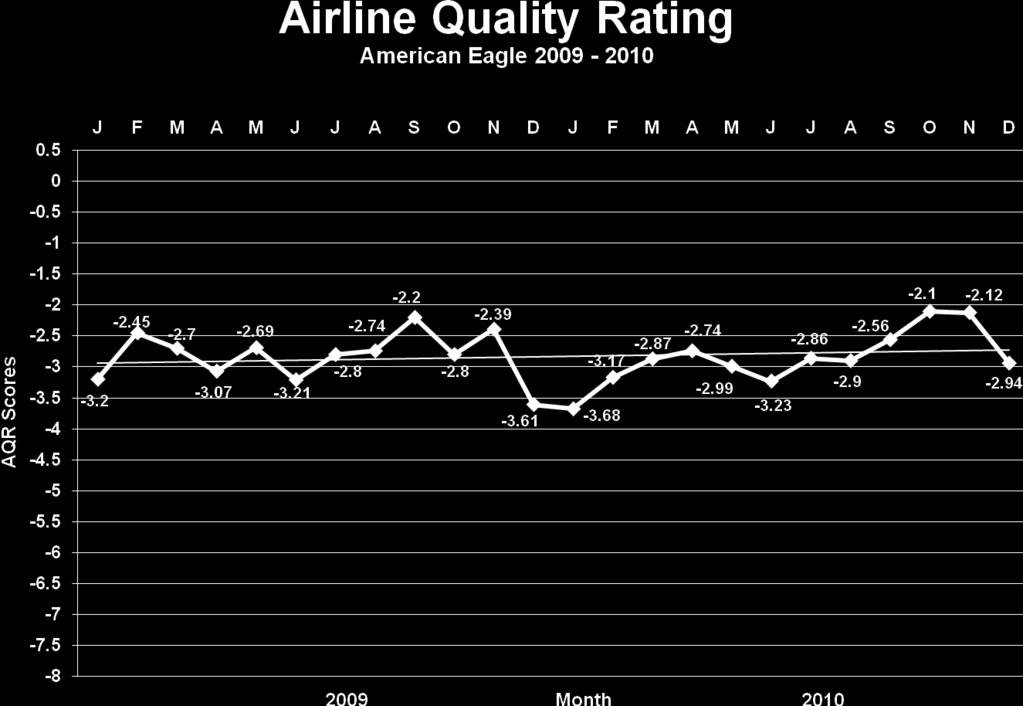
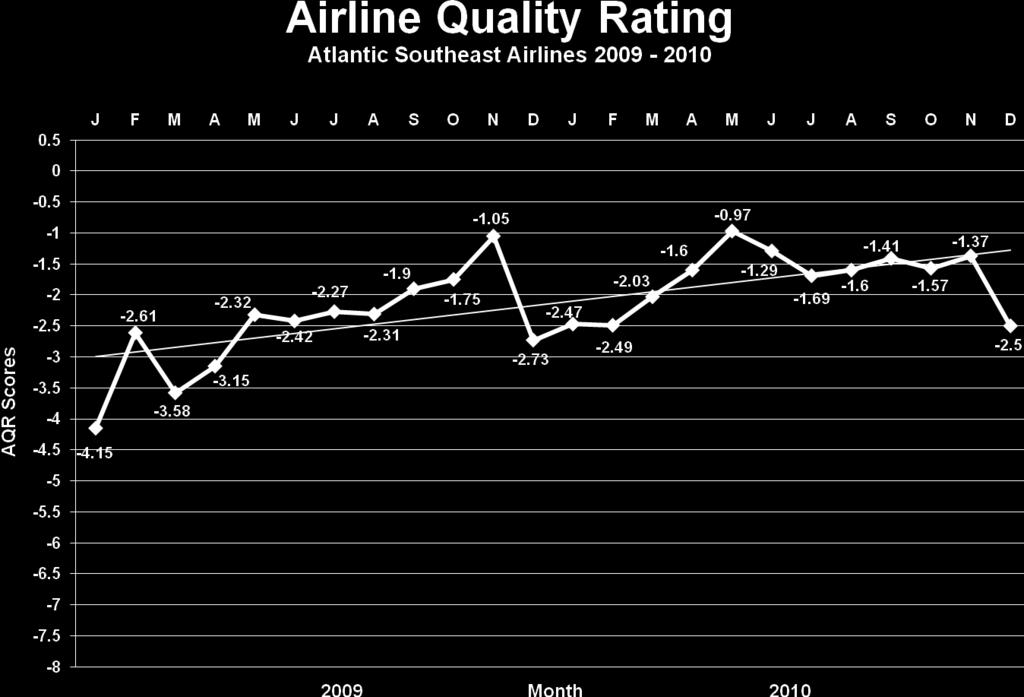
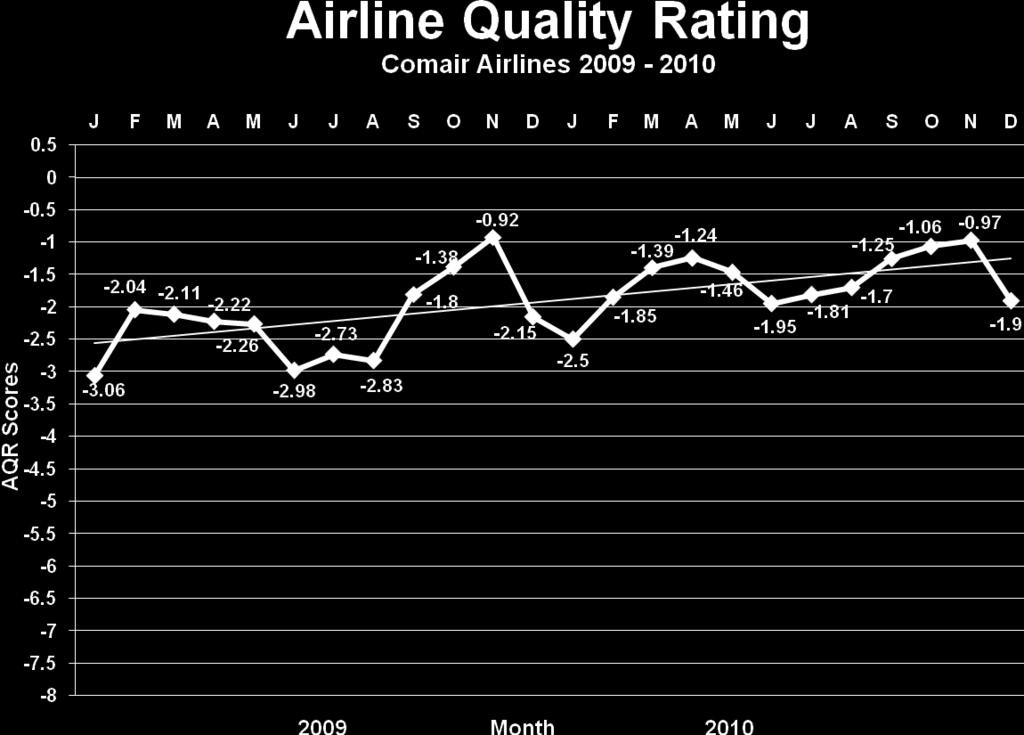
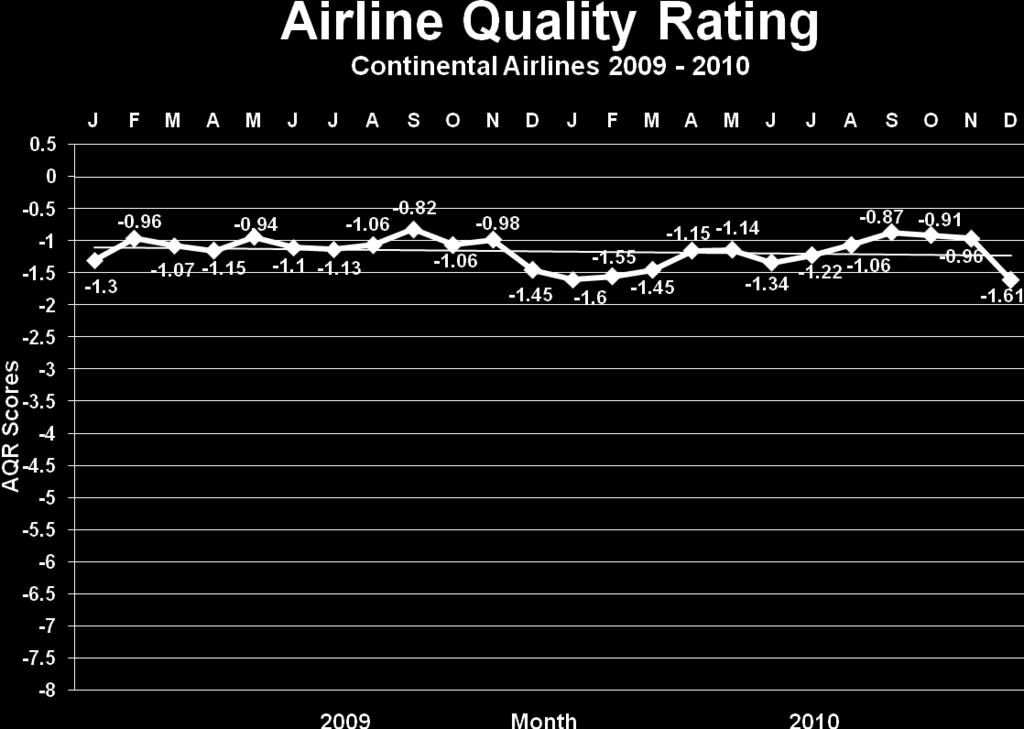
9 American Airlines (AA) AQR score for 2010 declined slightly. The slight decline in AQR score (-1.25 in 2009 compared to for 2010) reflects a combination of better performance for on-time arrivals (79.6% in 2010 compared to 77.2% in 2009) and mishandled baggage (3.82 in 2010 compared to 4.32 in 2009), but poorer performance for denied boardings (0.86 in 2010 compared to 0.56 in 2009) and customer complaints per 100,000 passengers (1.44 in 2010 compared to 1.04 in 2009). The combination of performance outcomes produced a slight decrease in AQR score for American Eagle (MQ) had a denied boarding rate of 4.02 for 2010, up from 3.76 per 10,000 passengers in The airline had an increase in the rate of customer complaints (0.64 in 2009 up to 1.03 per 100,000 passengers in 2010). On-time performance was 77.1% in 2010 compared to 77.2% for Their mishandled baggage rate (7.78 per 1,000 passengers in 2009 was lower at 7.15 in 2010) was again well above the industry rate of 3.49, but did show improvement. This combination of performance on the criteria produced a nearly identical AQR score for 2010 (-2.83 in 2009 and for 2010). This lack of change in AQR score kept American Eagle as the airline with the worst AQR score of all airlines rated for Atlantic Southeast Airlines (EV) On-time performance was 79.2% in 2010, an improvement over their 71.2% performance for Atlantic Southeast s denied boarding performance was dramatically better for 2010 (2.27 per 10,000 passengers in 2009 compared to 0.56 in 2010). Their mishandled baggage rate of 7.87 per 1,000 passengers in 2009 (industry highest in 2009) was improved for 2010 to Atlantic Southeast s 2010 customer complaint rate of 0.54 complaints per 100,000 passengers was also better than their 2009 rate of For 2010, Atlantic Southeast showed the most improvement in their AQR score of all the airlines rated. Comair (OH) On-time performance improved from 69.0% in 2009 to 73.1% in Comair s denied boarding performance dramatically improved from 2.63 in 2009 to 0.56 per 10,000 passengers in An increase in the rate of customer complaints to 1.25 complaints per 100,000 passengers in 2010 from 1.03 in 2009 was near the industry average of 1.22 for Their mishandled baggage rate of 5.28 per 1,000 passengers in 2010 is higher than the industry rate of 3.49 but better than their 2009 rate of Overall, Comair had the third worst AQR score (-1.56) of the sixteen airlines rated. On a positive note, Comair did have the second largest improvement in AQR score of all airlines rated. Continental Airlines (CO) Posted gains in performance for two of the four AQR criteria. Customer complaint rate was worse (1.48 in 2010 versus 1.00 in 2009) along with their denied boardings rate (1.82 in 2010 compared to 1.57 in 2009). An improvement in mishandled baggage per 1,000 passengers (2.65 in 2010 compared to 2.73 in 2009) helped Continental s AQR score. On-time performance (81.4% in 2010 compared to 78.8% in 2009) also helped increase their overall AQR score from in 2009 to in 2010.
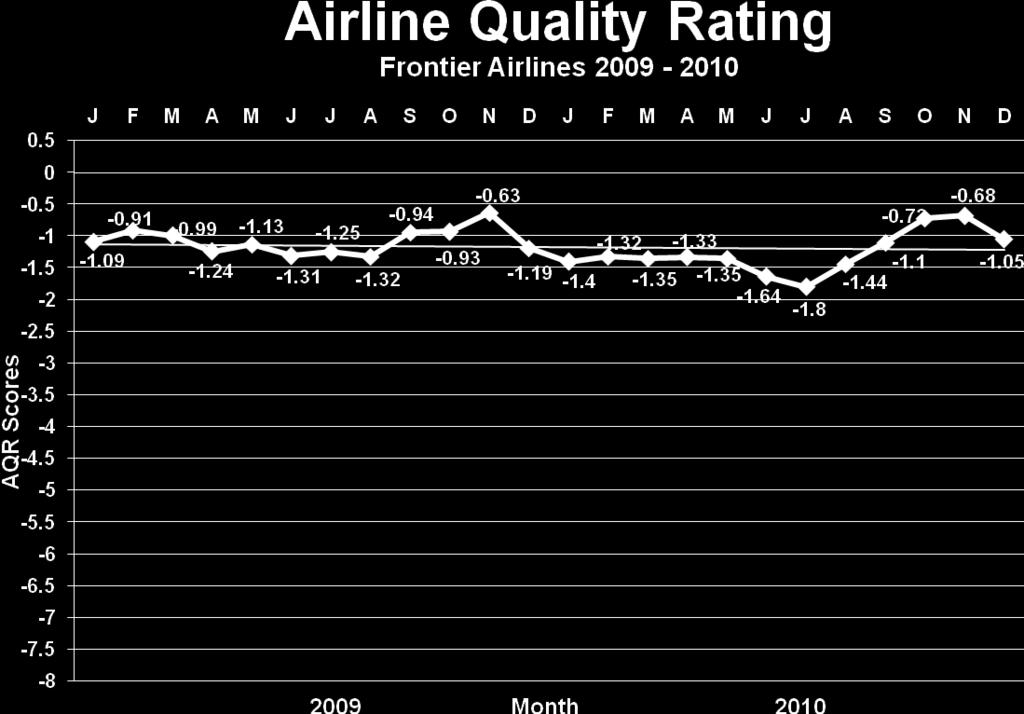
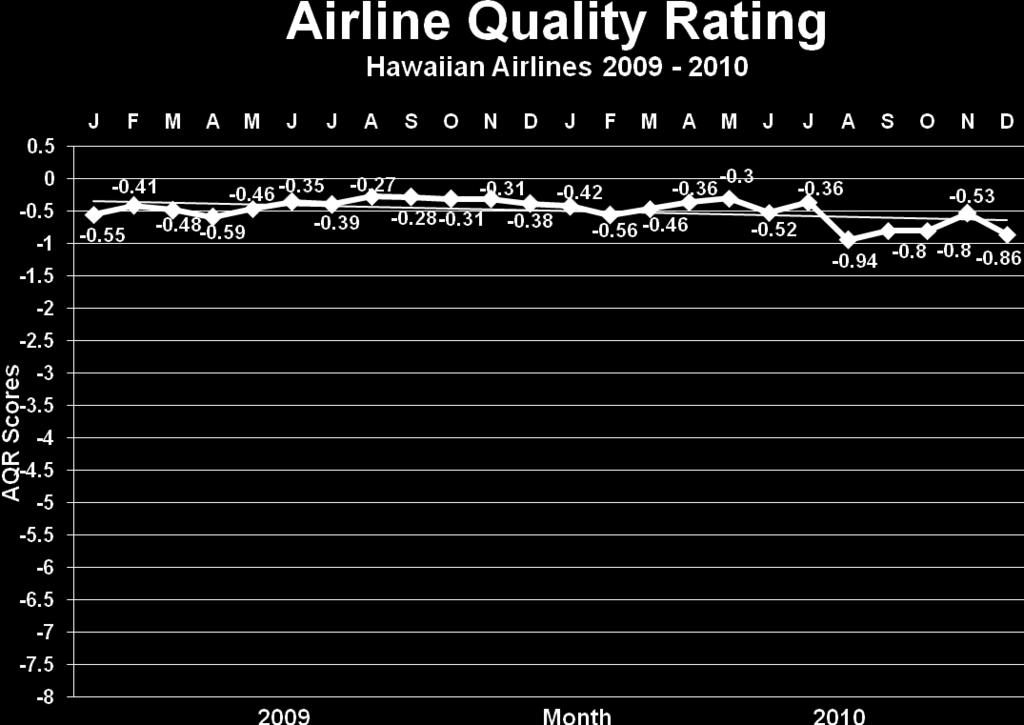
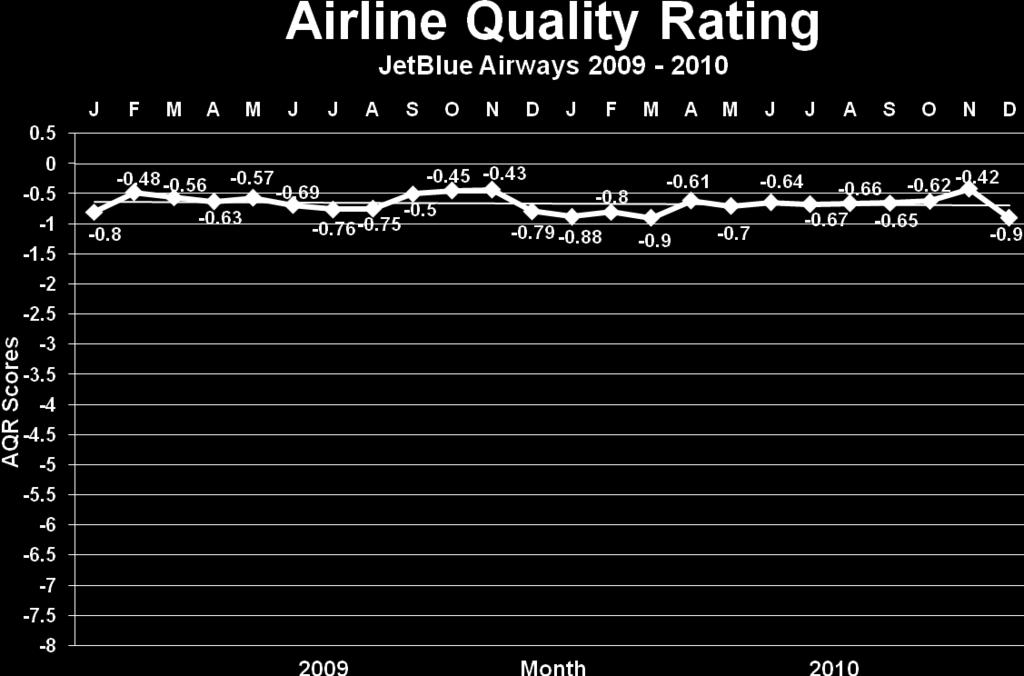
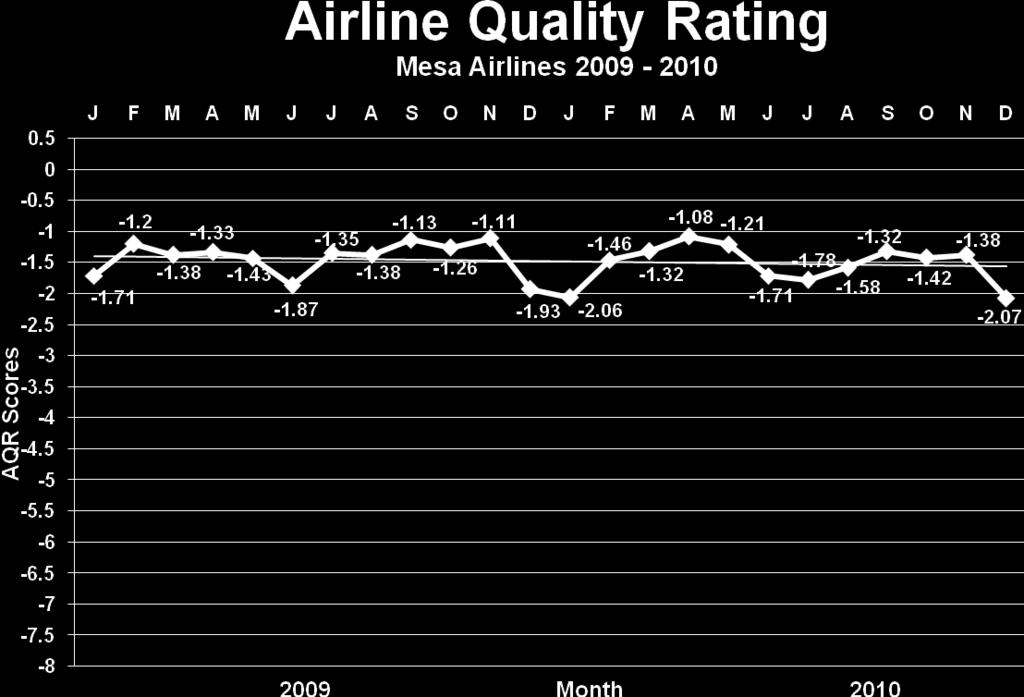
10 Delta Air Lines (DL) On-time percentage for 2010 shows a decline over 2009 (78.6% in 2009 and 77.4% in 2010). Their rate of mishandled baggage (4.89 in 2009 improved to 3.49 in 2010) was right on the industry average of 3.49 mishandled bags per 1,000 passengers. A decrease in denied boardings (2009 rate of 1.12 per 10,000 passengers down to 0.41 for 2010) and a nearly identical rate of customer complaints (1.96 in 2009 and 2.00 in 2010) combined to move Delta s AQR score to in 2010 from in With gains in two of four criteria and only small declines in the other criteria, Delta s overall AQR score improved for Frontier Airlines (F9) On-time performance in 2010 (81.4%) was slightly better than the 78.3% posted for Frontier s denied boarding performance (2.26 per 10,000 passengers in 2010 compared to 1.88 in 2009) was worse than last year. A customer complaint rate of 1.23 complaints per 100,000 passengers for 2010 was worse than their 2009 rate of Their mishandled baggage rate of 2.58 per 1,000 passengers was slightly worse than their 2009 rate of Frontier s AQR score is for 2010 compared to for Hawaiian Airlines (HA) On-time performance (92.5% in 2010 and 92.1% for 2009) is the best of all airlines rated for 2009 and Hawaiian s denied boarding performance (0.04 per 10,000 passengers in 2010 and 0.03 in 2009) was again the second best of the airlines rated and compares very favorably to the industry average of A customer complaint rate of 1.16 complaints per 100,000 passengers was well above last year s rate of Their mishandled baggage rate of 2.23 per 1,000 passengers (second best of all rated) is worse than their 2009 rate of Hawaiian had the second best AQR score for 2010 at JetBlue Airways (B6) On-time performance in 2010 dropped to 75.7% from 77.5% in Jet Blue s denied boarding performance (0.01 per 10,000 passengers in 2010 and 0.00 in 2009) is the lowest of the airlines rated. A customer complaint rate of 1.25 complaints per 100,000 passengers was higher in 2010 (0.85 in 2009) but it was near the industry average of 1.22 for Their mishandled baggage rate of 2.48 per 1,000 passengers in 2010 was third best among airlines rated and it was less than their 2009 rate of JetBlue had the third best AQR score (-0.70) of the airlines rated for Mesa Airlines (YV) On-time performance of 83.3% in 2010 is better than their rate of 79.1% in Mesa s denied boarding performance in 2010 (2.55 per 10,000 passengers) was worse than their rate of 1.47 in A customer complaint rate of 0.53 complaints per 100,000 passengers shows improvement over the 2009 rate of Their mishandled baggage rate of 3.97 per 1,000 passengers is above the industry rate of 3.49 but is improved from their 2009 rate of Overall, Mesa s AQR score was for 2010, a drop from the score for 2009.
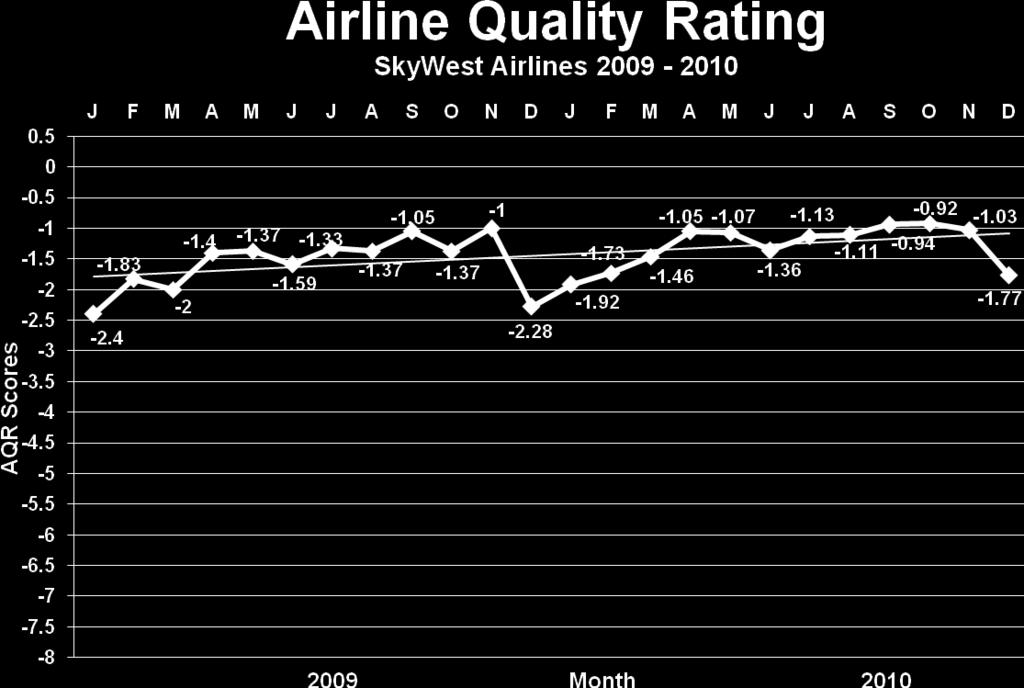
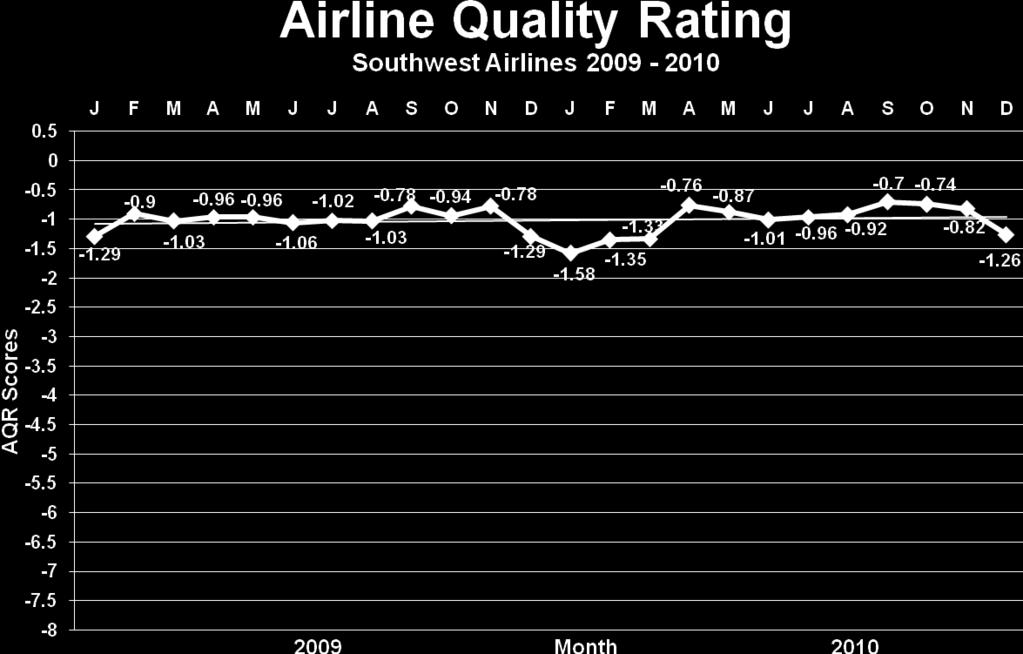
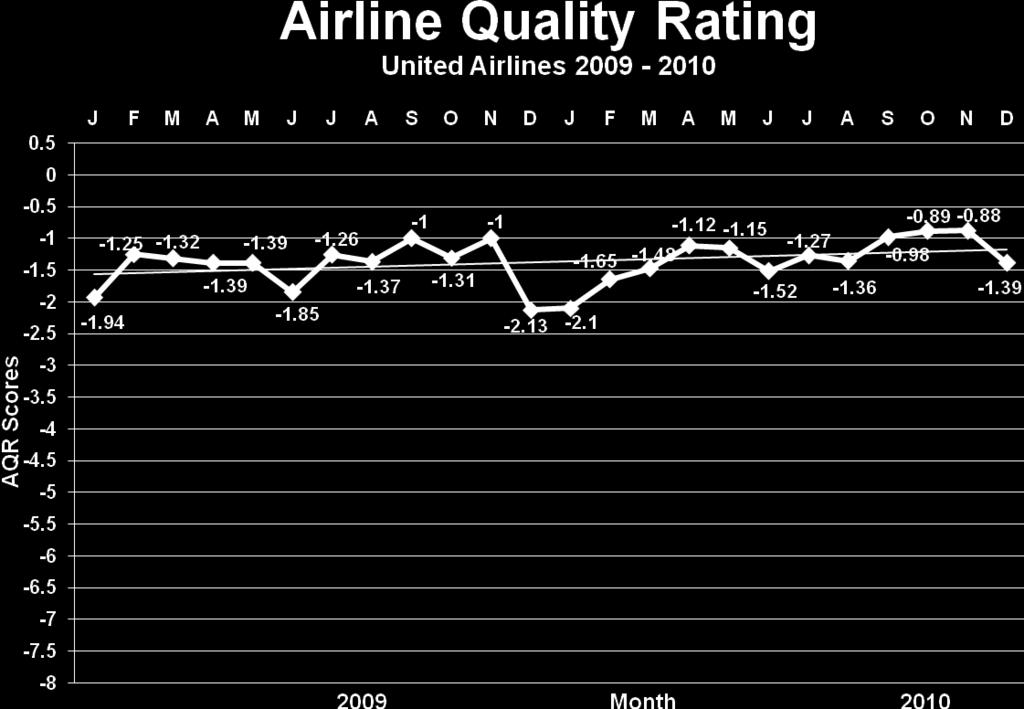
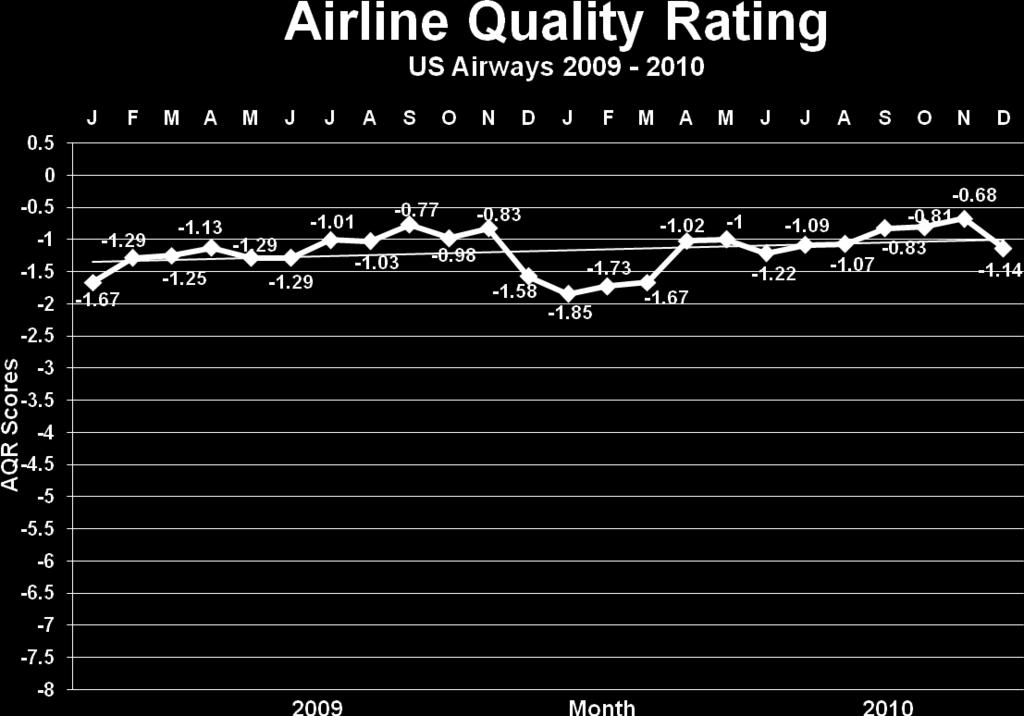
11 SkyWest Airlines (OO) On-time performance of 79.1% in 2010, was down from 82.1% for SkyWest s denied boarding performance (0.70 per 10,000 passengers in 2010 compared to 1.03 in 2009)) was improved and better than the industry average for A customer complaint rate of 0.61 complaints per 100,000 passengers in 2010 compared to the 2009 rate of 0.49 had a negative impact on their 2010 AQR score. Their mishandled baggage rate of 4.72 per 1,000 passengers in 2010 is improved from the 2009 rate of 5.69 bags per 1,000 passengers. SkyWest s AQR score improved in 2010 to from in Southwest Airlines (WN) On-time arrival percentages of 79.5% in 2010 was down from 83.0% in A customer complaint rate of 0.27 per 100,000 passengers in 2010 and 0.21 in 2009 are the industry s best. Southwest Airlines is consistently the airline with the lowest customer complaint rate in the industry. An involuntary denied boarding rate of 1.24 per 10,000 passengers in 2010, decreased slightly from 1.29 per 10,000 passengers in Their mishandled baggage rate of 3.43 per 1,000 passengers in 2010 is identical to their rate of 3.43 per 1,000 passengers for Overall, Southwest shows a nearly identical AQR score of for 2009 and for United Airlines (UA) improved their on-time arrival performance (from 81.0% in 2009 to 85.2% in 2010) and their mishandled baggage rate (4.10 per 1,000 passengers in 2009 to 3.40 in 2010) for Performance regarding denied boarding rate (1.30 per 10,000 passengers in 2009 compared to 1.27 in 2010) changed very little. A higher customer complaint rate (1.34 in 2009 compared to 1.64 per 100,000 passengers in 2010) combined with other improvements helped United lower their 2010 AQR score to from in US Airways (US) showed improvement in two of the four performance areas tracked for A closer look reveals that US Airways performed better in on-time performance (83.0% in 2010 compared to 80.9% in 2009) and mishandled baggage (2.56 per 1,000 passengers in 2010 compared to 3.03 in 2009). Customer complaint rate (1.53 per 100,000 passengers in 2010 compared to 1.31 in 2009) and a denied boarding rate of 1.61 per 10,000 passengers in 2010 compared to 1.41 in 2009 were negatives for US Airways. Their overall 2010 AQR score (-1.17) reflects slight improvement (-1.19 in 2009) for 2010.
12 Previous Airline Quality Reports Bowen, Brent D., Dean E. Headley and Jacqueline R. Luedtke (1991), Airline Quality Rating, National Institute for Aviation Research Report 91-11, Wichita, Kansas. Bowen, Brent D., and Dean E. Headley (1992,1993,1994,1995), Airline Quality Rating Report, National Institute for Aviation Research Report Series, Wichita, Kansas. Bowen, Brent D., and Dean E. Headley (1996, 1997, 1998, 1999, 2000, 2001, 2002, 2003, 2004, 2005, 2006, 2007, 2008, 2009, 2010), Airline Quality Rating Report, W. Frank Barton School of Business, Wichita, Kansas. For more information contact either: Dr. Dean E. Headley, Associate Professor Dr. Brent D. Bowen, Professor Department of Marketing Department of Aviation Technology W. Frank Barton School of Business College of Technology Wichita State University Purdue University 304 Clinton Hall 1401 Aviation Dr. Wichita, KS West Lafayette, IN Office: (316) Office: (765)
13 Detail of Airline Performance Since the Airline Quality Rating is comparable across airlines and across time, monthly rating results can be examined both individually and collectively. The following pages outline the AQR scores for the industry and for each airline rated by month for For comparison purposes, results are also displayed for 2009 where available. A composite industry chart that combines the airlines tracked is shown at first, with individual airline performance charts following in alphabetical order.
14 Airline Quality Rating Scores 2010 AQR 2009 AQR 2008 AQR 2007 AQR 2006 AQR 2005 AQR 2004 AQR Score Rank Score Rank Score Rank Score Rank Score Rank Score Rank Score Rank Air Tran Alaska American American Eagle Atlantic Southeast Comair Continental Delta Frontier N/A - N/A - Hawaiian N/A - N/A - N/A - N/A - JetBlue Mesa N/A - N/A - SkyWest Southwest United US Airways Industry NOTES: As of January 2010, data of the merged operations of Delta Air Lines and Northwest Airlines are combined and appear only as Delta Air Lines. Scores and rankings for 2008 reflect the addition of Hawaiian to the airlines tracked. Scores and rankings for 2006 reflect the addition of Frontier and Mesa to the airlines tracked. As of January 2006, data of the merged operations of US Airways and America West Airlines are combined and appear only as US Airways. Scores and Rankings for 2004 reflect the addition of Comair and SkyWest to the group tracked.
15
16
17
18
19
20
21
22
23
24

25
26
27
28
29
30
31
32
33
34
35
36
37
38
39
40
41
42
43
44
45
46
47
48
49 Detail of Frequently Cited Airline Performance Criteria Consumer interest remains high regarding such issues as on-time performance, mishandled baggage, involuntary denied boardings (bumping), and treatment of customers. Since these criteria are central to the AQR calculations, it is important to provide more complete data for individual airlines in these areas. The following data tables provide a detailed look at the performance of each of the 16 U.S. airlines required to report performance in the specific areas of on-time arrivals, mishandled baggage, involuntary denied boardings, and consumer complaints to the Department of Transportation in The requirement is based on the criteria that an airline handled at least 1% or more of the total domestic scheduled-service passenger revenues for Data were drawn from the U.S. Department of Transportation monthly Air Travel Consumer Report. The final pages of this report outline the Airline Quality Rating criteria definitions for reference and clarity in more fully understanding the nature of the data reported.
50 2010 On-Time Arrival Percentage by Month for U.S. Airlines Jan Feb Mar Apr May Jun Jul Aug Sep Oct Nov Dec Annual AirTran (FL) Alaska (AS) American (AA) American Eagle (MQ) Atlantic Southeast (EV) Comair (OH) Continental (CO) Delta (DL) Frontier (F9) Hawaiian (HA) JetBlue (B6) Mesa (YV) SkyWest (OO) Southwest (WN) United (UA) US Airways (US) Industry by Month Express Jet (XE) Pinnacle (9E) This airline is not included in the Industry value. Only 16 airlines that are required to report all data elements for 2010 are part of the Industry value. Performance statistics are presented here for reference and comparison. Source: Air Travel Consumer Report, U.S. Department of Transportation, Office of Aviation Enforcement and Proceedings.
51 2009 On-Time Arrival Percentage by Month for U.S. Airlines Jan Feb Mar Apr May Jun Jul Aug Sep Oct Nov Dec Annual AirTran (FL) Alaska (AS) American (AA) American Eagle (MQ) Atlantic Southeast (EV) Comair (OH) Continental (CO) Delta (DL) Express Jet (XE) Frontier (F9) Hawaiian (HA) JetBlue (B6) Mesa (YV) Northwest (NW) SkyWest (OO) Southwest (WN) United (UA) US Airways (US) Industry by Month Pinnacle (9E) This airline voluntarily reports performance data. Only the 18 airlines required to report all data elements for 2009 are part of the Industry value. Performance statistics for this airline are presented for reference and comparison. Source: Air Travel Consumer Report, U.S. Department of Transportation, Office of Aviation Enforcement and Proceedings.
52 2010 Involuntary Denied Boardings by Quarter for U.S. Airlines (per 10,000 passengers) 1st 2nd 3rd 4th Quarter Quarter Quarter Quarter Annual AirTran (FL) Alaska (AS) American (AA) American Eagle (MQ) Atlantic Southeast (EV) Comair (OH) Continental (CO) Delta (DL) Frontier (F9) Hawaiian (HA) JetBlue (B6) Mesa (YV) SkyWest (OO) Southwest (WN) United (UA) US Airways (US) Industry by Quarter Express Jet (XE) Pinnacle (9E) This airline is not included in the Industry value. Only the 16 airlines that are required to report all data elements for 2010 are part of the Industry value. Performance statistics are presented here for reference and comparison. Source: Air Travel Consumer Report, U.S. Department of Transportation, Office of Aviation Enforcement and Proceedings.
53 2009 Involuntary Denied Boardings by Quarter for U.S. Airlines (per 10,000 passengers) 1st 2nd 3rd 4th Quarter Quarter Quarter Quarter Annual AirTran (FL) Alaska (AS) American (AA) American Eagle (MQ) Atlantic Southeast (EV) Comair (OH) Continental (CO) Delta (DL) Express Jet (RU) Frontier (F9) Hawaiian (HA) JetBlue (B6) Mesa (YV) Northwest (NW) SkyWest (OO) Southwest (WN) United (UA) US Airways (US) Industry by Quarter Pinnacle (9E) This airline voluntarily reports performance data. Only the 18 airlines required to report all data elements for 2009 are part of the Industry value. Performance statistics are presented for reference and comparison Source: Air Travel Consumer Report, U.S. Department of Transportation, Office of Aviation Enforcement and Proceedings.
54 2010 Mishandled Baggage by Month for U.S. Airlines (per 1,000 passengers) Jan Feb Mar Apr May Jun Jul Aug Sep Oct Nov Dec Annual AirTran (FL) Alaska (AS) American (AA) American Eagle (MQ) Atlantic Southeast (EV) Comair (OH) Continental (CO) Delta (DL) Frontier (F9) Hawaiian (HA) JetBlue (B6) Mesa (YV) SkyWest (OO) Southwest (WN) United (UA) US Airways (US) Industry by Month Express Jet (XE) Pinnacle (9E) This airline is not included in the Industry value. Only 16 airlines that are required to report all data elements for 2010 are part of the Industry value. Performance statistics are presented here for reference and comparison. Source: Air Travel Consumer Report, U.S. Department of Transportation, Office of Aviation Enforcement and Proceedings.
55 2009 Mishandled Baggage by Month for U.S. Airlines (per 1,000 passengers) Jan Feb Mar Apr May Jun Jul Aug Sep Oct Nov Dec Annual AirTran (FL) Alaska (AS) American (AA) American Eagle (MQ) Atlantic Southeast (EV) Comair (OH) Continental (CO) Delta (DL) Express Jet (XE) Frontier (F9) Hawaiian (HA) JetBlue (B6) Mesa (YV) Northwest (NW) SkyWest (OO) Southwest (WN) United (UA) US Airways (US) Industry by Month Pinnacle (9E) This airline voluntarily reports performance data. Only the 18 airlines required to report all data elements for 2009 are part of the Industry value. Performance statistics are presented here for reference and comparison. Source: Air Travel Consumer Report, U.S. Department of Transportation, Office of Aviation Enforcement and Proceedings.
56 2010 Total Complaints to Department of Transportation by Month for U.S. Airlines (per 100,000 passengers) Jan Feb Mar Apr May Jun Jul Aug Sep Oct Nov Dec Annual AirTran (FL) Alaska (AS) American (AA) American Eagle (MQ) Atlantic Southeast (EV) Comair (OH) Continental (CO) Delta (DL) Frontier (F9) Hawaiian (HA) JetBlue (B6) Mesa (YV) SkyWest (OO) Southwest (WN) United (UA) US Airways (US) Industry by Month Express Jet (XE) Pinnacle (9E) This airline is not included in the Industry value. Only 16 airlines that are required to report all data elements for 2010 are part of the Industry value. Performance statistics are presented here for reference and comparison. Source: Air Travel Consumer Report, U.S. Department of Transportation, Office of Aviation Enforcement and Proceedings.
57 2009 Total Complaints to Department of Transportation by Month for U.S. Airlines (per 100,000 passengers) Jan Feb Mar Apr May Jun Jul Aug Sep Oct Nov Dec Annual AirTran (FL) Alaska (AS) American (AA) American Eagle (MQ) Atlantic Southeast (EV) Comair (OH) Continental (CO) Delta (DL) Express Jet (XE) Frontier (F9) Hawaiian (HA) JetBlue (B6) Mesa (YV) Northwest (NW) SkyWest (OO) Southwest (WN) United (UA) US Airways (US) Industry by Month Pinnacle (9E) This airline voluntarily reports performance data. Only the 18 airlines required to report all data elements for 2009 are part of the Industry value. Performance statistics are presented here for reference and comparison. Source: Air Travel Consumer Report, U.S. Department of Transportation, Office of Aviation Enforcement and Proceedings.
58 Monthly Count of Complaints Received by Department of Transportation Regarding U.S. Airlines in 2010 and 2009 Top Four Categories 1 Complaints for of Complaints for All U.S. Airlines U.S. Airlines in Jan FP BG CS TB Feb FP BG TB CS Mar FP BG TB CS Apr FP BG TB CS May FP BG TB CS Jun 1, FP TB BG CS Jul FP BG TB CS Aug 1, FP TB BG CS Sep FP BG TB CS Oct FP BG CS TB Nov FP BG CS TB Dec FP BG CS TB 9,119 7,120 1 FP = Flight Problems; CS = Customer Service; BG = Baggage; TB = Reservations, Ticketing, and Boarding; RF = Refunds; Details of categories are at the back of this report. Source: Air Travel Consumer Report, U.S. Department of Transportation, Office of Aviation Enforcement and Proceedings.
59 Overview of Complaints Received by Department of Transportation for U.S. Domestic Airlines in 2010 and 2009 by Complaint Category % of all Complaints Received Number of Complaints Received Flight Problems 32.9% 25.9% 2,996 1,846 Baggage 15.9% 17.8% 1,453 1,265 Reservations, Ticketing, and Boarding 13.1% 15.0% 1,192 1,069 Customer Service 12.9% 13.5% 1, Refunds 5.6% 6.1% Disability 5.5% 6.5% Oversales 5.2% 4.6% Fares 3.9% 4.8% Other 3.1% 3.8% Discrimination 1.3% 1.5% Advertising 0.7% 0.5% Animals 0.0% 0.1% 4 5 Total 100% 100% 9,119 7,120 Source: Air Travel Consumer Report, U.S. Department of Transportation, Office of Aviation Enforcement and Proceedings.
60 Airline Quality Rating Criteria Overview The individual criteria used to calculate the AQR scores are summed up in four basic areas that reflect customer-oriented areas of airline performance. Definitions of the four areas used in this AQR 2009 (2008 data) are outlined below. OT ON-TIME PERFORMANCE (+8.63) Regularly published data regarding on-time arrival performance is obtained from the U.S. Department of Transportation's Air Travel Consumer Report. According to the DOT, a flight is counted "on time" if it is operated within 15 minutes of the scheduled time shown in the carriers' Computerized Reservations Systems. Delays caused by mechanical problems are counted as of January 1, Canceled and diverted operations are counted as late. The AQR calculations use the percentage of flights arriving on time for each airline for each month. DB INVOLUNTARY DENIED BOARDINGS (-8.03) This criterion includes involuntary denied boardings. Data regarding denied boardings can be obtained from the U.S. Department of Transportation's Air Travel Consumer Report. Data includes the number of passengers who hold confirmed reservations and are involuntarily denied boarding on a flight that is oversold. These figures include only passengers whose oversold flight departs without them onboard. The AQR uses the ratio of involuntary denied boardings per 10,000 passengers boarded by month. MB MISHANDLED BAGGAGE REPORTS (-7.92) Regularly published data regarding consumer reports to the carriers of mishandled baggage can be obtained from the U.S. Department of Transportation's Air Travel Consumer Report. According to the DOT, a mishandled bag includes claims for lost, damaged, delayed, or pilfered baggage. Data is reported by carriers as to the rate of mishandled baggage reports per 1,000 passengers and for the industry. The AQR ratio is based on the total number of reports each carrier received from passengers concerning lost, damaged, delayed, or pilfered baggage per 1,000 passengers served. CC CONSUMER COMPLAINTS (-7.17) The criteria of consumer complaints is made up of 12 specific complaint categories (outlined below) monitored by the U. S. Department of Transportation and reported monthly in the Air Travel Consumer Report. Consumers can file complaints with the DOT in writing, by telephone, via , or in person. The AQR uses complaints about the various categories as part of the larger customer complaint criteria and calculates the consumer complaint ratio on the number of complaints received per 100,000 passengers flown for each airline.
61 CONSUMER COMPLAINT CATEGORIES Flight Problems Data is available by the total number of consumer complaints pertaining to cancellations, delays, or any other deviations from schedule, whether planned or unplanned for each airline each month. Oversales This complaint category includes all bumping problems, whether or not the airline complied with DOT oversale regulations. Data is available by the total number of consumer complaints pertaining to oversales for each airline each month. Reservations, Ticketing, and Boarding This category includes airline or travel agent mistakes in reservations and ticketing, problems in making reservations and obtaining tickets due to busy telephone lines, or waiting in line or delays in mailing tickets, and problems boarding the aircraft (except oversales). Data is available by the total number of consumer complaints pertaining to ticketing and boarding for each airline each month. Fares As defined by the DOT, consumer complaints regarding fares include incorrect or incomplete information about fares, discount fare conditions and availability, overcharges, fare increases, and level of fares in general. Data is available for the total number of consumer complaints pertaining to fares for each airline each month. Refunds This category includes customer complaints about problems in obtaining refunds for unused or lost tickets, fare adjustments, or bankruptcies. Data is available by the total number of consumer complaints pertaining to refunds for each airline each month. Baggage Claims for lost, damaged, or delayed baggage, charges for excess baggage, carry-on problems, and difficulties with airline claim procedure are included in this category. Data is available by the total number of consumer complaints pertaining to baggage for each airline each month. Customer Service This category includes complaints about rude or unhelpful employees, inadequate meals or cabin service, and treatment of delayed passengers. Data is available by the total number of consumer complaints pertaining to customer service for each airline each month.
62 Disability This category includes complaints about civil rights complaints by air travelers with disabilities. Data is available by the total number of consumer complaints pertaining to disabilities for each airline each month. Advertising These are complaints concerning advertising that is unfair, misleading or offensive to consumers. Data is available by the total number of consumer complaints regarding advertising for each airline each month. Discrimination Civil rights complaints by air travelers (other than disabilities); for example: complaints based on race, national origin, religion, etc. (this category was first reported in May, 2002). Animals This category tracks customer complaints about loss, injury, or death of an animal during air transport by an air carrier. Data is available by the total number of customer complaints regarding animals for each airline each month. Other Data regarding consumer complaints about frequent flyer programs, smoking, tours credit, cargo problems, security, airport facilities, claims for bodily injury, and other problems not classified above are included in this category. Data is available by the total number of consumer complaints regarding other problems for each airline each month.
Airline Quality Rating 2012
 Purdue University Purdue e-pubs Airline Quality Rating Report Advanced Aviation Analytics Institute for Research Center of Research Excellence (A3IR-CORE) 4-1-2012 Airline Quality Rating 2012 Brent D.
Airline Quality Rating 2013
 Purdue University Purdue e-pubs Airline Quality Rating Report Advanced Aviation Analytics Institute for Research Center of Research Excellence (A3IR-CORE) 4-8-2013 Airline Quality Rating 2013 Brent D.
Airline Quality Rating 2015
 Airline Quality Rating Report College of Aviation 4-13-2015 Airline Quality Rating 2015 Brent D. Bowen Embry-Riddle Aeronautical University Dean E. Headley Wichita State University Follow this and additional
Brent D. Bowen University of Nebraska at Omaha Aviation Institute. Dean E. Headley Wichita State University W. Frank Barton School of Business
 Brent D. Bowen University of Nebraska at Omaha Aviation Institute Dean E. Headley Wichita State University W. Frank Barton School of Business April, 28 Airline Quality Rating 28 Brent D. Bowen University
Airline Quality Rating 2019
 Airline Quality Rating Report College of Aviation 4-8-2019 Airline Quality Rating 2019 Brent D. Bowen Embry-Riddle Aeronautical University - Prescott, bowenb6@erau.edu Dean E. Headley Wichita State University
Airline Quality Rating 2014
 Airline Quality Rating Report College of Aviation 4-7-2014 Airline Quality Rating 2014 Brent D. Bowen Embry-Riddle Aeronautical University Dean E. Headley Wichita State University Follow this and additional
Airline Quality Rating 2017
 Airline Quality Rating Report College of Aviation 4-10-2017 Airline Quality Rating 2017 Brent D. Bowen Embry-Riddle Aeronautical University, bowenb6@erau.edu Dean E. Headley Wichita State University Follow
Airline Quality Rating 2018
 Airline Quality Rating Report College of Aviation 4-9-2018 Airline Quality Rating 2018 Brent D. Bowen Embry-Riddle Aeronautical University, bowenb6@erau.edu Dean E. Headley Wichita State University Follow
Airline Quality Rating 2006
 Purdue University Purdue e-pubs Airline Quality Rating Report Advanced Aviation Analytics Institute for Research Center of Research Excellence (A3IR-CORE) 46 Airline Quality Rating 26 Brent D. Bowen University
Wichita State University Libraries SOAR: Shocker Open Access Repository
 Wichita State University Libraries SOAR: Shocker Open Access Repository Airline Quality Rating Report W. Frank Barton School of Business The Airline Quality Rating 212 Brent D. Bowen Purdue University
Wichita State University Libraries SOAR: Shocker Open Access Repository
 Wichita State University Libraries SOAR: Shocker Open Access Repository Report W. Frank Barton School of Business The 27 Brent D. Bowen University of Nebraska at Omaha Dean E. Headley Wichita State University
Evaluation of the US Airline Industry: The Airline Quality Rating 2012
 Purdue University Purdue e-pubs Aviation Technology Faculty and Staff Publications Department of Aviation Technology 2-27-2013 Evaluation of the US Airline Industry: The Airline Quality Rating 2012 Brent
The Airline Quality Rating 2003
 University of Nebraska Omaha DigitalCommons@UNO Faculty Books and Monographs 4-2003 The Airline Quality Rating 2003 Brent D. Bowen University of Nebraska at Omaha Dean Headley Wichita State University
The Airline Quality Rating 2002
 The Airline Quality Rating 2002 Brent D. Bowen University of Nebraska at Omaha Aviation Institute Dean E. Headley Wichita State University W. Frank Barton School of Business April, 2002 What the Airline
The Airline Quality Rating 2002
 University of Nebraska Omaha DigitalCommons@UNO Faculty Books and Monographs 4-2002 The Airline Quality Rating 2002 Brent D. Bowen University of Nebraska at Omaha Dean Headley Wichita State University
The Airline Quality Rating 2001
 The Airline Quality Rating 2001 Brent D. Bowen University of Nebraska at Omaha Aviation Institute Dean E. Headley Wichita State University W. Frank Barton School of Business April, 2001 ABOUT THE AUTHORS
Development of a Model of Airline Consumer Satisfaction
 Purdue University Purdue e-pubs Aviation Technology Faculty and Staff Publications Department of Aviation Technology 2-27-2013 Development of a Model of Airline Consumer Satisfaction Erin E. Bowen Purdue
A Quantitative Methodology for Measuring Airline Quality
 Journal of Aviation/Aerospace Education & Research Volume 2 Number 2 JAAER Winter 1992 Article 1 Winter 1992 A Quantitative Methodology for Measuring Airline Quality Brent D. Bowen Dean E. Headley Jacqueline
Monthly Airport Passenger Activity Summary. December 2007
 T F Green Airport 06/23/08 Monthly Airport Passenger Activity Summary December 2007 Calendar Year Basis Year Year December December Percent to Date to Date Percent 2007 2006 Change 2007 2006 Change Enplaned
AUGUST 2008 MONTHLY PASSENGER AND CARGO STATISTICS
 Inter-Office Memo Reno-Tahoe Airport Authority Date: October 2, 2008 To: Statistics Recipients From: Tom Medland, Director Air Service Business Development Subject: RENO-TAHOE INTERNATIONAL AIRPORT PASSENGER
U.S. DOMESTIC INDUSTRY OVERVIEW FOR MARCH
 Inter-Office Memo Reno-Tahoe Airport Authority Date: April 30, 2009 To: Statistics Recipients From: Krys T. Bart, A.A.E., President/CEO Subject: RENO-TAHOE INTERNATIONAL AIRPORT PASSENGER STATISTICS U.S.
AIRPORT OPERATIONS COUNT FOR THE CALENDAR YEAR ENDED DECEMBER, 2005
 AIRPORT OPERATIONS COUNT FOR THE CALENDAR YEAR ENDED DECEMBER, 2005 ITINERANT(1) LOCAL(2) TOTAL Month-Year AC(a) AT(b) GA(c) MI(d) CI(a) MI(b) Operations (3) January-05 4,452 2,153 1,650 30 8,285 244 0
RENO-TAHOE INTERNATIONAL AIRPORT APRIL 2008 PASSENGER STATISTICS
 Inter-Office Memo Reno-Tahoe Airport Authority Date: June 5, 2008 To: Statistics Recipients From: Tom Medland, Director Air Service Business Development Subject: RENO-TAHOE INTERNATIONAL AIRPORT PASSENGER
Monthly Airport Passenger Activity Summary. December 2010
 T F Green Airport 01/13/11 Monthly Airport Passenger Activity Summary December 2010 Calendar Year Basis Year Year December December Percent to Date to Date Percent 2010 2009 Change 2010 2009 Change Enplaned
Monthly Airport Passenger Activity Summary. December 2011
 T F Green Airport 01/17/12 Monthly Airport Passenger Activity Summary December 2011 Calendar Year Basis Year Year December December Percent to Date to Date Percent 2011 2010 Change 2011 2010 Change Enplaned
Trend Analysis and Operational Performance Indicators in the U.S. Airline Industry
 Department of Aeronautical Science - Prescott College of Aviation 10-9-2014 Trend Analysis and Operational Performance Indicators in the U.S. Airline Industry Jacqueline R. Luedtke Embry-Riddle Aeronautical
Inter-Office Memo Reno-Tahoe Airport Authority
 Inter-Office Memo Reno-Tahoe Airport Authority Date: November 30, 2009 To: Statistics Recipients From: Krys T. Bart, A.A.E., President/CEO Subject: RENO-TAHOE INTERNATIONAL AIRPORT PASSENGER STATISTICS
air traffic statistics
 June 23 air traffic statistics Prepared by the Office of Finance Department of Internal Controls, Compliance and Financial Strategy Metropolitan Washington Airports Authority Air Traffic Statistics Table
Monthly Airport Passenger Activity Summary. March2017
 T F Green Airport 04/17/17 Monthly Airport Passenger Activity Summary March2017 Calendar Year Basis Year Year March March Percent to Date to Date Percent 2017 2016 Change 2017 2016 Change Enplaned 152,513
Passenger and Cargo Statistics Report
 Passenger and Cargo Statistics Report Reno-Tahoe International Airport December 2014 U.S. DOMESTIC INDUSTRY OVERVIEW FOR DECEMBER 2014 All RNO Carriers Domestic Systemwide year over year comparison Average
Monthly Airport Passenger Activity Summary. Sep 2017
 T F Green Airport Monthly Airport Passenger Activity Summary Sep 2017 Calendar Year Basis Year Year Sep Sep Percent to Date to Date Percent 2017 2016 Change 2017 2016 Change Total Enplaned 161,165 151,982
Airline Industry Overview For the Regional Airline Association. December 8, 2010
 Airline Industry Overview For the Regional Airline Association December 8, 2010 Agenda The Airline Industry at Yearend 2010 Financial Recovery Return to Growth Consolidation Alliances Regional Service
Monthly Airport Passenger Activity Summary. February 2017
 T F Green Airport 03/24/17 Monthly Airport Passenger Activity Summary February 2017 Calendar Year Basis Year Year Febuary Febuary Percent to Date to Date Percent 2017 2016 Change 2017 2016 Change Enplaned
Monthly Airport Passenger Activity Summary. May 2017
 T F Green Airport Monthly Airport Passenger Activity Summary May 2017 Calendar Year Basis Year Year May May Percent to Date to Date Percent 2017 2016 Change 2017 2016 Change Enplaned 158,331 158,270 0.04%
Calendar Year Basis Year Year Apr Apr Percent to Date to Date Percent Change Change
 T F Green Airport Monthly Airport Passenger Activity Summary April 2018 Calendar Year Basis Year Year Apr Apr Percent to Date to Date Percent 2018 2017 Change 2018 2017 Change Total Enplaned 194,510 157,788
Monthly Airport Passenger Activity Summary
 T F Green Airport Monthly Airport Passenger Activity Summary January 2018 Calendar Year Basis Year Year Jan Jan Percent to Date to Date Percent 2018 2017 Change 2018 2017 Change Total Enplaned 148,452
Customer Complaints Spike at Lufthansa, Decrease at British Airways and Air France
 Customer Complaints Spike at Lufthansa, Decrease at British Airways and Air France Analysis of U.S. Department of Transportation complaint data shows that the German flag-carrier is moving in the opposite
Monthly Airport Passenger Activity Summary. Aug 2017
 T F Green Airport Monthly Airport Passenger Activity Summary Aug 2017 Calendar Year Basis Year Year Aug Aug Percent to Date to Date Percent 2017 2016 Change 2017 2016 Change Total Enplaned 190,676 169,667
Reno-Tahoe Airport Authority U.S. DOMESTIC INDUSTRY OVERVIEW FOR FEBRUARY
 Inter-Office Memo Reno-Tahoe Airport Authority Date: March 30, 2009 To: Statistics Recipients From: Krys T. Bart, A.A.E., President/CEO Subject: RENO-TAHOE INTERNATIONAL AIRPORT PASSENGER STATISTICS U.S.
LOUIS ARMSTRONG NEW ORLEANS INTERNATIONAL AIRPORT For the Period Ending September 30, Enplaned Passengers by Airline
 Domestic Scheduled Enplaned Passengers by Airline Alaska Airlines 7,070 4,331 63.2% 59,552 42,265 40.9% 1.2% 1.0% Virgin America 0 803-100.0% 12,231 803 1423.2% 0.3% 0.0% Allegiant Air 1,333 2,063-35.4%
RHODE ISLAND AIRPORT CORPORATION 07/16/08 T. F. GREEN AIRPORT
 RHODE ISLAND AIRPORT CORPORATION 7/16/8 T. F. GREEN AIRPORT JANUARY 25 TOTAL PASSENGERS UA 5% SP 7% January 2,5 Air Georgian Limited 1,6 Air Wisconsin American Airlines 2,561 American Eagle (Flagship)
Calendar Year Basis Year Year August August Percent to Date to Date Percent Change Change
 T F Green Airport Monthly Airport Passenger Activity Summary August 2018 Calendar Year Basis Year Year August August Percent to Date to Date Percent 2018 2017 Change 2018 2017 Change Total Enplaned 202,148
Monthly Airport Passenger Activity Summary. Jun 2017
 T F Green Airport Monthly Airport Passenger Activity Summary Jun 2017 Calendar Year Basis Year Year Jun Jun Percent to Date to Date Percent 2017 2016 Change 2017 2016 Change Enplaned 161,324 156,458 3.11%
Monthly Airport Passenger Activity Summary. October 2017
 T F Green Airport Monthly Airport Passenger Activity Summary October 2017 Calendar Year Basis Year Year Oct Oct Percent to Date to Date Percent 2017 2016 Change 2017 2016 Change Total Enplaned 196,345
U.S. DOMESTIC INDUSTRY OVERVIEW FOR MAY 2009
 Inter-Office Memo Reno-Tahoe Airport Authority Date: June 30, 2009 To: Statistics Recipients From: Krys T. Bart, A.A.E., President/CEO Subject: RENO-TAHOE INTERNATIONAL AIRPORT PASSENGER STATISTICS U.S.
May 2011 Passenger and Cargo Traffic Statistics Reno-Tahoe International Airport
 May 2011 Passenger and Cargo Traffic Statistics Reno-Tahoe International Airport July 5, 2011 U.S. DOMESTIC INDUSTRY OVERVIEW FOR MAY 2011 All RNO Carriers Systemwide year over year comparison Average
Monthly Airport Passenger Activity Summary
 T F Green Airport Monthly Airport Passenger Activity Summary December 2017 Calendar Year Basis Year Year Dec Dec Percent to Date to Date Percent 2017 2016 Change 2017 2016 Change Total Enplaned 175,889
Calendar Year Basis Year Year May May Percent to Date to Date Percent Change Change
 T F Green Airport Monthly Airport Passenger Activity Summary May 2018 Calendar Year Basis Year Year May May Percent to Date to Date Percent 2018 2017 Change 2018 2017 Change Total Enplaned 192,063 158,331
2017 Marketing and Communications Conference. November 6, 2017
 2017 Marketing and Communications Conference November 6, 2017 1 2 Introduction Carrie Kenrick State of the Industry Industry Consolidation Financial Trends Ancillary Product / Customer Segmentation Fleet
August 2014 Passenger and Cargo Traffic Statistics Reno-Tahoe International Airport
 August 2014 Passenger and Cargo Traffic Statistics Reno-Tahoe International Airport October 8, 2014 U.S. DOMESTIC INDUSTRY OVERVIEW FOR AUGUST 2014 All RNO Carriers Domestic Systemwide year over year comparison
May Air Traffic Statistics. Prepared by the Office of Corporate Risk and Strategy
 May 214 Air Traffic Statistics Prepared by the Office of Corporate Risk and Strategy Commercial Total Int'l Dom Air Traffic Summary May 214 Passenger Activity (in Millions) Current Month Year-to-Date Last
New Market Structure Realities
 New Market Structure Realities July 2003 Prepared by: Jon F. Ash, Managing Director 1800 K Street, NW Suite 1104 Washington, DC, 20006 www.ga2online.com The airline industry during the past two years has
Damon Hylton Vice President
 ACI-NA Commissioners Conference Air Service Development in a Tough Market Damon Hylton Vice President May 19, 2008 Today s Agenda Background Now What? Questions and Answers 2 Background 3 Current Industry
September 2013 Passenger and Cargo Traffic Statistics Reno-Tahoe International Airport
 September 2013 Passenger and Cargo Traffic Statistics Reno-Tahoe International Airport October 31, 2013 U.S. DOMESTIC INDUSTRY OVERVIEW FOR SEPTEMBER 2013 All RNO Carriers Systemwide year over year comparison
November 2013 Passenger and Cargo Traffic Statistics Reno-Tahoe International Airport
 November 2013 Passenger and Cargo Traffic Statistics Reno-Tahoe International Airport December 26, 2013 U.S. DOMESTIC INDUSTRY OVERVIEW FOR NOVEMBER 2013 All RNO Carriers Domestic Systemwide year over
October 2013 Passenger and Cargo Traffic Statistics Reno-Tahoe International Airport
 October 2013 Passenger and Cargo Traffic Statistics Reno-Tahoe International Airport December 4, 2013 U.S. DOMESTIC INDUSTRY OVERVIEW FOR OCTOBER 2013 All RNO Carriers Systemwide year over year comparison
air traffic statistics
 July 23 air traffic statistics Prepared by the Office of Finance Department of Internal Controls, Compliance and Financial Strategy Air Traffic Summary July 23 Below is a summary of the July 23 Air Traffic
Managing And Understand The Impact Of Of The Air Air Traffic System: United Airline s Perspective
 Managing And Understand The Impact Of Of The Air Air Traffic System: United Airline s Perspective NEXTOR NEXTOR Moving Moving Metrics: Metrics: A Performance-Oriented View View of of the the Aviation Aviation
December 2011 Passenger and Cargo Traffic Statistics Reno-Tahoe International Airport
 December 2011 Passenger and Cargo Traffic Statistics Reno-Tahoe International Airport January 27, 2012 U.S. DOMESTIC INDUSTRY OVERVIEW FOR DECEMBER 2011 All RNO Carriers Systemwide year over year comparison
June Air Traffic Statistics. Prepared by the Office of Corporate Risk and Strategy
 June 214 Air Traffic Statistics Prepared by the Office of Corporate Risk and Strategy Air Traffic Statistics Table of Contents Summary Air Traffic Summary... 1 SH&E Air Traffic Schedule Activity... 3 Passenger
Passenger and Cargo Statistics Report
 Passenger and Cargo Statistics Report RenoTahoe International Airport November 2017 U.S. DOMESTIC INDUSTRY OVERVIEW FOR NOVEMBER 2017 Systemwide RNO Carriers Domestic Flights year over year comparison
Sacramento International Airport Airline Passenger Statistics August 2013
 Sacramento International Airport Airline Passenger Statistics August 2013 CURRENT MONTH FISCAL YEAR TO DATE CALENDAR YEAR TO DATE THIS YEAR LAST YEAR % + / ( - ) 2013/14 2012/13 % + / ( - ) 2013 2012 %
U.S. DOMESTIC INDUSTRY OVERVIEW FOR OCTOBER 2010 All RNO Carriers Systemwide year over year comparison
 Inter-Office Memo Reno-Tahoe Airport Authority Date: November 22, 2010 To: Chairman and Board of Trustees From: Krys T. Bart, A.A.E., President/CEO Subject: RENO-TAHOE INTERNATIONAL AIRPORT OCTOBER 2010
The Conference Board Consumer Confidence Index decreased in July The Index now stands at 96.7 down from 97.4 in June.
 Interoffice Memo Date: August 31, 2016 To: Distribution From: Brian Baker Re: Air Traffic Statistics July 2016 Please review the attached report and return any comments or questions to Brian Baker. Reports
The Unfriendly Skies. Five Years of Airline Passenger Complaints to the Department of Transportation
 The Unfriendly Skies Five Years of Airline Passenger Complaints to the Department of Transportation The Unfriendly Skies Five Years of Airline Passenger Complaints to the Department of Transportation CALPIRG
Performance monitoring report for 2014/15
 Performance monitoring report for 20/15 Date of issue: August 2015 Gatwick Airport Limited Summary Gatwick Airport is performing well for passengers and airlines, and in many aspects is ahead of the performance
October Air Traffic Statistics. Prepared by the Office of Corporate Risk and Strategy
 October 214 Air Traffic Statistics Prepared by the Office of Corporate Risk and Strategy Metropolitan Washington Airports Authority Air Traffic Statistics Table of Contents Summary Air Traffic Summary...
LOUIS ARMSTRONG NEW ORLEANS INTERNATIONAL AIRPORT For the Period Ending August 31, Enplaned Passengers by Airline
 Enplaned Passengers by Airline Domestic Scheduled Alaska Airlines 3,797 4,077-6.9% 36,538 35,188 3.8% 1.0% 1.0% Allegiant Air 5,698 743 666.9% 41,738 14,843 181.2% 1.1% 0.4% American Airlines (US Air)
Perceptions of Industry Change: Decadal Comparative Analysis of Consumer Satisfaction
 Purdue University Purdue e-pubs Aviation Technology Faculty and Staff Publications School of Aviation and Transportation Technology 8-2-2012 Perceptions of Industry Change: Decadal Comparative Analysis
Sacramento International Airport Airline Passenger Statistics June 2010
 Sacramento International Airport Airline Passenger Statistics June 2010 CURRENT MONTH FISCAL YEAR TO DATE CALENDAR YEAR TO DATE THIS YEAR LAST YEAR % + / ( - ) 2009/10 2008/09 % + / ( - ) 2010 2009 % +
The Fall of Frequent Flier Mileage Values in the U.S. Market - Industry Analysis from IdeaWorks
 Issued: February 16, 2005 Contact: Jay Sorensen For inquiries: 414-961-1939 The Fall of Frequent Flier Mileage Values in the U.S. Market - Industry Analysis from IdeaWorks Mileage buying power is weakest
Passenger and Cargo Statistics Report
 Passenger and Cargo Statistics Report RenoTahoe International Airport September 2018 U.S. DOMESTIC INDUSTRY OVERVIEW FOR SEPTEMBER 2018 Systemwide RNO Carriers Domestic Flights year over year comparison
Passenger and Cargo Statistics Report
 Passenger and Cargo Statistics Report RenoTahoe International Airport January 2018 U.S. DOMESTIC INDUSTRY OVERVIEW FOR JANUARY 2018 Systemwide RNO Carriers Domestic Flights year over year comparison Average
Passenger and Cargo Statistics Report
 Passenger and Cargo Statistics Report RenoTahoe International Airport February 2018 U.S. DOMESTIC INDUSTRY OVERVIEW FOR FEBRUARY 2018 Systemwide RNO Carriers Domestic Flights year over year comparison
US AIRLINE COST AND PRODUCTIVITY CONVERGENCE: DATA ANALYSIS
 US AIRLINE COST AND PRODUCTIVITY CONVERGENCE: DATA ANALYSIS William S. Swelbar October 25, 2007 0 US AIRLINES: A Tale of Two Sectors US Network Legacy Carriers Mainline domestic capacity (ASMs) is almost
The Conference Board Consumer Confidence Index increased in August The Index now stands at up from 96.7 in July.
 Interoffice Memo Date: October 3, 2016 To: Distribution From: Brian Baker Re: Air Traffic Statistics August 2016 Please review the attached report and return any comments or questions to Brian Baker. Reports
Passenger and Cargo Statistics Report
 Passenger and Cargo Statistics Report RenoTahoe International Airport July 2018 U.S. DOMESTIC INDUSTRY OVERVIEW FOR JULY 2018 Systemwide RNO Carriers Domestic Flights year over year comparison Average
Passenger and Cargo Statistics Report
 Passenger and Cargo Statistics Report RenoTahoe International Airport June 2018 U.S. DOMESTIC INDUSTRY OVERVIEW FOR JUNE 2018 Systemwide RNO Carriers Domestic Flights year over year comparison Average
September Air Traffic Statistics. Prepared by the Office of Marketing & Consumer Strategy
 September 217 Air Traffic Statistics Prepared by the Office of Marketing & Consumer Strategy This report includes only data submitted by airlines as of the date of publication: November 15, 217. Reports
Passenger and Cargo Statistics Report
 Passenger and Cargo Statistics Report RenoTahoe International Airport April 2018 U.S. DOMESTIC INDUSTRY OVERVIEW FOR APRIL 2018 Systemwide RNO Carriers Domestic Flights year over year comparison Average
September Air Traffic Statistics. Prepared by the Office of Corporate Risk and Strategy
 September 214 Air Traffic Statistics Prepared by the Office of Corporate Risk and Strategy Air Traffic Summary September 214 Commercial Total Dom Int'l Passengers % Change Passenger Activity (in Millions)
Passenger and Cargo Statistics Report
 Passenger and Cargo Statistics Report RenoTahoe International Airport May 2018 U.S. DOMESTIC INDUSTRY OVERVIEW FOR MAY 2018 Systemwide RNO Carriers Domestic Flights year over year comparison Average Load
March 2014 Passenger and Cargo Traffic Statistics Reno-Tahoe International Airport
 March 2014 Passenger and Cargo Traffic Statistics Reno-Tahoe International Airport April 25, 2014 U.S. DOMESTIC INDUSTRY OVERVIEW FOR MARCH 2014 All RNO Carriers Domestic Systemwide year over year comparison
August Air Traffic Statistics. Prepared by the Office of Corporate Risk and Strategy
 August 215 Air Traffic Statistics Prepared by the Office of Corporate Risk and Strategy Metropolitan Washington Airports Authority Air Traffic Statistics Table of Contents Summary Air Traffic Summary...
Passenger and Cargo Statistics Report
 Passenger and Cargo Statistics Report Reno-Tahoe International Airport October 2018 U.S. DOMESTIC INDUSTRY OVERVIEW FOR OCTOBER 2018 Systemwide RNO Carriers Domestic Flights year over year comparison Average
Passenger and Cargo Statistics Report
 Passenger and Cargo Statistics Report RenoTahoe International Airport September 2017 U.S. DOMESTIC INDUSTRY OVERVIEW FOR SEPTEMBER 2017 Systemwide RNO Carriers Domestic Flights year over year comparison
Passenger and Cargo Statistics Report
 Passenger and Cargo Statistics Report RenoTahoe International Airport September 2015 U.S. DOMESTIC INDUSTRY OVERVIEW FOR SEPTEMBER 2015 All RNO Carriers Domestic Systemwide year over year comparison Average
DENVER INTERNATIONAL AIRPORT. TOTAL OPERATIONS AND TRAFFIC January 2012
 DENVER INTERNATIONAL AIRPORT TOTAL OPERATIONS AND TRAFFIC January 2012 January YEAR TO DATE % of % of % Grand % Grand Incr./ Incr./ Total Incr./ Incr./ Total 2012 2011 (9) Decr. Decr. 2012 2012 2011 (9)
Sacramento International Airport Airline Passenger Statistics December 2012
 Sacramento International Airport Airline Passenger Statistics December 2012 CURRENT MONTH FISCAL YEAR TO DATE CALENDAR YEAR TO DATE THIS YEAR LAST YEAR % + / ( - ) 2012/13 2011/12 % + / ( - ) 2012 2011
Passenger and Cargo Statistics Report
 Passenger and Cargo Statistics Report RenoTahoe International Airport August 2015 U.S. DOMESTIC INDUSTRY OVERVIEW FOR AUGUST 2015 All RNO Carriers Domestic Systemwide year over year comparison Average
December 2013 Passenger and Cargo Traffic Statistics Reno-Tahoe International Airport
 December 2013 Passenger and Cargo Traffic Statistics Reno-Tahoe International Airport January 24, 2014 U.S. DOMESTIC INDUSTRY OVERVIEW FOR DECEMBER 2013 All RNO Carriers Domestic Systemwide year over year
An Analysis of Airline Quality Rating Components Using Bayesian Methods
 International Journal of Aviation, Aeronautics, and Aerospace Volume 2 Issue 3 Article 4 8-1-2015 An Analysis of Airline Quality Rating Components Using Bayesian Methods John H. Mott Purdue University
February Air Traffic Statistics. Prepared by the Office of Corporate Risk and Strategy
 February 215 Air Traffic Statistics Prepared by the Office of Corporate Risk and Strategy Commercial Total Dom Int'l Passengers % Change Air Traffic Summary February 215 Passenger Activity (in Millions)
January 2018 Air Traffic Activity Summary
 January 2018 Air Traffic Activity Summary Jan-2018 Jan-2017 CY-2018 CY-2017 Passengers 528,947 505,421 4.7% 528,947 505,421 4.7% Passengers 537,332 515,787 4.2% 537,332 515,787 4.2% Passengers 1,066,279
December 2012 Passenger and Cargo Traffic Statistics Reno-Tahoe International Airport
 December 2012 Passenger and Cargo Traffic Statistics Reno-Tahoe International Airport January 29, 2013 U.S. DOMESTIC INDUSTRY OVERVIEW FOR DECEMBER 2012 All RNO Carriers Systemwide year over year comparison
US Aviation Regulatory Update: A Review of 2010, and Issues to Watch
 US Aviation Regulatory Update: A Review of 2010, and Issues to Watch Anita Mosner Partner, Holland & Knight LLP IATA Legal Symposium 14 February 2010 New Developments - 2010 Many new developments. Among
Performance monitoring report 2017/18
 Performance monitoring report /18 Gatwick Airport Limited 1. Introduction Date of issue: 20 July 2018 This report provides an update on performance at Gatwick in the financial year /18, ending 31 March
January 2014 Passenger and Cargo Traffic Statistics Reno-Tahoe International Airport
 January 2014 Passenger and Cargo Traffic Statistics Reno-Tahoe International Airport March 12, 2014 U.S. DOMESTIC INDUSTRY OVERVIEW FOR DECEMBER 2013 All RNO Carriers Domestic Systemwide year over year
July 2012 Passenger and Cargo Traffic Statistics Reno-Tahoe International Airport
 July 2012 Passenger and Cargo Traffic Statistics Reno-Tahoe International Airport August 31, 2012 U.S. DOMESTIC INDUSTRY OVERVIEW FOR JULY 2012 All RNO Carriers Systemwide year over year comparison Average
Customer Relations of Airlines
 Customer Relations of Airlines Written By: Ashley Schuetz Ashley Schuetz Schuetz 1 SP 405 Customer Relations of Airlines Abstract The airline companies have been struggling continually since September