CONTENTS 1. INTRODUCTION AND SUMMARY
|
|
|
- Regina Mariah Porter
- 6 years ago
- Views:
Transcription
1 In association with HNTB Corporation Alcantar & Associates, LLC Cephas, Inc. David Evans and Associates, Inc. DKS Associates NEXTOR Parametrix Synergy Consultants, Inc. Zimmer Gunsul Frasca Architects, LLP TECHNICAL MEMORANDUM NO. 3 FACILITY REQUIREMENTS MASTER PLAN UPDATE PORTLAND INTERNATIONAL AIRPORT Prepared for Port of Portland Portland, Oregon
2 TECHNICAL MEMORANDUM NO. 3 FACILITY REQUIREMENTS MASTER PLAN UPDATE PORTLAND INTERNATIONAL AIRPORT Prepared for Port of Portland Portland, Oregon Chicago Cincinnati Dallas London New Delhi Ottawa San Francisco Washington, D.C.
3 CONTENTS 1. INTRODUCTION AND SUMMARY Planning Activity Levels Summary of Requirements Process Sustainability AIRFIELD CAPACITY AND AIRCRAFT DELAY Background Existing Airfield Layout Current Constraints on Airfield Capacity Wind Coverage of Runway Use Configurations Operational Weather Category Descriptors Runway Uses and Weather Conditions Historical FAA Benchmark Capacities FAA Benchmark Capacities VMC FAA Benchmark Capacities MVMC and IMC Effect of Weather on Capacity Benchmarks FAA Benchmark Capacities with Planned Technological Improvements FAA Airport Arrival Rates and Airport Departure Rates Estimates of Annual Service Volume Comparison of Hourly Demand with Hourly Capacity Aircraft Delays Comparison of Previous FAA Aircraft Delay Estimates Aircraft Delay Estimates Using ASV Methodology Potential Effects of Future ATC and Aircraft Navigation Technology NextGen s Key Capabilities and Core Technologies Multiple RNP Approach Procedures RNP Parallel Approach Transition Potential Benefits of RNAV Standard Instrument Departures (SIDS) Conclusions and Recommendations i
4 CONTENTS (continued) 3. PASSENGER TERMINAL Background Aircraft Gates and Parking Airline Check-In Passenger Security Screening Holdrooms Checked Baggage Security Screening Outbound Baggage Makeup Inbound Baggage Handling Domestic Baggage Claim Federal Inspection Services Facilities Concessions GROUND TRANSPORTATION AND PARKING Key Assumptions Affecting Ground Transportation and Parking Requirements Access Roadways and Intersections Baseline Conditions Methodology Future Intersection Facility Requirements Future Roadway Facility Requirements Terminal Area Roadways Level-of-Service Goal Assessment of Future Activity and Requirements Curbside Roadways Level-of-Service Goal Enplaning Level Requirements Deplaning Level Requirements Commercial Vehicle Facilities Level-of-Service Goal Passenger Loading Requirements Transportation Providers Hold Lot Public Transit ii
5 CONTENTS (continued) 4.7 Public Parking Level-of-Service Goal Assessment of Future Activity and Requirements Cell Phone Lot Employee Parking Level-of-Service Goal Assessment of Future Activity and Requirements Rental Cars Pedestrian/Bicycle Facilities Other Key Intersections On or Near the Airport Baseline Conditions Methodology Future Intersection Facility Requirements Future Off-Airport Intersection Facility Requirements AIR CARGO Processing and Warehouse Space Ramp Area Landside Area Cargo Land Area Summary GENERAL AVIATION Background Current Situation Approach to Determining GA Requirements Potential General Aviation Minimum Commercial Aeronautical Activity Standards Fixed Base Operator Facilities at Other Airports Requirements for Future General Aviation Facilities MILITARY iii
6 CONTENTS (continued) 8. AIRLINE SUPPORT Airline Maintenance and Support Deicing Facilities and Glycol Storage Fuel Storage Flight Kitchen Triturator AIRPORT SUPPORT Aircraft Rescue and Fire Fighting Facilities FAA Facilities Airport Maintenance Facilities Airport Administration Central Utility Plant CUP Heating CUP Cooling CUP Emergency Power SECURITY Background and Summary Passenger Security Screening Baseline Major Regulatory Changes Expected Required Planning Checked Baggage Screening Baseline Major Regulatory Changes Expected Required Planning Access Control and Credentials Baseline Major Regulatory Changes Expected Risk Mitigation and Required Planning Air Cargo Baseline Major Regulatory Changes Expected Required Planning iv
7 CONTENTS (continued) 10.6 General Aviation Baseline Major Regulatory Changes Expected Required Planning Other UTILITIES AND PAVEMENT Utilities Water Wastewater/Sewer Natural Gas System Electrical System Pavement v
8 TABLES 1-1 Aviation Demand Forecasts Facilities Requirements Summary Runway Use and Weather Conditions Summary of FAA 2004 Capacity Benchmarks Airport Arrival Rates and Airport Departure Rates Summary of Previous Estimates of Annual Airfield Capacity Estimates of Average Annual Aircraft Delay Corresponding to Forecast Demand Levels Summary of Passenger Terminal Facilities Requirements Holdroom Areas Required by Aircraft Type Holdroom Areas Provided Historical Airline Passenger Mode Choice Data LOS Criteria for Signalized and Unsignalized Intersections Summary of Existing (2007) Afternoon Peak Period Operating Conditions at Key Study Area Intersections Summary of Capacity and Requirements Analysis NE 82nd Avenue/NE Airport Way Summary of Capacity and Requirements Analysis Mt. Hood Interchange Area Summary of Capacity and Requirements Analysis NE Airport Way/I-205 Interchange Area Summary of Capacity and Requirements Analysis NE 82nd Avenue/NE Alderwood Road Intersection Summary of Weaving Operational Analysis NE Airport Way, Eastbound and Westbound Level of Service Assumptions Terminal Area Roadways vi
9 TABLES (continued) 4-10 Terminal Area Roadway Requirements Level of Service Assumptions, Curbside Loading and Unloading Areas Level of Service Assumptions, Curbside Travel Lanes Enplaning Level Curbside Unloading Area Requirements Enplaning Level Curbside Travel Lane Requirements Deplaning Level Curbside Loading Area Requirements Deplaning Level Curbside Travel Lane Requirements Commercial Vehicle Area Transportation Providers Hold Lot Requirements Public Parking Requirements Employee Parking Requirements Rental Car Facilities Requirements Reconciliation of Rental Car Requirements with Previous Estimates by CH2M HILL and the John F. Brown Company Summary of Existing (2007) Afternoon Peak Hour Operating Conditions at Other Study Area Intersections Summary of Capacity and Requirements Analysis NE Alderwood Road/NE Cornfoot Road Intersection Summary of Capacity and Requirements Analysis NE Airtrans Way/NE Cornfoot Road Intersection Total Air Cargo Forecast Air Cargo Building Sizes and Utilization Rates Peer Airport Cargo Building Utilization Rates Cargo Processing and Warehouse Space Facility Requirements vii
10 TABLES (continued) 5-5 Cargo Ramp Requirements Cargo Landside Requirements Cargo Land Area Requirements FBO Area Comparison Airline Maintenance and Support Facility and Ramp Areas Historical Fuel and Aircraft Operations Data Projected ADPM Airline Jet Fuel Demand and Gross Storage Required to Provide 3-, 5-, 7-, and 10-Day Reserves Projected Fuel Farm Storage Requirements ARFF Index Classifications Electrical Load Allowances for Estimating Power Requirements Associated with Facilities Expansion Electrical Load Allowances for Estimating Power Requirements for Additional Aircraft Gates Electrical Load Allowances for Estimating Power Requirements Associated with Central Utility Plant Expansion viii
11 FIGURES 1-1 Capacity Assessment of Selected Passenger and Cargo Facilities Vision and Values Existing Airfield Layout Major Runway Use Configurations at FAA Capacity Benchmark for in VMC FAA Capacity Benchmarks for in MVMC and IMC Ranges of 2004 Airport Capacity Benchmarks for Top 35 U.S. Airports Estimates of ASV Using Capacities from Previous FAA Capacity Studies Rolling Hourly Counts of Aviation Activity from Anoms Data, August 10, Summary of Aircraft Delay Curves from Previous FAA Capacity Enhancement Plans and Estimates Using ASV Methodology Aircraft Delay Curves from FAA AC 150/5060-5, Airport Capacity and Delay Comparison of RNAV and RNP Flight Procedures with Current Flight Procedures Potential Reduction in Required Spacing for Conducting Simultaneous Independent Instrument Landings Simultaneous RNP Parallel Approach Transition and ILS Procedures Radar Flight Tracks Before and After RNAV Standard Instrument Departures ix
12 FIGURES (continued) 3-1 Sensitivity of Aircraft Gates Required to Productivity in Daily Turns Per Gate Queuing and Circulation Areas Assumed for Requirements Analysis Baggage and Circulation Areas Assumed for Requirements Analysis Terminal Access Intersections and Roadways Daily Vehicle Volume Profile: NE Airport Way, West of Interstate 205, Typical Busy Day in Daily Vehicle Volume Profile: NE 82nd Avenue, South of NE Airport Way, Typical Busy Day in Roadway Link Locations Other Study Area Intersections Cargo Areas Cargo Warehouse Area vs. Cargo Volume at Select North American Airports Planned Peer Airport Cargo Building Utilization Rates PDX Deicing System Proposed Deicing System Enhancements Projected Jet Fuel Storage Requirements Illustration of Checkpoint Evolution Concept x
13 1. INTRODUCTION AND SUMMARY This Technical Memorandum summarizes the facilities and associated land areas required to accommodate future aviation demand at the Airport, as presented in Technical Memorandum No. 2 Aviation Demand Forecasts, dated September Facility requirements were developed for the airfield (runways, taxiways, and navigational aids), the passenger terminal complex, ground transportation and parking, air cargo, general aviation, military, airline support, Airport support and administration, security, and utilities, building maintenance, and pavements. 1.1 Planning Activity Levels Recognizing the uncertainties associated with long-range aviation demand forecasting, five planning activity levels (PALs) were identified to represent future levels of activity at which key Airport improvements will be necessary. Because, for any number of reasons, activity levels could occur at different periods from those anticipated when the forecasts were prepared, the use of PALs allows for facilities planning that is realistically tied to milestone activity levels as they occur, rather than arbitrary years. PAL 1, PAL 2, PAL 3, PAL 4, and PAL 5 correspond to the 50th percentile aviation demand forecasts for 2012, 2017, 2022, 2027, and 2035, respectively. The aviation demand associated with each PAL is summarized in Table 1-1. Table 1-1 AVIATION DEMAND FORECASTS Aviation Demand Forecasts (a) Actual PAL 1 PAL 2 PAL 3 PAL 4 PAL Enplaned passengers (thousands) 7,332 7,489 8,992 10,312 11,825 13,393 Total air cargo (thousands of short tons) (b) Aircraft operations Passenger airline 191, , , , , ,000 All-cargo airline 33,324 37,980 41,240 44,840 48,760 52,320 General aviation 27,623 26,100 28,200 29,500 30,900 32,500 Military 3,707 6,000 6,000 6,000 6,000 6,000 Other (c) 8,310 8,000 9,100 10,100 11,100 12,000 Total Airport aircraft operations 264, , , , , ,820 (a) Forecasts are shown for PALs and their corresponding years. (b) A short ton equals 2,000 pounds. (c) Includes nonscheduled and empty flights. Sources: Actual 2007 demand from Port of Portland records. Forecast demand from Jacobs Consultancy, Technical Memorandum No. 2 Aviation Demand Forecasts, September
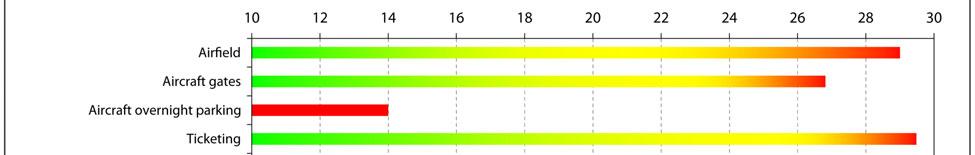
14 1.2 Summary of Requirements The most significant findings of the analyses to determine facilities requirements for the planning period (i.e., through 2035) were that (1) a third parallel runway will not be required during the planning period, and (2) terminal and ground access requirements can continue to be satisfied within the existing terminal envelope. Continued Airport development within the planning period will be required; however, it will not be necessary to implement a new Airport development concept (e.g., the centralized or decentralized development concept) as envisioned at the conclusion of the 2000 Master Plan. The capacities of the Airport s key functional areas are summarized on Figure 1-1, which can be interpreted as follows: The bars represent major Airport elements; the length of the bars indicates capacity. Capacity for all Airport elements except the cargo ramp and cargo warehouse (the two bottom bars) should be read relative to the scale at the top of the figure total annual passengers (in millions). Capacity for the cargo ramp and cargo warehouse should be read relative to the scale at the bottom of the figure total annual air cargo tons (thousands). Both capacity scales are indexed to the timeframes and corresponding PALs envisioned by the forecasts, shown by the dotted vertical lines. Some of the capacities of the elements shown on Figure 1-1 are necessarily based on a number of simplifying assumptions (e.g., the bars labeled access roadways represent a number of intersections and roadway segments). The detailed requirements are summarized in Table 1-2 for all functional elements of the Airport that were assessed and are discussed in Sections 2 through 11 of this Technical Memorandum. As shown in Table 1-2, some Airport facilities (e.g., gates) provide sufficient capacity to accommodate forecast demand throughout the planning period. However, a number of facilities will need to be modified or expanded during the planning period to accommodate forecast demand at the desired level of service. 1-2

15 1-3
16 Table 1-2 FACILITIES REQUIREMENTS SUMMARY PAL Estimated total requirements PAL PAL PAL PAL PAL Estimated surplus (deficiency) compared with existing PAL PAL PAL PAL PAL Period-over-period (i.e., incremental) requirement PAL PAL PAL BASIS FOR REQUIREMENTS (DEMAND FORECASTS) Total annual passengers (millions) n/a n/a n/a n/a n/a n/a n/a n/a n/a n/a Cargo in belly of psngr acft (thousands of short tons) Cargo in all-cargo acft (thousands of short tons) n/a n/a n/a n/a n/a n/a n/a n/a n/a n/a Aircraft operations (thousands) n/a n/a n/a n/a n/a n/a n/a n/a n/a n/a AIRFIELD Number of runways Critical aircraft Functional Element Existing 2 parallels plus crosswind B (ARC D-V) 2 parallels plus crosswind B (ARC D-V) 2 parallels plus crosswind B (ARC D-V) 2 parallels plus crosswind B (ARC D-V) 2 parallels plus crosswind B (ARC D-V) Runway length (feet) Runway 10L-28R 9,827 9,827 9,827 9,827 9, Runway 10R-28L 11,000 11,000 11,000 11,000 11, Runway ,000 6,000 6,000 6,000 6, Instrument approach capability CAT III CAT III CAT III CAT III CAT III PASSENGER TERMINAL COMPLEX Aircraft gates and parking Domestic gates Widebody Narrowbody - ADG IV (e.g., B ) Narrowbody - ADG III (e.g., B ) (19) (14) (12) (18) (17) Regional jet / turboprop Total domestic gates FIS gates Widebody (1) Narrowbody - ADG IV (e.g., B ) Narrowbody - ADG III (e.g., B ) (1) (2) (1) (2) (1) Regional jet / turboprop Total FIS gates (1) (2) (2) Total domestic + FIS gates Widebody Narrowbody - ADG IV (e.g., B ) Narrowbody - ADG III (e.g., B ) (20) (16) (13) (20) (18) Regional jet / turboprop Total domestic + FIS gates (1) Remote / RON parking Widebody Narrowbody - ADG IV (e.g., B ) Narrowbody - ADG III (e.g., B ) (7) (12) (15) (25) (24) Regional jet / turboprop (1) (1) (1) - (1) Total Remote / RON parking (4) (6) (10) (17) (23) Holdrooms (area in square feet) Concourse A 6,004 9,953 9,953 11,076 10,417 10,766 (3,949) (3,949) (5,072) (4,413) (4,762) 3,949-1, Concourse B 4,701 4,182 4,308 4,308 2,914 2, ,787 2, Concourse C 40,267 24,407 29,316 28,464 30,748 31,629 15,860 10,951 11,803 9,519 8, Concourse D 26,117 27,341 31,930 34,321 37,129 36,838 (1,224) (5,813) (8,204) (11,012) (10,721) 1,224 4,589 2,391 2,808 - Concourse E 11,212 10,611 9,914 9,759 8,868 8, ,298 1,453 2,344 2, Total holdroom area 88,301 76,494 85,421 87,928 90,076 90,850 11,807 2, (1,775) (2,549) , PAL
17 Table 1-2 FACILITIES REQUIREMENTS SUMMARY Functional Element Existing PAL Estimated total requirements PAL PAL PAL PAL PAL Estimated surplus (deficiency) compared with existing PAL PAL PAL PAL PAL Period-over-period (i.e., incremental) requirement PAL PAL PAL BASIS FOR REQUIREMENTS (DEMAND FORECASTS) Total annual passengers (millions) n/a n/a n/a n/a n/a n/a n/a n/a n/a n/a Cargo in belly of psngr acft (thousands of short tons) Cargo in all-cargo acft (thousands of short tons) n/a n/a n/a n/a n/a n/a n/a n/a n/a n/a Aircraft operations (thousands) n/a n/a n/a n/a n/a n/a n/a n/a n/a n/a Airline Check-in Number of processors Agent counters Kiosks w/bag check Kiosks w/out bag check (1) - (2) (5) (9) Curbside Total Lobby queue area (square feet) IATA level of service B 13,565 11,296 12,944 14,528 14,832 16,704 2, (963) (1,267) (3,139) IATA level of service C 13,565 9,884 11,326 12,712 12,978 14,616 3,681 2, (1,051) Passenger Security Screening Number of screening lanes South (1) (1) (2) (5) North Total (2) (5) Queue area (square feet) Document IATA level of service B South 1,660 1,170 3,458 3,692 3,536 4, (1,798) (2,032) (1,876) (2,942) - 1, North 1,504 1,118 2,301 2,301 2,470 2, (797) (797) (966) (1,200) Total 3,164 2,288 5,759 5,993 6,006 7, (2,595) (2,829) (2,842) (4,142) - 2, IATA level of service C South 1, ,926 3,124 2,992 3, (1,266) (1,464) (1,332) (2,234) - 1, North 1, ,947 1,947 2,090 2, (443) (443) (586) (784) Total 3,164 1,936 4,873 5,071 5,082 6,182 1,228 (1,709) (1,907) (1,918) (3,018) - 1, ,100 Primary IATA level of service B South 2,003 2,860 3,367 4,082 4,082 4,953 (857) (1,364) (2,079) (2,079) (2,950) North 2,044 2,223 2,288 2,483 2,951 3,250 (179) (244) (439) (907) (1,206) Total 4,047 5,083 5,655 6,565 7,033 8,203 (1,036) (1,608) (2,518) (2,986) (4,156) 1, IATA level of service C South 2,003 2,420 2,849 3,454 3,454 4,191 (417) (846) (1,451) (1,451) (2,188) North 2,044 1,881 1,936 2,101 2,497 2, (57) (453) (706) Total 4,047 4,301 4,785 5,555 5,951 6,941 (254) (738) (1,508) (1,904) (2,894) Baggage Security Screening Number of primary EDS machines South North Total Outbound Baggage Makeup Number of cart staging positions South (1) (8) (17) North (4) (5) Total (12) (22) Inbound Baggage Handling Total offload frontage (linear feet) (23) (51) Baggage Claim -- Domestic Total presentation frontage (linear feet) 1,653 1,094 1,262 1,417 1,539 1, Total area for claiming baggage (square feet) 32,812 16,529 19,067 21,411 23,250 24,702 16,283 13,745 11,401 9,562 8, PAL
18 Table 1-2 FACILITIES REQUIREMENTS SUMMARY Functional Element Existing PAL Estimated total requirements PAL PAL PAL PAL PAL Estimated surplus (deficiency) compared with existing PAL PAL PAL PAL PAL Period-over-period (i.e., incremental) requirement PAL PAL PAL BASIS FOR REQUIREMENTS (DEMAND FORECASTS) Total annual passengers (millions) n/a n/a n/a n/a n/a n/a n/a n/a n/a n/a Cargo in belly of psngr acft (thousands of short tons) Cargo in all-cargo acft (thousands of short tons) n/a n/a n/a n/a n/a n/a n/a n/a n/a n/a Aircraft operations (thousands) n/a n/a n/a n/a n/a n/a n/a n/a n/a n/a FIS Facilities Primary processing Number of primary screening modules (1) (1) (1) (1) Primary queuing area (square feet) 5,037 4,313 6,038 6,038 6,038 6, (1,001) (1,001) (1,001) (1,001) - 1, Baggage Claim Per device Presentation frontage (linear feet) (65) (65) (65) (65) (65) Retrieval & peripheral area (square feet) 2,525 2,972 2,972 2,972 2,972 2,972 (447) (447) (447) (447) (447) Total Number of devices (1) (1) (1) (1) Presentation frontage (linear feet) (130) (340) (340) (340) (340) Retrieval & peripheral area (square feet) 5,800 5,945 8,917 8,917 8,917 8,917 (145) (3,117) (3,117) (3,117) (3,117) 145 2, Secondary processing Queuing area (square feet) (105) (331) (331) (331) (331) Referral waiting area (square feet) 1, Exam podiums w/ belts (units) X-ray workstations (units) Baggage security screening Number of primary EDS machines (2) (3) (3) (3) (3) Passenger security screening Number of screening lanes GROUND TRANSPORTATION AND PARKING Public parking (spaces) Close-in parking 7,380 5,120 6,540 7,760 9,000 10,540 2, (380) (1,620) (3,160) Remote parking 7,788 8,260 10,540 12,510 14,510 17,000 (472) (2,752) (4,722) (6,722) (9,212) Subtotal 15,168 13,380 17,080 20,270 23,510 27,540 1,788 (1,912) (5,102) (8,342) (12,372) - 1,912 3,190 3,240 4,030 Holiday / overflow ,150 1,350 (650) (840) (990) (1,150) (1,350) Requirements currently accommodated off-airport 1,300 1,400 1,800 2,100 2,500 2,900 (100) (500) (800) (1,200) (1,600) Total, including holiday/overflow and off-airport 16,468 15,430 19,720 23,360 27,160 31,790 2,826 (5,164) (11,994) (19,034) (27,694) Employee parking (spaces) 2,544 1,900 2,200 2,500 2,800 3, (256) (556) Curbside loading & unloading (linear feet) Enplaning curbside ,080 1, (31) (151) (271) Deplaning curbside (20) (100) (150) (230) Subtotal 1,429 1,160 1,360 1,560 1,730 1, (131) (301) (501) Curbside roadway (lanes) Enplaning curbside (1) (2) Deplaning curbside (1) (1) (1) Commercial vehicle facilities Loading area (linear feet) 1, , Hold / staging facility (acres) (0.0) (0.2) (0.3) (0.5) (0.7) Rental car facilities Ready / return parking (spaces) 1, ,090 1,250 2,390 2, (909) (1,219) Service facilities (acres) (4.5) (5.5) (8.1) (6.1) (7.2) Roadways NE Airport Way, westbound (link ID A--Fig 4-4) (1) (1) (1) NE Airport Way, eastbound (link ID B--Fig 4-4) (1) (1) Parking entrance (link ID C--Fig 4-4) (1) (1) Enplaning level approach (link ID D--Fig 4-4) (1) (1) (1) Deplaning level approach (link ID E--Fig 4-4) Enplaning level departure (link ID F--Fig 4-4) (1) (1) (1) (2) (2) Deplaning level departure (link ID G--Fig 4-4) (1) (1) Parking exit (link ID H--Fig 4-4) (1) (1) Terminal exit (link ID I--Fig 4-4) (1) (1) (1) (2) (2) Return-to-terminal road (link ID J--Fig 4-4) (1) (1) Terminal area exit (link ID K--Fig 4-4) (1) (1) (2) (2) PAL
19 Table 1-2 FACILITIES REQUIREMENTS SUMMARY Functional Element Existing PAL Estimated total requirements PAL PAL PAL PAL PAL Estimated surplus (deficiency) compared with existing PAL PAL PAL PAL PAL Period-over-period (i.e., incremental) requirement PAL PAL PAL BASIS FOR REQUIREMENTS (DEMAND FORECASTS) Total annual passengers (millions) n/a n/a n/a n/a n/a n/a n/a n/a n/a n/a Cargo in belly of psngr acft (thousands of short tons) Cargo in all-cargo acft (thousands of short tons) n/a n/a n/a n/a n/a n/a n/a n/a n/a n/a Aircraft operations (thousands) n/a n/a n/a n/a n/a n/a n/a n/a n/a n/a Key intersections NE 82nd Ave/NE Airport Way - grade separated interchange grade separated interchange - - PAL grade separated interchange Mt. Hood interchange area (3 intersections) NE Airport Way/I-205 interchange I-205 Southbound e'bound to I-205 Northbound n'bound solution NE 82nd Avenue/NE Alderwood Road NE Alderwood Road/NE Cornfoot Road n'bound lt turn pocket e'bound rt turn pocket e'bound to n'bound solution e'bound to n'bound solution e'bound rt e'bound rt turn turn pocket pocket n'bound lt n'bound lt turn - - turn pocket - - pocket - - NE Airtrans Way/NE Cornfoot Road signalized signalized signalized intersection intersection intersection NE Columbia Boulevard/NE 82nd Avenue (2 intersections) - NE Killingsworth St./I-205 interchange area (2 intersections) - AIR CARGO Belly Cargo Warehouse space (square feet) 236,000 54,000 60,000 69,000 78,000 93, , , , , , Ramp (square yards) 67,000 4,000 4,000 5,000 6,000 7,000 63,000 63,000 62,000 61,000 60, Landside area (square feet) - 54,000 60,000 69,000 78,000 93, Total area (acres) All Cargo Warehouse space (square feet) 392, , , , ,000 1,005,000 (40,000) (169,000) (283,000) (421,000) (613,000) 40, , , , ,000 Ramp (square yards) 189, , , , , ,000 (51,000) (123,000) (186,000) (263,000) (369,000) 51,000 72,000 63,000 77, ,000 Landside area (square feet) - 432, , , ,000 1,005,000 (432,000) (561,000) (675,000) (813,000) (1,005,000) 432, , , , ,000 Total area (acres) GENERAL AVIATION Total area (acres) MILITARY Total area (acres) AIRLINE SUPPORT Fuel storage Quantity (millions of gallons) 3,360 3,109 3,534 3,884 4,262 4, (174) (524) (902) (1,300) Land area (acres) (0) (1) (1) (2) Airline maintenance and support (square feet) In-flight catering facilities (acres) AIRPORT SUPPORT Aircraft rescue and fire fighting (acres) (3) (3) (3) (3) (3) Airport maintenance (acres) (2) (2) (2) (2) (2) ADG = Airplane design group EDS = Explosives detection system IATA = International Air Transport Association ARC = Airplane reference code FIS = Federal Inspection Services n/a = Not applicable CAT = Category RON = Remain overnight a. Passenger terminal complex requirements were determined based primarily on simulation modeling using flight schedules for 2008, 2017, 2022, 2027 and A flight schedule was not developed for 2012 because the activity is forecast so be very similar to activity in Accordingly, requirements for the passenger terminal complex in 2012 were assumed to equal the requirements for Sources: Jacobs Consultancy, DKS Associates, and HNTB Corporation; October 2008.
20 1.3 Process The process of developing facility requirements involved not only the consultant team, but also Port staff, City staff, the airlines, the planning subcommittee, and the Planning Advisory Group (PAG). At the beginning of preparing the requirements element of the Master Plan Update, focus groups, consisting of Port and City staff, were formed for every functional element of the Airport to be analyzed. The consultant team met with each focus group to discuss the scope and proposed approach for the analyses and to learn about particular issues. These meetings occurred the week of June 9, The focus groups, City staff, the airlines, and the planning subcommittee were briefed on the preliminary results of the requirements analysis and provided comments to the consultant team the week of September 8, The PAG was briefed and provided comments to the consultant team the week of September 15, Written descriptions of the analyses, results, and conclusions related to requirements for each functional area of the Airport were distributed to the focus groups in September and October Follow-up meetings and telephone conferences were held with the focus groups to receive verbal comments on the written descriptions; Port planning staff provided written comments. The planning subcommittee was briefed on the final results of the requirements analyses and provided comments the week of October 6, The PAG was briefed and provided comments the week of October 20, Many valuable comments were received from the focus groups and, to the extent possible, those comments are reflected in the analyses and results reported in this Technical Memorandum. To the extent that some issues raised are outside the scope of the, every attempt was made to record the issues so that they may be addressed in subsequent studies as appropriate. 1.4 Sustainability Consistent with our commitment to Airport Futures Vision and Values, shown on Figure 1-2, the planning team has carefully considered sustainability in determining the facility requirements for each functional area of the Airport. The application of new technologies, changes in passenger behavior, and changes in the airline industry are among the many uncertain factors that will influence the capacity, design, use, and reuse of the Airport s facilities in the future. While the impact of these factors cannot be known with certainty, we embrace the notion, discussed at numerous PAG and PAG 1-8

21 Figure 1-2 VISION AND VALUES Source: Port of Portland. PDX610 F
22 Subcommittee meetings, that future changes have the potential to significantly increase the utilization of existing facilities and the efficiency of operations, thus extending the life of Airport facilities and ultimately postponing the development of new facilities. The facility requirements presented in this Technical Memorandum are based on aviation demand forecasts that were highly influenced by a collaborative discussion of sustainability. That discussion was directly reflected in the forecast process by choosing a probabilistic rather than traditional approach to forecasting and by carefully considering the potential impact of future oil prices and future carbon emissions costs. While the probabilistic forecasts of passengers, cargo, and aircraft operations define a wide range of potential future demand, it is important to understand that the facility requirements are based on the 50th percentile forecasts recommended by PAG. We have devoted significant effort to identifying pending technological innovations or procedural changes that promise significant capacity increases. An example is the future air traffic control system and navigation technologies being studied by the FAA. Although these technologies will require major investments by the FAA and airlines and the timing is uncertain, it is believed that they can provide significant capacity increases for the existing airfield and also may enable the development of new noise abatement departure procedures. In other functional areas of the Airport, such as aircraft gates, we were able assume a 40 percent increase in gate utilization based on current industry trends (e.g., common use facilities) and input from airline representatives. The result of increased gate utilization, when combined with the continued trend toward larger aircraft, is a significant reduction in the number of gates required to meet future demand. Similar opportunities to utilize emerging technologies and creative approaches to planning and operations to extend the life of existing facilities are described throughout this Technical Memorandum. In some areas, such as ground transportation and parking, we have taken a more conservative approach to assessing facility requirements by modeling needs based on today s use characteristics. Explained in greater detail in Section 4, we assumed no significant changes in passenger mode choice and that the demand for all travel modes will increase in direct proportion to growth in passenger activity. We acknowledge that mode choices may change as passengers adapt to changes in the regional transportation system (e.g., new or expanded mode choices, changes in pricing, and the elimination of services) and that such changes could have the effect of reducing demand for parking, terminal curb or access roadways. Our approach is intended to simplify our assessment of ground transportation needs and provide a valid baseline for considering alternative approaches to meeting forecast demand. In later studies, we will be able to test the sensitivity of facilities required to specific ground transportation assumptions such as a reduced level of service (LOS) standard, reduced pick-up/dropoff capability, elimination of at-grade pedestrian crossings of the terminal roadway, reduced parking supply or changes in the use of the terminal roadway system. 1-10
23 2. AIRFIELD CAPACITY AND AIRCRAFT DELAY The capacity of the existing airfield and airspace system was assessed to determine if and when additional airfield capacity improvements will be required to meet aviation demand forecast through the planning period (2035). These assessments were primarily based on reports prepared for or by the Federal Aviation Administration (FAA) and the Port of Portland, as follows: October 1996: Federal Aviation Administration, Capacity Enhancement Plan (CEP) March 1997: P&D Aviation, Technical Memorandum 4, Airport Facility Requirements (prepared for the Port based on the October 1996 CEP) October 2001: Federal Aviation Administration, Capacity Enhancement Plan September 2004: Federal Aviation Administration, Airport Capacity Benchmark Report 2004 October 2004: Federal Aviation Administration, Airport Capacity Enhancement Plan, Phase II Terminal Option Study Jacobs Consultancy has reviewed these reports and determined the following: The studies were conducted using different models. The CEP described in the October 1996 report was prepared using the FAA's Airport and Airspace Simulation Model (SIMMOD). The study reported on in March 1997 was based on data from the October 1996 study. The CEPs reported on in October 2001 and October 2004 were conducted using the FAA's Airfield Delay Simulation Model (ADSIM). The benchmarking effort reported in the Airport Capacity Benchmark Report 2004 was conducted using the FAA Airfield Capacity Model (ACM). Some results from the studies are inconsistent; no explanations for the inconsistencies were presented; the inconsistencies are assumed to have resulted from the use of different models. The most current report, from October 2004 (Airport Capacity Enhancement Plan, Phase II Terminal Option Study), does not contain an estimate of annual capacity for the airfield, which is essential for assessing when additional capacity enhancement improvements will be required. Instead, the report presents hourly arrival and departure capacities for different weather conditions. 2-1
24 Our approach to estimating the annual capacity of the airfield was based on the hourly capacities for the Airport contained in Airport Capacity Benchmark Report 2004 and the FAA s annual service volume (ASV) methodology documented in FAA Advisory Circular (AC) 150/5060-5, Airport Capacity and Delay. The information necessary to understand this approach and its validity is presented below, along with the results of the analyses and our conclusions. The information is organized in seven subsections, as follows: Background Summarizes the existing layout of the airfield and its capacity constraints, explains how the runways are used in different wind conditions, and defines different weather categories in terms of ceiling and visibility conditions that govern how FAA air traffic controllers manage aircraft landings and takeoffs at the Airport. FAA Benchmark Capacities Summarizes the hourly capacities presented in the September 2004 report; these capacities, along with assumptions related to runway use and the occurrence of different weather conditions, are key inputs to the ASV methodology used to estimate the current annual capacity of the Airport s airfield. Estimates of Annual Service Volume Explains that ASV is one measure of annual capacity, defines ASV and how it is calculated, describes the FAA s ASV methodology for estimating aircraft delays, and compares the ASV with annual airfield capacity estimates from the previous studies. Comparison of Hourly Demand with Hourly Capacity Summarizes the relationship between current hourly operations and hourly runway capacity. Aircraft Delays Explains the aircraft delay curve, which is a fundamental assessment tool in airfield modeling; compares the delay curves developed in the previous studies with a delay curve developed by Jacobs Consultancy using the ASV method and hourly capacity estimates from the September 2004 report; and demonstrates that the delay curve developed by Jacobs Consultancy is consistent with the delay curve developed by the FAA in the 2001 CEP and, therefore, is a rational basis for further analyses, conclusions, and recommendations. Potential Effects of Future Air Traffic Control (ATC) and Aircraft Navigation Technology Introduces the key capabilities, core technologies, and potential benefits of the next generation (NextGen) air transportation system envisioned by the FAA. Conclusions and Recommendations Summarizes the conclusions and recommendations of this airfield and airspace capacity assessment regarding the need for additional airfield capacity improvements at the Airport to meet aviation demand forecast through
25 2.1 Background Existing Airfield Layout has three runways: Runway 10L-28R (8,000 feet long), also referred to as the north parallel runway (extensions to Runway 10L-28R currently being designed will result in a total runway length of 9,827 feet; the runway will be extended 1,290 feet to the west and 537 feet to the east) Runway 10R-28L (11,000 feet long), also referred to as the south parallel runway Runway 3-21 (7,000 feet long), also referred to as the crosswind runway (as part of the project to extend Runway 10L-28R, Runway 3-21 will be shortened to 6,020 feet by removing the northernmost 980 feet of runway pavement) Figure 2-1 EXISTING AIRFIELD LAYOUT 2-3
26 2.1.2 Current Constraints on Airfield Capacity The airfield capacity at is limited by the following two major constraints: 1. The 3,100-foot spacing between the two parallel runways does not permit simultaneous independent instrument approaches. 2. The existing noise-abatement departure procedures require departures from both parallel runways to fly over a common fix in both east flow (Runways 10R and 10L) and west flow (Runways 28L and 28R). The first major capacity constraint could be solved by either (1) waiting to see if certain future navigation and ATC technologies would enable simultaneous independent judgment approaches to parallel runways spaced as close as 3,100 feet apart, or (2) increasing the spacing between the parallel runways to 3,400 feet (which would require a precision runway monitor [PRM]) or 4,300 feet. Later in Section 2.6 of this Technical Memorandum, future navigation and ATC technologies and their prospects for providing such capability are discussed. The existing departure capacity constraints limit the ability of controllers to conduct simultaneous independent departures on the parallel runways, even though there is sufficient spacing between the two parallel runways (2,500 feet is required) for conducting such operations. The existing procedures do not allow controllers to provide the 15-degree divergent headings between jet aircraft after takeoff that are required for conducting independent departures. Without such divergent departure headings, the Airport is limited to essentially a single stream of departures by jet aircraft. This departure capacity constraint is partially mitigated because controllers can provide divergent headings by non-jet departures. The previous analyses of airfield capacity and aircraft delay by the FAA and others have taken into account these dependent departure procedures. As discussed later in Section of this Technical Memorandum, these departure capacity constraints might be mitigated by available Runway Area Navigation (RNAV) technology, which is already in use at the Airport. Such procedures could enable the development of new and effective noise-abatement flight procedures in the future. The parallel runways are separated by 3,100 feet. Under today's air traffic control rules, the minimum required spacing between parallel runways for independent approaches in all weather conditions is 4,300 feet. With a PRM, independent approaches could be conducted to parallel runways as close as 3,400 feet. 2-4
27 However, the spacing of 3,100 feet between the parallel runways does exceed the minimum spacing of 2,500 feet required for the following three instrument procedures: 1. Parallel dependent (staggered) instrument landing system (ILS) approaches where controllers provide a minimum of 1.5 nautical mile separation diagonally between successive aircraft on the parallel runways. 2. Independent instrument departures provided that 15-degree divergent departure headings can be conducted. As previously mentioned, such divergent headings are currently available at PDX only for turboprop aircraft departures (i.e., not for jet aircraft) because of noise abatement procedures that require all departures from the parallel runways to fly over a common point in each direction of flow. 3. Independent instrument arrivals and departures (i.e., arrivals on one parallel runway are independent of departures on the other parallel runway, and vice versa) provided that the departure course diverges immediately by at least 30 degrees from the missed approach course until separation is applied (which is the case at the Airport). This latter independence between arrivals and departures at the Airport is important because it gives controllers more flexibility to assign arrivals and departures to the runway that is closest to the aircraft gate. At today's traffic levels, such flexibility is manageable, and controllers are able to minimize aircraft taxiing times by crossing over arriving aircraft in the air, rather than on the ground. In addition, because independent departures are currently not feasible at the Airport, controllers are able to assign departures to the runway closest to their gates without significant operational penalties. However, as aviation activity levels increase in the future, and airfield capacity constraints become a more significant issue, there will be increased pressure to separate arrivals and departures in the airspace according to their origin or destination (i.e., assigning aircraft from/to the north to the north parallel runway and aircraft from/to the south to the south parallel runway), thereby reducing crossovers in the air during peak activity periods Wind Coverage of Runway Use Configurations There are three major runway use configurations for aircraft arrivals and departures at the Airport east flow, west flow, and crosswind flow as illustrated on Figure 2-2 below. East flow involves the use of Runways 10L and 10R, with occasional use of Runways 3 and 21 by light aircraft. For noise abatement purposes, east flow is the preferred calm-wind runway-use configuration. West flow involves the use of Runways 28L and 28R, coupled with occasional use of Runways 3 and 21 by light aircraft. Crosswind flow which is in effect when wind conditions preclude the use of the Airport s parallel runway system by smaller, lighter aircraft involves the use of Runways 21, 28R, and 28L. 2-5

28 Figure 2-2 MAJOR RUNWAY USE CONFIGURATIONS AT PORTLAND INTERNATIONAL AIRPORT Source: Leigh Fisher Associates, Runway 10L-28R Extension Feasibility Study, Portland International Airport, August Jacobs Consultancy summarized the runway use criteria in Runway 10L-28R Extension Feasibility Study, August 2006 as follows: East flow is the preferred calm wind runway use configuration. The Airport transitions to crosswind flow when the crosswind component to the Runway 10 or 28 systems approaches or exceeds 15 knots. Gusting crosswinds and reported wind shear can result in controllers switching to crosswind flow at lower reported crosswind speeds. Small, light propeller aircraft approaching or departing from the south cargo area may request clearance to land on or take off from Runway 3, winds 2-6
29 permitting. Such crosswind runway use is generally permitted if the crosswind component on Runway 3-21 does not exceed 12 knots and the tailwind component does not exceed 3 knots. The small, light propeller aircraft that land on Runway 3 when the parallel runway system is in use generally exit the runway south of Runway 10L-28R. However, these arrivals are no longer permitted to conduct land and hold short operations (LAHSO) Operational Weather Category Descriptors In previous studies, different terminology was used to describe operational weather categories. Good weather conditions are variously described as optimum weather, visual flight rules (VFR) conditions, and visual meteorological conditions (VMC). At the other extreme, poor weather conditions are variously described as instrument flight rules (IFR) conditions and instrument meteorological conditions (IMC). Between these two extremes are marginal conditions usually described as marginal visual meteorological conditions (MVMC). Wherever possible in this Technical Memorandum, the descriptors VMC, MVMC, and IMC are used Runway Uses and Weather Conditions Historical For capacity evaluation purposes, the foregoing runway use configurations must also be further categorized according to different operational weather categories as defined by cloud ceiling and visibility. In its previous CEPs for the Airport, the FAA identified five operational weather categories, as follows (see Table 2-1): Visual Meteorological Conditions VMC (referred to as VFR 1 in Table 2-1). When the ceiling is at least 3,500 feet above the ground and visibility at least 10 miles, controllers can conduct independent visual approaches to the parallel runways. Marginal Visual Meteorological Conditions MVMC (referred to as VFR 2 in Table 2-1). When the ceiling is less than 3,500 feet above the ground but at least 2,000 feet, and visibility is less than 10 miles but at least 5 miles, controllers can conduct parallel dependent (staggered) ILS approaches to the parallel runways with a diagonal separation as low as 1.5 nautical miles. Instrument Meteorological Conditions IMC (referred to as IFR 1, IFR 2, and IFR 3 in Table 2-1). These three IFR categories represent ILS Categories I, II, and III, respectively. Only Runway 10R (east flow) has Category II and III ILS approach capability. In the IFR 2 and IFR 3 weather categories, the Airport is limited to a single instrument arrival stream. The frequencies of occurrence of these five weather categories are summarized in Table
30 Table 2-1 RUNWAY USE AND WEATHER CONDITIONS Weather VFR1 VFR2 IFR1 IFR2 IFR3 Minima Visual <VIS and >IFR CAT I CAT II CAT III All weather Ceiling (feet above MSL) 3,500 2, Visibility 10 miles 5 miles 0.5 mile 0.25 mile mile East flow (10L/10R) 34.7% 9.1% 7.7% 0.6% 1.1% 53.2% West flow (28L/28R) Total 73.1% 14.0% 11.2% 0.6% 1.1% 100.0% MSL = mean sea level Sources: October 1996 and October 2001 FAA Capacity Enhancement Plans for the Airport based on historical data tabulated from 10 years of Surface Airways Hourly Data (TD-1440) for January 1, 1979, through December 31, 1988, from the National Climatic Data Center, Asheville, North Carolina. 2.2 FAA Benchmark Capacities The FAA prepared Airport Capacity Benchmark Reports in 2001 and Below is a summary of the findings for the Airport from the FAA s Airport Capacity Benchmark Report 2004: Capacity benchmarks are defined as the maximum number of flights that can be routinely handled at an airport in an hour for the most commonly used runway configuration in each specified weather condition. The capacity benchmark for today is flights per hour (arrivals and departures) in VMC. The benchmark rate decreases in MVMC conditions to flights per hour, and in IFR conditions to flights per hour, for the most commonly used runway configurations in these conditions. Throughput may be lower when ceiling and visibility are low, or when IFR operations at nearby airports affect operations at. Most departures from both parallel runways at the Airport are limited to a single departure corridor (stream) for noise abatement. It was assumed in estimating the future benchmark that this noise abatement procedure was in effect. By limiting departure headings, this procedure reduces the maximum departure throughput. 2-8

31 Table 2-2 below, which was taken from the FAA Airport Capacity Benchmark Report 2004, summarizes the capacity benchmarks for the Airport in VMC, MVMC, and IMC. In addition, Table 2-2 shows the FAA's estimates of the percentage occurrence of each of these weather conditions. Also shown in the table are estimates of benchmark capacities with planned improvements, which consist primarily of technological improvements discussed in Section 2.6. Table 2-2 SUMMARY OF FAA 2004 CAPACITY BENCHMARKS New runway Not applicable Not applicable New runway Not applicable Not applicable Paired approaches, visual separation; same departure procedures New runway Not applicable Not applicable Note: Data on frequency of occurrence of weather and runway configuration usage are based on FAA Aviation System Performance Metrics data for January 2000 to July 2002 (excluding September 2001), 7 AM to 10 PM local time. Source: Federal Aviation Administration, Airport Capacity Benchmark Report 2004, September

32 2.2.1 FAA Benchmark Capacities VMC Estimates of hourly runway capacity for different combinations of arrivals and departures are presented on Figures 2-3 and 2-4, taken from the FAA s Airport Capacity Benchmark Report The segmented linear function plotted on each figure, known as a Pareto frontier, illustrates the trade-offs between arrival capacity and departure capacity. The maximum hourly arrival capacity is the point at which the Pareto frontier intercepts the vertical axis; the maximum hourly departure capacity is the point at which the Pareto frontier intercepts the horizontal axis. The shape of the Pareto frontier between those two endpoints is an indication of the dependence between arrival capacity and departure capacity. A rectangular shape would indicate that arrival capacity and departure capacity are independent. The sloping lines reflect a trade-off between arrival and departure capacity typical of an airfield configuration where mixed operations (both arrivals and departures) occur on the runways. Figure 2-3 FAA CAPACITY BENCHMARK FOR PORTLAND INTERNATIONAL AIRPORT IN VMC Facility Report Rate PDX (arrivals, departures per hour) Arrivals per Hour Departures per Hour Source: Federal Aviation Administration, Airport Capacity Benchmark Report 2004, September

33 As shown on Figure 2-3, for the optimum rate in VMC, the estimated "balanced" capacity benchmark (50% arrivals and 50% departures) for the Airport is 60 arrivals and 60 departures, for a total of 120 hourly aircraft operations. Figure 3 also includes actual plotted data points showing historical hourly arrival and departure rates, which were obtained from the FAA Aviation System Performance Metrics (ASPM) database for January 2000 to July 2002, 7 a.m. to 10 p.m. local time (excluding September 11-14, 2001). Facility reported rates were provided by ATC personnel at the Airport. As shown, these actual hourly arrival and departure rates are considerably lower than the estimated hourly runway capacities illustrated by the Pareto frontier FAA Benchmark Capacities MVMC and IMC The capacity benchmarks for the Airport in MVMC and IMC are illustrated on Figure 2-4. As shown, the arrival and departure capacities are lower and more dependent than they are in VMC. Figure 2-4 FAA CAPACITY BENCHMARKS FOR PORTLAND INTERNATIONAL AIRPORT IN MVMC AND IMC MVMC Rate IMC Rate Arrivals per Hour Arrivals per Hour Departures per Hour Departures per Hour Source: Federal Aviation Administration, Airport Capacity Benchmark Report 2004, September
34 2.2.3 Effect of Weather on Capacity Benchmarks The effect of weather on hourly runway capacity varies widely among airports. Figure 2-5 below, also taken from the FAA Airport Capacity Benchmark Report 2004, illustrates this point. The vertical lines shown for each airport represent a range of capacities between VMC (labeled Optimum on Figure 2-5) and IMC (labeled IFR on Figure 2-5). The range of hourly operations indicated on Figure 2-5 for Portland International Airport (see yellow highlighted box) is typical of many airports with dependent parallel runways. The airports with the widest capacity ranges are Dallas/Fort Worth, Denver, and Chicago O'Hare international airports, which have complex, multiple-runway airfields. The airports with the narrowest capacity ranges are typically characterized by either a single runway operation, such as San Diego International Airport, or those in locations that are not very sensitive to changes in weather conditions. Figure 2-5 RANGES OF 2004 AIRPORT CAPACITY BENCHMARKS FOR TOP 35 U.S. AIRPORTS Weather Conditions: Source: Federal Aviation Administration, Airport Capacity Benchmark Report 2004, September
35 2.2.4 FAA Benchmark Capacities with Planned Technological Improvements Facility Requirements The FAA Airport Capacity Benchmark Report 2004 also estimated that planned technological improvements would increase the benchmark rate at the Airport by as much as 38% in MVMC conditions. This additional benefit derives from Required Navigation Performance (RNP) and Cockpit Display of Traffic Information (CDTI) Enhanced Flight Rules (CEFR), which will allow suitably equipped aircraft to maintain visual separations in MVMC conditions. This additional benefit also assumes that RNP Parallel Approach Transition (RPAT) procedures would allow paired approaches to the parallel runways. These potential RPAT procedures are described in more detail in Section FAA Airport Arrival Rates and Airport Departure Rates 2007 Air traffic controllers specify airport arrival rates (AARs) and airport departure rates (ADRs) for purposes of anticipating the need for coordinating traffic flows with other air traffic control facilities. The AARs and ADRs are intended to represent current and anticipated constraints resulting from runway use and weather conditions that can be coordinated in time to avoid overloading individual air traffic control facilities. They also provide a useful comparison for the foregoing hourly runway capacity estimates. In Table 2-3 below, which was obtained from the FAA Aviation System Performance Metrics database, the FAA provides information on the distribution of facility provided rates for the AARs and ADRs. Note that the total (AAR plus ADR) hourly numbers in Table 2-3 agree closely with the FAA's 2004 "capacity benchmark" for the Airport of 120 total aircraft operations per hour, as shown on Figure
36 Table 2-3 AIRPORT ARRIVAL RATES AND AIRPORT DEPARTURE RATES Source: Federal Aviation Administration, Aviation System Performance Metrics database. 2.3 Estimates of Annual Service Volume Jacobs Consultancy prepared a range of estimates of annual service volume for the Airport, as defined in FAA AC 150/5060-5, Airport Capacity and Delay. In that Advisory Circular, ASV is defined as the point at which further increases in demand will result in disproportionate increases in average aircraft delay. As such, ASV is not a hard upper limit on annual aircraft operations and is not tied to any particular aircraft delay level. Aircraft operations levels can be as much as 15% to 20% higher than ASV before aircraft delays become excessive, depending on aircraft mix, operational complexity, and peaking patterns. 2-14
37 Annual service volume is calculated using a formula in FAA AC 150/5060-5, which essentially extrapolates the various hourly runway capacities for specific runway uses and weather conditions to an annual capacity using the percent occurrence of those runway uses and weather conditions and weighting factors prescribed in the Advisory Circular. Moreover, in AC 150/5060-5, ASV is the basis for estimating average annual aircraft delay using a ratio of total annual operations to ASV, as demonstrated in Section Jacobs Consultancy calculated ASV based on the hourly runway capacity estimates from the (1) 1996 Capacity Enhancement Plan, (2) the 2001 Capacity Enhancement Plan, and (3) the Airport Capacity Benchmark Report 2004, as shown in Table 2-4. In its 1996 and 2001 CEPs, the FAA used aircraft delay curves to estimate annual capacities as the annual operations levels that correspond to an average annual aircraft delay of 10 minutes per operation. These aircraft delay curves are discussed later in Section and are reproduced on Figure 2-8. The annual aircraft operation levels corresponding to an average aircraft delay of 10 minutes per operation are shown in the second column of Table 2-4. Therefore, ASV is not just a measure of annual capacity; it also provides a standard industry method for estimating aircraft delays that is widely used in the United States for airport master planning and system planning studies. We have used this ASV method to estimate existing and future aircraft delays at the Airport, as discussed in Section of this Technical Memorandum. 2-15
38 Table 2-4 SUMMARY OF PREVIOUS ESTIMATES OF ANNUAL AIRFIELD CAPACITY Source 1996 FAA Capacity Enhancement Plan 2001 FAA Capacity Enhancement Plan 2004 FAA Airport Capacity Benchmark Report Annual Capacity (Operations) at Average Delay of 10 minutes/ operation Hourly VMC Capacity Capacity % of Time Hourly MVMC Capacity Capacity % of Time Hourly IMC Capacity Capacity % of Time Annual Service Volume (ASV) * 2007 Operations 2007 Operations as % of ASV 412, % % % 376, , % 510, % % % 461, , % Not Applicable % % % 425, , % *Preliminary estimates by Jacobs Consultancy using methods in FAA AC 150/5060-5, Airport Capacity and Delay. Aircraft operations levels can be as much as 15% to 20% higher than ASV before aircraft delays become excessive. Source: Jacobs Consultancy based on review of previous FAA and Master Plan reports, August
39 Figure 2-6 below shows a graphical comparison of the various ASVs. Figure 2-6 ESTIMATES OF ASV USING CAPACITIES FROM PREVIOUS FAA CAPACITY STUDIES 500, , , ,000 Estimated Annual Service Volumes 400, , , , , , , ,000 50, FAA CEP 2001 FAA CEP 2004 Capacity Airport Report Benchmarks FAA Source Document Capacity Benchmark Source: Jacobs Consultancy, August On the basis of a review of the foregoing results, Jacobs Consultancy recommends adopting the FAA 2004 baseline capacity estimates, as shown in Table 2-2, and the corresponding estimate of ASV of 425,000 operations for purposes of evaluating future airfield requirements and estimating the delay reduction benefits of proposed airfield improvements. 2.4 Comparison of Hourly Demand with Hourly Capacity For purposes of comparing hourly demand with hourly runway capacity, Figure 2-7 shows a chart of rolling hourly counts of arrivals and departures every 6 minutes (taken from the Port s Airport Noise and Operations Monitoring System [ANOMS] data), with arrivals plotted above the horizontal axis and departures plotted below the horizontal axis. This chart shows detailed peaking within the hour, which can easily be compared 2-17
40 with hourly runway capacities, which are shown as green (VMC capacity) and red (MVMC and IMC capacities) horizontal lines on Figure 2-7. Departures Arrivals Departures Arrivals Figure 2-7 ROLLING HOURLY COUNTS OF AVIATION ACTIVITY FROM ANOMS DATA, AUGUST 10, :00 1:00 2:00 3:00 4:00 5:00 6:00 7:00 8:00 9:00 10:00 11:00 12:00 13:00 14:00 15:00 16:00 17:00 18:00 19:00 20:00 21:00 22:00 23:00 Hour of Day of day VMC Capacity MVMC and IMC Capacities Source: Jacobs Consultancy, August Note that the peak arrivals exceed the MVMC and IMC capacities in the afternoon peak hour, but are well below the VMC capacity. MVMC and IMV occur a total of about 27% of the time, as noted in Table 2-1. Similarly, peak departures exceed the MVMC and IMC capacities during two of the peak hours, but are well below the VMC capacity. Therefore, as indicated on Figure 2-7, for these conditions, delays are expected to be low in VMC and moderate in MVMC and IMC. 2.5 Aircraft Delays Comparison of Previous FAA Aircraft Delay Estimates Jacobs Consultancy reviewed the previous FAA aircraft delay curves from the 1996 FAA Capacity Enhancement Plan, the 2000, and the 2001 FAA Capacity Enhancement Plan. To simplify the discussion, please note that the delay curves used in the 2000 are the same as those in the 1996 FAA Capacity Enhancement Plan. 2-18


41 The aircraft delay curves from the 1996 and 2001 FAA Capacity Enhancement Plans differ significantly, as can be seen on Figure 2-8 where they are plotted on the same chart. Figure 2-8 SUMMARY OF AIRCRAFT DELAY CURVES FROM PREVIOUS FAA CAPACITY ENHANCEMENT PLANS AND ESTIMATES USING ASV METHODOLOGY Note that, on Figure 2-8, the corresponding demand levels differ by nearly 100,000 annual operations (386,000 annual operations versus 484,000 annual operations) at the same level of annual aircraft delay (e.g., 6.4 minutes per operation). Similarly, for the same demand level, the more recent 2001 estimates of average annual aircraft delay developed using ADSIM are considerably lower than the 1996 estimates developed using SIMMOD. It is not clear why these delay estimates differ so widely. Different simulation models often yield different results. 2-19

42 2.5.2 Aircraft Delays Estimated Using ASV Methodology To help reconcile these differences, Jacobs Consultancy estimated average annual aircraft delays based on the ASV methodology described in FAA AC 150/5060-5, Airport Capacity and Delay. This methodology enables the user to estimate average annual aircraft delays based on the relationship between average annual aircraft delay and the ratio of annual demand to ASV, as shown on Figure 2-9. Figure 2-9 AIRCRAFT DELAY CURVES FROM FAA AC 150/5060-5, AIRPORT CAPACITY AND DELAY Average Delay Per Aircraft (Minutes) Ratio of Annual Demand to Annual Service Volume 2-20
43 The aircraft delay curves illustrated on Figure 2-9 represent a range of possible annual aircraft delays estimated by the FAA on the basis of extensive experimentation using ADSIM over a wide range of conditions and runway use configurations. For purposes of this airfield requirements analysis, Jacobs Consultancy estimated average annual aircraft delays using the upper end of the range (which is intended to be used for major air carrier airports) of FAA delay curves shown on Figure 2-9, along with the assumed ASV of 425,000 operations and the forecast annual aircraft operations developed by Jacobs Consultancy as part of this. The estimated average annual aircraft delays are shown in Table 2-5 and on Figure 2-8 (presented earlier) as the yellow plotted curve, which more or less coincides with the aircraft delay curve developed for the 2001 FAA Capacity Enhancement Plan using ADSIM. Therefore, for the purposes of future evaluation, we recommend using the ASV methodology, which closely agrees with the aircraft delay curves prepared for the 2001 FAA Capacity Enhancement Plan. Table 2-5 ESTIMATES OF AVERAGE ANNUAL AIRCRAFT DELAY CORRESPONDING TO FORECAST DEMAND LEVELS PAL (Forecast Year) Annual Operations Ratio of Annual Operations to 2007 ASV (425,000) Average Annual Delay (minutes per operation) PAL 1 (2012) 258,480 61% 0.7 PAL 2 (2017) 291,540 69% 1.0 PAL 3 (2022) 318,440 75% 1.2 PAL 4 (2027) 347,360 82% 1.6 PAL 5 (2035) 377,820 89% 2.1 Source: Jacobs Consultancy using ASV methodology in FAA AC 150/5060-5, Airport Capacity and Delay, and forecast demand in Jacobs Consultancy, Technical Memorandum No. 2 Aviation Demand Forecasts, September Both the foregoing estimates of aircraft delays and actual data on aircraft delays indicate that the current and estimated delay levels at the Airport will remain low, even for PAL 5 (2035) activity of 377,820 annual aircraft operations, for which the average annual aircraft delay is estimated at about 2.1 minutes per operation, as shown in Table 2-5. Therefore, the existing airfield at the Airport appears to have adequate capacity to accommodate demand forecast through PAL 5 (2035) with low aircraft delays. 2-21
44 The FAA previously estimated an upper limit of about 500,000 annual aircraft operations at the Airport most likely based on its 2001 aircraft delay curve, as presented on Figure 2-8, which shows that an average annual delay of about 10 minutes per aircraft operation would be reached at an annual aircraft operations level of slightly over 500,000. As further corroboration of this estimate, note that the ratio of 500,000 annual operations to the ASV estimate of 425,000 operations is about 1.2, which would imply an average annual delay of about 10 minutes per operation according to the upper delay curve presented on Figure 2-9. Therefore, at today's capacity levels, the estimated upper limit of 500,000 annual aircraft operations at the Airport appears to be reasonable. 2.6 Potential Effects of Future ATC and Aircraft Navigation Technology NextGen s Key Capabilities and Core Technologies The FAA Joint Planning and Development Office (JPDO) prepared a plan for future ATC and navigation technologies called the Next Generation Air Transportation System (NextGen).* These global positioning system (GPS)-based technologies are expected to provide significant airport capacity increases by enabling more precise aircraft navigation and surveillance, thereby reducing the required spacing between simultaneous movements and separations between aircraft. These technologies will require major investments on the part of both the FAA and the airlines, and their timing is uncertain. Table 2-2 presents expected increases in runway capacity with these new technologies (improvements). The NextGen technologies are expected to improve both VFR and IFR capacities and reduce airspace capacity constraints. The bases of these technologies are the concepts of RNAV and RNP. These concepts can best be understood by contrasting them with today's aircraft navigation procedures. As shown on Figure 2-10, today's aircraft navigation procedures involve flying zigzag courses between groundbased navigation aids, and all pilots must generally follow the same routes from navigational aid to navigational aid. RNAV is a method of navigation that permits flying on any desired flight path, independent of ground-based navigational aid location. *Federal Aviation Administration, NextGen Implementation Plan, June
45 Figure 2-10 COMPARISON OF RNAV AND RNP FLIGHT PROCEDURES WITH CURRENT FLIGHT PROCEDURES Source: Federal Aviation Administration, Roadmap for Performance Based Navigation, Evolution for Area Navigation (RNAV) and Required Navigation Performance (RNP) Capabilities , July Currently, RNAV (GPS) instrument approach procedures are in place to Runways 10L, 10R, 28R, and 28L, which essentially are overlay procedures that mimic the ILS approaches to those runways. RNP is a statement of navigation performance accuracy necessary for operation within a defined airspace. Essentially, RNP is RNAV with on-board navigation monitoring and alerting. RNP-capable aircraft are equipped with dual flight management system computers that can monitor actual navigation performance and alert the pilot when the RNP operational requirement cannot be met. RNAV and RNP flight procedures are conducted from waypoint to waypoint, and are completely independent of ground-based navigational aids, as shown by the second and third diagrams on Figure These pilot-defined flight paths can save significant route mileage and travel time both in the en route and terminal area airspace, and can be defined to follow more precisely desired noise-abatement flight corridors. 2-23
46 Alaska Airlines and Horizon Air currently use RNP procedures to Runways 28R and 28L at the Airport. Horizon Air has been using RNP procedures at the Airport since September 2007 on its Bombardier Q400 Dash 8s. In particular, the special Alaska/Horizon RNAV RNP approach to Runway 28R follows the Columbia River on a path similar to the charted Mill visual approach procedure to reduce noise impacts on neighborhoods Multiple RNP Approach Procedures RNP approaches are characterized by their precision or "RNP value." For example, an RNP procedure may be specified to have an RNP value of 0.3 nautical mile, which means that an aircraft capable of flying such an approach is virtually assured of remaining within a "containment area" that is plus or minus 2-RNP wide (i.e., plus or minus 0.6 nautical mile). Therefore, RNP approaches may provide the basis for development of new simultaneous independent instrument approach procedures to more closely spaced parallel runways, such as those at. For example, the top portion of Figure 2-11 illustrates the existing requirements for conducting simultaneous independent instrument approaches, which entail protection of a no-transgression zone between the runways. With today's technology and air navigation precision, the required spacing for conducting such approaches is 4,300 feet. The lower portion of Figure 2-11 illustrates a potential concept for conducting simultaneous independent approaches by RNP-equipped aircraft, where the required spacing between parallel approaches would be defined as 4 times RNP. Such spacing would ensure safe aircraft separation and would replace the concept of having a notransgression zone between the parallel runways, monitored by air traffic controllers. 2-24
 and Required Navigation Performance (RNP) Capabilities 2006-2025, July 2006. If such procedures were conducted by aircraft equipped to fly with an RNP value of 0.")

47 Figure 2-11 POTENTIAL REDUCTION IN REQUIRED SPACING FOR CONDUCTING SIMULTANEOUS INDEPENDENT INSTRUMENT LANDINGS Source: Federal Aviation Administration, Roadmap for Performance Based Navigation, Evolution for Area Navigation (RNAV) and Required Navigation Performance (RNP) Capabilities , July If such procedures were conducted by aircraft equipped to fly with an RNP value of 0.1 nautical mile or better, the spacing between parallel runways could be reduced to about 2,430 feet (4 x 0.1 x 6,076 feet per nautical mile), a decrease from the current 4,300 feet with today's ILS technology and procedures RNP Parallel Approach Transition Another procedure enabled by RNP approaches is a side-step procedure similar to the Simultaneous Offset Instrument Approach (SOIA) procedure developed for Lambert/St. Louis international Airport and San Francisco International Airport. This RPAT 2-25

48 procedure is illustrated below on Figure This procedure is specifically mentioned as a potential capacity enhancement for the Airport in the FAA s Airport Capacity Benchmark Report Figure 2-12 SIMULTANEOUS RNP PARALLEL APPROACH TRANSITION AND ILS PROCEDURES Potentially applicable with 2,100-foot cloud ceilings and 3-5 mile visibility Source: Federal Aviation Administration, Roadmap for Performance Based Navigation, Evolution for Area Navigation (RNAV) and Required Navigation Performance (RNP) Capabilities , July The FAA has estimated that the foregoing RPAT procedure could provide a capacity increase of up to 60% over a single approach procedure; by comparison, an independent approach procedure would provide a capacity increase of up to 100% over a single approach procedure Potential Benefits of RNAV Standard Instrument Departures (SIDS) The greater precision and navigation possible with RNAV and RNP approach and departure procedures were previously mentioned. RNAV flight procedures have been widely implemented at many airports for both arrivals and departures. One of the major benefits of RNAV procedures is that they are flown without the need for radar vectors and the associated voice communication between pilots and controllers. RNAV flight procedures have been implemented at Dallas/Fort Worth and Hartsfield- Jackson Atlanta international airports, and their benefits have been quantified and documented. These RNAV flight procedures are illustrated on Figure The reduced dispersion of flight tracks enabled by the RNAV flight procedures is evident from the actual radar flight tracks shown on Figure
")
, departures were radar")
49 Figure 2-13 RADAR FLIGHT TRACKS BEFORE AND AFTER RNAV STANDARD INSTRUMENT DEPARTURES Before After ATL RNAV Standard Instrument Departures Hartsfield-Jackson Atlanta International Airport DFW RNAV Standard Instrument Departures Dallas/Fort Worth International Airport Source: RNAV/RNP Program Update, Federal Aviation Administration The benefits from the standard instrument departure (SID) procedures shown on Figure 2-13 were documented and widely accepted by both pilots and air traffic controllers. Before the implementation of the RNAV SIDs at Dallas/Fort Worth International Airport and Hartsfield-Jackson Atlanta International Airport (left-hand pictures on Figure 2-13), departures were radar vectored, significant dispersion in flight tracks occurred, and there were limited exit points from the terminal area airspace. After implementation of the RNAV SIDs (right-hand pictures on Figure 2-13), pilots flew RNAV flight tracks on departure (i.e., they were not radar vectored), flight track dispersion was reduced, pilots were able to fly more efficient vertical profiles, there were additional exit points available from the terminal area airspace, and voice transmissions were reduced 30% to 50%. Such flight procedures are available today and do not require future technologies or changes in flight procedures; they only require that aircraft be equipped to fly the RNAV SIDs. Therefore, such RNAV departure procedures might provide the tools necessary for ultimately developing new noise abatement departure procedures at the Airport that will enable pilots to fly very precise, nondivergent departure paths from the parallel 2-27
50 runways (e.g., both flying straight out on runway heading) with such operations being conducted simultaneously and independently. 2.7 Conclusions and Recommendations 1. Previous FAA estimates of hourly runway capacities and average aircraft delays, as documented in its 1996 and 2001 Capacity Enhancement Plans, vary widely and were estimated using different simulation models. The reasons for these differences are not clear. Moreover, the demand levels assumed in those plans were much higher than those forecast for 2035 (PAL 5) in this. 2. The more recent estimates of hourly runway capacities contained in the FAA s 2001 Capacity Enhancement Plan and the 2004 Airport Capacity Benchmark Report 2004 also differ from one another. The 2004 capacity benchmarks were intended to update the 2001 capacity benchmarks. Therefore, it is recommended that the 2004 FAA baseline capacities be used, along with Jacobs Consultancy s corresponding ASV estimate of 425,000 aircraft operations for future evaluations of airfield requirements and for estimating the delay-reduction benefits of proposed airfield capacity improvements at the Airport. The delay estimates produced using this ASV estimate agree reasonably well with the delay estimates presented in the 2001 FAA Capacity Enhancement Plan. 3. In this Technical Memorandum, we have used ASV as defined in FAA Advisory Circular 150/5060-5, Airport Capacity and Delay. As defined in this Advisory Circular, ASV is the point at which further increases in demand will result in disproportionate increases in average aircraft delay. As such, ASV is not a hard upper limit on annual aircraft operations and is not tied to any particular aircraft delay level. 4. The FAA previously estimated an upper limit of about 500,000 annual aircraft operations at the Airport, a level that the 2008 forecasts indicate would not be reached until well beyond This FAA estimate was based on an aircraft delay curve in the 2001 FAA Capacity Enhancement Plan, which showed that an average annual delay of about 10 minutes per operation would be reached at an annual operations level of 500,000 (that aircraft delay curve is reproduced on Figure 2-8 of this Technical Memorandum). As further corroboration of this estimate, note that the ratio of 500,000 annual operations to the ASV estimate of 425,000 annual operations is about 1.2, which would imply an average annual delay of about 10 minutes per operation according to the delay curves on Figure 2-9 of this Technical Memorandum. Therefore, at today's capacity levels, the upper limit of 500,000 annual aircraft operations appears to be reasonable. 2-28
51 5. Both estimated aircraft delays and actual data on aircraft delays indicate that delay levels at the Airport will remain low even for the level of aircraft operations forecast throughout the planning period (i.e., PAL 5, or 2035). Therefore, there does not appear to be an immediate need for significant capacity enhancements at the Airport, such as a new runway or a more widely spaced parallel runway. Nevertheless, the FAA recommends initiating planning related to capacity enhancements when annual operations reach 60% of ASV (425,000). The 2007 annual operations level (264,518) at the Airport exceeds 60% of the Airport s ASV; therefore, the Port should continue to plan for capacity enhancements in this. 6. The spacing between the parallel runways currently limits the area available for passenger terminal development and associated apron-edge taxiways and taxilanes. 7. The airfield appears to have an adequate supporting taxiway system for aircraft circulation and queuing of departures and arrivals. At current traffic levels, controllers have the flexibility to minimize aircraft taxiing distances by assigning arrivals and departures to the runway closest to the aircraft gates. However, as traffic increases in the future, this flexibility may be reduced, particularly in peak demand periods. Therefore, average aircraft taxiing times are likely to increase as traffic increases in the future. Accordingly, in the future, the taxiway system should be modified to facilitate the movement of taxiing aircraft between the north and south parallel runways. 8. The FAA has estimated potential increases in future hourly runway capacity with the JPDO NextGen technology improvements for the Airport and the other top 35 U.S. airports. However, the timing of these capacity improvements is uncertain because of the major investments that would be required on the part of both the FAA and the airlines. Although it is reasonable to assume that progress will be made on these future technologies by the time the annual operations level at the Airport reaches 378,000 (at PAL 5 or about 2035), we recommend not relying on those capacity increases until the timing of future technology is better understood. 9. The existing spacing of 3,100 feet between the parallel runways may be sufficient to permit simultaneous independent approaches in all weather conditions in the future with greatly increased navigation and surveillance accuracy made possible by RNAV and RNP flight procedures. The major investments required for enabling such approaches would be borne by the airlines in the form of equipping their aircraft with the required onboard GPSbased navigation technology. This enhanced navigation technology may also enable the implementation of independent noise-abatement departure procedures from the parallel runways at the Airport without requiring divergent flight paths. 2-29
52 3. PASSENGER TERMINAL 3.1 Background The passenger terminal requirements assessment focused on the key functional elements listed below. Aircraft gates and parking Airline check-in Passenger security screening Holdrooms Checked baggage security screening Outbound baggage makeup Inbound baggage handling Domestic baggage claim Federal Inspection Services (FIS) facilities Concessions With the exception of concession facilities, facility requirements were assessed by analyzing design-day flight schedules developed as part of the forecasts (planning schedules). The planning schedules represent scheduled airline activity occurring on an average day during the peak month (August). The development of the planning schedules, including an assessment of seasonal fluctuations in activity, is discussed in Section 5.9 in Technical Memorandum No. 2 Aviation Demand Forecasts,, (Jacobs Consultancy, September 2008). Schedules analyzed as part of the requirements analysis included an actual base year (i.e., 2008) schedule and schedules for forecast years 2017 (PAL 2), 2022 (PAL 3), 2027 (PAL 4), and 2035 (PAL 5). A planning schedule for 2012 (PAL 1) was not developed because the forecast demand for 2012 is similar to the activity in the base year. Results of the requirements analyses are summarized in Table 3-1. Detailed discussion of each functional element is provided in the sections that follow. As explained later in this section, requirements for concessions were assessed in light of the Port s current planning objectives and philosophy. In developing requirements for functional elements of the passenger terminal other than concessions, different modeling and analysis tools were used, as appropriate. Aircraft gate and parking requirements were assessed using Jacobs Consultancy s proprietary Gate Model. Airline check-in and passenger security screening requirements were assessed using Comprehensive Airport Simulation Technology, a high-performance fast time simulation system developed by Airport Research Center GmbH and licensed to Jacobs Consultancy. Other elements were assessed using spreadsheet-based tools that were developed by Jacobs Consultancy and have been used over many years. 3-1
53 Table 3-1 SUMMARY OF PASSENGER TERMINAL FACILITIES REQUIREMENTS Functional Element Existing 2008 PAL Estimated requirements PAL 2 PAL PAL PAL PAL Estimated surplus (deficiency) PAL 2 PAL BASIS FOR REQUIREMENTS (DEMAND FORECASTS) Total annual passengers (millions) n/a n/a n/a n/a n/a n/a Total air cargo (thousands of short tons) n/a n/a n/a n/a n/a n/a Aircraft operations (thousands) n/a n/a n/a n/a n/a n/a Aircraft gates and parking Domestic gates Widebody Narrowbody - ADG IV (e.g., B ) Narrowbody - ADG III (e.g., B ) (19) (19) (14) (12) (18) (17) Regional jet / turboprop Total domestic gates FIS gates Widebody (1) Narrowbody - ADG IV (e.g., B ) Narrowbody - ADG III (e.g., B ) (1) (1) (2) (1) (2) (1) Regional jet / turboprop Total FIS gates (1) (2) (2) Total domestic + FIS gates Widebody Narrowbody - ADG IV (e.g., B ) Narrowbody - ADG III (e.g., B ) (20) (20) (16) (13) (20) (18) Regional jet / turboprop Total domestic + FIS gates (1) - Remote / RON parking Widebody Narrowbody - ADG IV (e.g., B ) Narrowbody - ADG III (e.g., B ) (7) (7) (12) (15) (25) (24) Regional jet / turboprop (1) (1) (1) (1) - (1) Total Remote / RON parking (4) (4) (6) (10) (17) (23) Holdrooms (area in square feet) Concourse A 6,004 9,953 9,953 9,953 11,076 10,417 10,766 (3,949) (3,949) (3,949) (5,072) (4,413) (4,762) Concourse B 4,701 4,182 4,182 4,308 4,308 2,914 2, ,787 2,068 Concourse C 40,267 24,407 24,407 29,316 28,464 30,748 31,629 15,860 15,860 10,951 11,803 9,519 8,638 Concourse D 26,117 27,341 27,341 31,930 34,321 37,129 36,838 (1,224) (1,224) (5,813) (8,204) (11,012) (10,721) Concourse E 11,212 10,611 10,611 9,914 9,759 8,868 8, ,298 1,453 2,344 2,228 Total holdroom area 88,301 76,494 76,494 85,421 87,928 90,076 90,850 11,807 11,807 2, (1,775) (2,549) PAL PAL
54 Table 3-1 (page 2 of 3) SUMMARY OF PASSENGER TERMINAL FACILITIES REQUIREMENTS Functional Element PAL Estimated requirements PAL 2 PAL PAL PAL PAL Estimated surplus (deficiency) PAL 2 PAL Existing 2008 Airline Check-in Number of processors Agent counters Kiosks w/bag check Kiosks w/out bag check (1) (1) - (2) (5) (9) Curbside Total Lobby queue area (square IATA level of service B 13,565 11,296 11,296 12,944 14,528 14,832 16,704 2,269 2, (963) (1,267) IATA level of service C 13,565 9,884 9,884 11,326 12,712 12,978 14,616 3,681 3,681 2, (1,051) Passenger Security Screening Number of screening lanes South (1) (1) (2) (5) North Total (2) (5) Queue area (square feet) Document IATA level of service B South 1,660 1,170 1,170 3,458 3,692 3,536 4, (1,798) (2,032) (1,876) (2,942) North 1,504 1,118 1,118 2,301 2,301 2,470 2, (797) (797) (966) (1,200) Total 3,164 2,288 2,288 5,759 5,993 6,006 7, (2,595) (2,829) (2,842) IATA level of service C South 1, ,926 3,124 2,992 3, (1,266) (1,464) (1,332) (2,234) North 1, ,947 1,947 2,090 2, (443) (443) (586) (784) Total 3,164 1,936 1,936 4,873 5,071 5,082 6,182 1,228 1,228 (1,709) (1,907) (1,918) (3,018) Primary IATA level of service B South 2,003 2,860 2,860 3,367 4,082 4,082 4,953 (857) (857) (1,364) (2,079) (2,079) (2,950) North 2,044 2,223 2,223 2,288 2,483 2,951 3,250 (179) (179) (244) (439) (907) (1,206) Total 4,047 5,083 5,083 5,655 6,565 7,033 8,203 (1,036) (1,036) (1,608) (2,518) (2,986) IATA level of service C South 2,003 2,420 2,420 2,849 3,454 3,454 4,191 (417) (417) (846) (1,451) (1,451) (2,188) North 2,044 1,881 1,881 1,936 2,101 2,497 2, (57) (453) (706) Total 4,047 4,301 4,301 4,785 5,555 5,951 6,941 (254) (254) (738) (1,508) (1,904) (2,894) Baggage Security Screening Number of primary EDS machines South North Total PAL PAL
55 Table 3-1 (page 3 of 3) SUMMARY OF PASSENGER TERMINAL FACILITIES REQUIREMENTS Functional Element PAL Estimated requirements PAL 2 PAL PAL PAL PAL Estimated surplus (deficiency) PAL 2 PAL Existing 2008 Outbound Baggage Makeup Number of cart staging positions South (1) (8) (17) North (4) (5) Total (12) (22) Inbound Baggage Handling Total offload frontage (linear feet) (23) (51) Baggage Claim -- Domestic Total presentation frontage (linear feet) 1,653 1,094 1,094 1,262 1,417 1,539 1, Total area for claiming baggage (square feet) 32,812 16,529 16,529 19,067 21,411 23,250 24,702 16,283 16,283 13,745 11,401 9,562 8,110 FIS Facilities Primary processing Number of primary screening modules (1) (1) (1) (1) Primary queuing area (square feet) 5,037 4,313 4,313 6,038 6,038 6,038 6, (1,001) (1,001) (1,001) (1,001) Baggage Claim Per device Presentation frontage (linear feet) (65) (65) (65) (65) (65) (65) Retrieval & peripheral area (square feet) 2,525 2,972 2,972 2,972 2,972 2,972 2,972 (447) (447) (447) (447) (447) (447) Total Number of devices (1) (1) (1) (1) Presentation frontage (linear feet) (130) (130) (340) (340) (340) (340) Retrieval & peripheral area (square feet) 5,800 5,945 5,945 8,917 8,917 8,917 8,917 (145) (145) (3,117) (3,117) (3,117) (3,117) Secondary processing Queuing area (square feet) (105) (105) (331) (331) (331) (331) Referral waiting area (square feet) 1, Exam podiums w/ belts (units) X-ray workstations (units) Baggage security screening Number of primary EDS machines (2) (2) (3) (3) (3) (3) Passenger security screening Number of screening lanes PAL PAL ADG = Airplane design group EDS = Explosives detection system IATA = International Air Transport Association RON = Remain overnight CAT = Category FIS = Federal Inspection Services n/a = Not applicable a. Passenger terminal complex requirements were determined based primarily on simulation modeling using flight schedules for 2008, 2017, 2022, 2027 and A flight schedule was not developed for 2012 because the activity is forecast so be very similar to activity in Accordingly, requirements for the passenger terminal complex in 2012 were assumed to equal the requirements for Source: Jacobs Consultancy, October
56 Data sources for key assumptions used throughout these analyses are noted below: Airline-specific load factors were based on actual monthly averages for August 2007 obtained from the U.S. Department of Transportation (DOT) T100 database. Airline-specific percentages of passengers originating or terminating at the Airport were based on actual third quarter 2007 averages obtained from the U.S. DOT OD1B database. Earliness distributions and percentage splits for originating passengers first point-of-contact in the terminal were based on surveys conducted by Jacobs Consultancy in August 2008, and data contained in a report prepared for the Transportation Security Administration (TSA), Architectural and Engineering Design, In-Line Baggage Screening Improvements, 100% TSA Design Report, PGAL, June 2008 (TSA Design Report). 3.2 Aircraft Gates and Parking The requirements analysis for this functional element focused on identifying the number of gates and remote aircraft parking positions required to accommodate passenger airline activity in each planning schedule. For purposes of this analysis, a gate is any aircraft parking position used by airlines for loading and unloading passengers, and a remote parking position is any aircraft parking position used only for staging idle aircraft. Remote parking is generally used by aircraft that remain overnight (RON). Gate and remote parking requirements were assessed using Jacobs Consultancy s Gate Model. The Gate Model is a planning tool used to allocate flights to gates and remote parking positions based on: Physical constraints, which include geometric constraints that limit the size and types of aircraft that can park at each position, and any physical dependencies that may exist between adjacent positions. Policies and priorities, which include rules that govern how gates are to be allocated among various airline users. For example, provisions of the Port s Airport use and lease agreements may grant exclusive or preferential use of specific gates to a particular airline. Operational parameters, which include assumptions regarding the amount of time typically required for gating and towing operations and buffer time. Buffer times are minimum planning allowances between successive gate occupancies that take into account both schedule variations and the time required for maneuvering aircraft in and out of the gate. 3-5
57 Gate Model runs were conducted to test the ability of the existing gate layout to accommodate each planning schedule. During each run, the model attempts to assign each flight in the schedule to an existing gate. When flights cannot be assigned to an existing gate, the model generates new gates as required to accommodate all flights in the schedule. The model is also used to identify any surplus gate positions. Flights will not be assigned to gates that are not needed to accommodate the airline schedule, or to gates that are not usable by the aircraft fleet. The existing terminal apron provides 67 independent gate positions. Of these, 6 are FIS gates that can accommodate international arrivals, and 61 are used exclusively for domestic operations. Except for the 14 commuter gates at Concourse A and 7 commuter gates at Concourse E, all gates are equipped with loading bridges. Existing remote/ron positions relatively close to the terminal and suitable for staging passenger airline aircraft are located on the Northeast Ramp and the Southeast Ramp. Currently, there are approximately eight usable positions in these areas. A summary of gate and remote aircraft parking requirements is presented in Table 3-1. Key findings of the analysis are summarized as follows: The available capacity of the existing terminal gates can absorb much of the increased demand associated with the future planning schedules. Most of the surplus gate capacity is located on Concourse C. Increased demand can also be accommodated by increasing gate use, i.e., the number of daily turns per gate. The results of the analysis indicted that gate use could be increased from the current 4.3 daily turns per gate to 6.0 turns per gate by PAL 5 (2035). The increased gate use required to avoid constructing new gates can be achieved gradually over time. As indicated on Figure 3-1, no increase over the current gate use is needed by PAL 1 (2012); thereafter, an increase of only one-half turn per planning activity level (i.e., 4.5, 5, 5.5, and 6 daily turns per gate by PAL 2 (2017), PAL 3 (2022), PAL 4 (2027), and PAL 5 (2035), respectively) is necessary. To achieve higher gate use, additional gate sharing, common-use gates and remote parking positions will be required. Additional remote parking would allow individual gates to accommodate multiple originating aircraft (i.e., aircraft that depart in the morning after overnighting at the Airport). As many as 31 remote aircraft parking positions will be needed by PAL 5 (2035). One additional narrowbody FIS gate (7 total FIS gates) will be needed by PAL 2 (2017). One additional FIS gate (8 total FIS gates) will be required by PAL 5 (2035). 3-6
58 Figure 3-1 SENSITIVITY OF AIRCRAFT GATES REQUIRED TO PRODUCTIVITY IN DAILY TURNS PER GATE Gates Planning Period Key assumptions used in the analysis of gate and remote aircraft parking requirements are summarized below: Airline gate allocations were based on current leases. If an airline s flights could not be accommodated at its leased gates, then flights were assigned to the nearest Port gate on the same concourse. Domestic flights on Concourse D were allowed to use FIS gates when/if those gates are not needed for an international flight. 3-7
59 Operational parameters: Gate operation (minutes) Sector/aircraft class Arrival Departure Turn Buffer Domestic widebody Domestic narrowbody Airplane Design Group (ADG) IV Domestic narrowbody ADG III Domestic regional jet/turboprop International widebody International narrowbody ADG III Two management issues beyond the scope of this should be addressed in follow-on studies. The first issue relates to managing the gates as gate use increases from 4.3 daily turns per gate to 6.0 daily turns per gate an increase of 40%. The second issue is the potential effect of increased gate use on the operation and storage of aircraft ground support equipment (several potential solutions to this issue have been suggested, including the creation of a designated ground support equipment storage area). 3.3 Airline Check-In The requirements analysis for this functional element focused on identifying the number of check-in processors (for the purposes of this analysis, a processor is a facility, such as a ticket counter or electronic kiosk, where a function related to ticketing or baggage check-in is accomplished) required and the square footage required for queuing in the ticket lobby. These requirements were developed using Comprehensive Airport Simulation Technology. Comprehensive Airport Simulation Technology was set up to solve for the number of processors that would be required to meet an assumed level-of-service standard (i.e., maximum wait time in queue) and to determine the maximum passenger queue that would result if the indicated number of processors were available. The maximum passenger queues were then converted to square footage requirements based on the International Air Transport Association (IATA) level-of-service standards. In conducting the analysis, requirements were developed for each airline in the planning schedules. Aggregate results (i.e., the sum of all individual airline requirements) are presented in Table 3-1. Table 3-1 also presents aggregate totals for the existing number of processors and lobby queue area based on the following: The existing total number of check-in processors includes 18 unused agent counter positions located in the south lobby area. 3-8
60 The existing total lobby queue area of approximately 13,500 square feet is the estimated area that will be available for queuing when TSA baggage screening equipment and operations are removed from the ticket lobby when the in-line baggage screening system is fully installed and operational. As shown in Table 3-1, the requirements analysis indicated that the existing number of check-in processors and queuing area provided in the ticket lobby are sufficient to accommodate forecast demand throughout the planning period. Also, it was determined that the area provided for passenger circulation in the ticketing lobby is sufficient. It was assumed that allocation of check-in facilities among different airline users will be managed to address potential imbalances that may arise. Managing this allocation will be easier once the new in-line baggage screening system now under construction is operational. Currently, the Port s ability to reallocate airline check-in counters is limited by the fact that these facilities are served by baggage take-away belts that are tied to specific makeup devices in the lower level baggage handling area. Baggage sortation capabilities provided by the new in-line screening system will largely eliminate this constraint. The new in-line system will consist of two zones, north and south, and bags checked at any counter within a zone can be routed to any makeup device in the same zone. This increased operational flexibility will make common-use check-in facilities, such as those currently provided in the south lobby for international airlines, a more viable option for accommodating the terminal s domestic airline tenants. The primary benefit of common-use, with respect to domestic check-in facilities, would be greater ease and flexibility in making periodic reallocations to ensure efficient and well-balanced use of the facilities. Key assumptions used in developing these results are summarized below: A maximum queue time of 10 minutes was assumed as the level-of-service standard for all airlines. Average transaction time by type of processor: Average transaction time Type of processor (minutes per passenger)* Agent counter 2.0 to 10.0 Kiosk with baggage check 1.9 to 2.9 Kiosk without baggage check 1.3 Curbside 1.8 to 3.5 *Transaction times were determined by field survey and varied by airline; values shown are the ranges for all airlines. 3-9
61 Passenger check-in splits by type of processor: Type of processor Percent of originating passengers using* Agent counter 18% to 31% Kiosk with baggage check 30% to 43% Kiosk without baggage check 20% to 25% Curbside 2% to 3% Online/no checked bags** 14% to 24% *Varied by airline; values are the range for all airlines. **Passengers who bypass check-in and proceed directly to security screening. IATA space standards for check-in queue: Level of service* Square feet per passenger B 16 C 14 *With few carts and one or two pieces of luggage per passenger. The depth of the queuing area in front of the ticket counters is approximately 20 feet and the depth remaining for circulation is approximately 43 feet; these dimensions are shown on Figure Passenger Security Screening The requirements analysis for passenger security screening checkpoints focused on identifying the number of checkpoint lanes required and the area required for both document check queuing and primary queuing. These requirements are for checkpoints in the main terminal that serve originating passengers and employees. Requirements for checkpoints to serve transferring international passengers are included in Section 3.10, Federal Inspection Services Facilities. These requirements were developed using the same Comprehensive Airport Simulation Technology model runs described above for airline check-in requirements. Integrated modeling of check-in and passenger security screening functions allowed the capture of the metering effect that the check-in process has on passenger flows to downstream security screening checkpoints. Comprehensive Airport Simulation Technology was set up to solve for the number of lanes required to meet an assumed level-of-service standard (i.e., maximum wait time in queue) and to determine the maximum passenger accumulation in the document check queues and primary queues that would result if the indicated number of lanes were available. The maximum number of passenger queues was then converted to square footage requirements based on IATA level-of-service space standards. 3-10

62
63 The existing terminal has two security screening checkpoints, a north checkpoint serving Concourses D and E and a south checkpoint serving Concourses A, B, and C. Each checkpoint has eight screening lanes. The lanes are fed from a dedicated primary queue area located immediately upstream and equipped with stanchions. Documents are checked at stations located at the entrance to the primary queue. During peak periods, passenger queues form in front of the document check stations in the adjacent public circulation space. Results of the requirements analysis indicate that an additional checkpoint lane will be needed by 2017 and as many as five additional checkpoint lanes may be needed by As shown in Table 3-1, the additional capacity will be required at the south checkpoint, which accommodates a greater passenger volume than the north checkpoint. Increases in the space available for queuing will be required on both the north side and the south side. These results were determined assuming that future screening will continue to be performed at separate north and south checkpoints and that the current airline concourse allocations will be similar to today s allocations. It is recommended that the Port examine checkpoint options that incorporate new TSA technologies and processes that are expected to be adopted in the near future, once the specific details of the new technologies are available. Key assumptions used in developing these results are described below: A maximum queue time of 10 minutes is the level-of-service target for both primary queuing and document check queues, assuming a maximum combined wait time of 20 minutes during the peak period. The average throughput per checkpoint lane would be 175 passengers per hour. The average throughput per document check position would be 480 passengers per hour. Throughput rates for future years would remain at current levels. The TSA has indicated that new technologies and processes will be implemented at security checkpoints in the near future. Space requirements per checkpoint lane may increase by as much as 20%. Throughput rates per lane are also expected to increase; however, specific details have not been released. 3-12
64 IATA space standards for security inspection queues (the TSA does not dictate level of service standards for security queues; therefore, a range of IATA standards has been assumed): Level of service Square feet per passenger B 13 C 11 The checkpoints serve originating passengers and employees. Employees were assumed to account for approximately 9% of total flow volume. This assumption was developed by comparing actual TSA-provided magnetometer counts from August 2008 with originating passenger estimates for the same period. 3.5 Holdrooms The requirements analysis for the holdrooms focused on identifying the total holdroom area required for each gate based on the largest aircraft using the gate. These requirements were based on the gate modeling results discussed in Section 3.2. For each Gate Model run, the maximum-seat aircraft that was assigned to a gate was recorded and used as the basis for determining the required holdroom area using the following formula: Holdroom area required = S * LF * [(P seat * A seat) + (P stand * A stand)] * P max Where the values and descriptions of the variable are as follows: Variable Value Description S Varies Number of seats on the largest aircraft using the gate LF 85% Aircraft load factor P seat 80% Percent of holdroom occupants seated A seat 18 square feet Area required per seated occupant P stand 20% Percent of holdroom occupants standing A stand 13 square feet Area required per standing occupant P max Percent of flight s passenger load accumulated in the holdroom 67% 10 minutes prior to boarding 3-13
65 Results of the holdroom requirements analysis, aggregated by concourse, are summarized in Table 3-1. Holdroom areas required, by aircraft type and holdroom areas provided are summarized in Tables 3-2 and 3-3, respectively. Key findings are summarized as follows: Concourses B, C, and E. Overall holdroom space on these concourses will be sufficient throughout the planning period, except for the commuter holdroom serving Gates E6 through E13. A shift to smaller aircraft in the future planning schedules for the airlines using the jet gates on Concourses B (e.g., more aircraft similar to the 124 seat B and fewer aircraft similar to the 144 seat B ) and E (e.g., more aircraft similar to the 138 seat A-320 and fewer aircraft similar to the 182 seat B ) will result in an increasing surplus of holdroom space on these concourses. The existing surplus on Concourse C will diminish as the gates are more efficiently used, but the aircraft anticipated to use these gates would generally have smaller capacity than the existing holdrooms were designed to accommodate, so an overall space surplus will remain. The lower level holdroom on Concourse E that serves commuter aircraft at Gates E6 through E13 is currently deficient and will remain so in the future. To the extent that the number of commuter aircraft served from this holdroom increases, or the size of the aircraft served from this holdroom increases, the level of service provided will deteriorate. Concourse A. Holdroom space on Concourse A is currently deficient and will become more deficient in the future as larger capacity aircraft (e.g. the CRJ-900) anticipated in the planning schedules come into service. However, this deficiency is somewhat mitigated by adjacent concession spaces that provide passengers with alternative seating areas. Concourse D. Holdroom space on Concourse D is currently somewhat deficient and will become more deficient in the future. The current deficiency is caused by the larger capacity aircraft that typically use Concourse D gates. The increasing deficiency in the outer planning years shown in Table 3-1 is the result of increasing international operations that were assumed to be accommodated on this concourse. It was assumed that required new FIS gates identified in the gate modeling effort would be located on Concourse D and additional holdroom space for these new gates is included in the Concourse D holdroom requirements. 3-14
66 Table 3-2 HOLDROOM AREAS REQUIRED BY AIRCRAFT TYPE Aircraft Typical seats Holdroom area (a) (sq. ft.) EMB ERJ CRJ DH CRJ B ,326 A ,317 A ,336 B ,394 B ,520 B ,617 B ,762 B ,169 A ,353 B ,556 B ,808 (a) Holdroom area required was estimated based on the methodology described in Section 3.5 Holdrooms. 3-15
67 Table 3-3 HOLDROOM AREAS PROVIDED Concourse Gate Holdroom area (a) (sq. ft.) Concourse Gate Holdroom area (a) (sq. ft.) A C 6 1,674 A C 5 1,782 A C 4 1,979 A C 3 1,650 A 5 14 C 2 1,979 A C 1 1,650 A D 1 1,916 A D 2 2,132 A D 3 1,995 A D 4 2,132 A D 5 2,034 A D 6 1,754 A D 7 2,369 A D 8 1,754 B 1 1,567 D 9 2,369 B 2 1,567 D 10 1,265 B 3 1,567 D C 23 1,636 D 12 1,185 C 22 1,450 D 13 1,175 C 21 1,477 D 14 2,367 C 20 1,477 D C 19 1,833 E 1 2,199 C 18 1,837 E 2 2,306 C 17 1,655 E 3 1,355 C 16 1,658 E 4 1,780 C 15 1,655 E 5 1,952 C 14 1,671 E C 13 1,643 E C 12 1,905 E C 11 1,907 E C 10 1,951 E C 9 2,000 E C 8 1,951 E C 7 1,847 (a) Holdroom areas listed represent the areas available for passenger standing and seating; i.e., they do not include the areas necessary for ticket podiums or walkways to and from the loading bridge door. 3-16
68 3.6 Checked Baggage Security Screening The requirements analysis for this functional element focused on identifying the number of primary explosives detection system (EDS) machines that would be needed to accommodate the design-hour flow of originating baggage associated with each planning schedule. It was assumed that security screening of international recheck baggage would continue to be handled separately at the FIS facilities. Requirements for international recheck baggage security screening are included in the later discussion of FIS facilities requirements. The Port is currently implementing major improvements to provide an automated checked baggage sortation and security screening system on the terminal s lower level. The design provides for two separate screening zones serving the north and south halves of the terminal. Each screening zone will be equipped with four Analogic XLB 1100 machines for primary screening. Requirements for checked baggage security screening were assessed using Jacobs Consultancy s Flow Model. The Flow Model was used to generate design-day baggage flows for the north and south screening zones for each planning schedule. In developing these flows, airline-zone allocations were based on those described in the TSA design Report. EDS machine requirements for each zone were estimated based on the zone s projected peak-hour baggage flow, and a machine throughput equivalent to that of an Analogic XLB Results of the requirements analysis are presented in Table 3-1. The analysis indicated that the new automated checked baggage sortation and security screening system design will provide sufficient capacity through PAL 5 (2035). Key assumptions used in this analysis include the following: Airline-zone allocations were based on those described in the TSA Design Report. The throughput of one Analogic XLB 1100 would be 1,200 bags per hour. The number of checked bags per domestic passenger would be The number of checked bags per international passenger would be Consistent with TSA policy, to ensure system reliability, each zone would require an additional (i.e., redundant) machine beyond the total number of machines required to accommodate design-hour demand. 3-17
69 3.7 Outbound Baggage Makeup The requirements analysis for this functional element focused on identifying the maximum number of baggage carts that would need to be staged simultaneously at the baggage makeup carousels. The existing baggage makeup areas are located on the lower level of the main terminal. Several of these makeup areas are being modified and/or relocated as part of the in-line baggage system project currently under construction. Based on drawings in the TSA Design Report, when this project is completed, 11 separate makeup carousels will be provided 6 on the south side and 5 on the north side. All devices will be oval-shaped carousels. The maximum number of carts that could be simultaneously staged at each device was estimated by analyzing drawings in the TSA Design Report. In estimating these maximums, it was assumed that carts would be staged perpendicular to the device edge, as space allows, without encroaching into the circulation lanes. Each planning schedule s list of departing flights was analyzed to develop a profile of cart staging requirements at each makeup area at 10-minute intervals throughout the day. In developing these profiles, airlines were allocated to individual makeup areas based on information in the TSA Design Report. For each area, the peak count in the profile was used to determine the maximum number of carts that would need to be simultaneously staged at that area. The individual peaks were summed to provide aggregate counts for areas on the south and north sides. These aggregate counts are presented in Table 3-1. As shown in Table 3-1, it was estimated that deficiencies in cart staging capacity would occur in PAL 4 (2027) (12 positions) and PAL 5 (2035) (22 positions). It is possible that deficiencies such as these could be addressed by operational measures, such as limiting the number of carts per flight that are staged simultaneously, which would require more frequent cart rotation between the makeup areas and locations on the terminal apron. Key assumptions used in the analysis are listed below: The number of makeup carousels, their cart staging capacities, and airline allocations, were based on information contained in the TSA Design Report. Cart staging for a flight would begin 2 hours before scheduled departure time and end 15 minutes before scheduled departure time. The average capacity of one baggage cart would be 40 bags. 3-18
70 The average number of checked bags per domestic passenger would be 0.80 (this number could decrease with implementation of checked baggage fees; if so, demand in the outbound baggage makeup area would be reduced, offsetting the minor deficiencies in cart staging positions noted above). The average number of checked bags per international passenger would be 1.20 (this number could decrease with implementation of checked baggage fees; if so, demand in the outbound baggage makeup area would be reduced, offsetting the minor deficiencies in cart staging positions noted above). 3.8 Inbound Baggage Handling The requirements analysis for this functional element focused on identifying the linear footage of belt required for offloading inbound baggage by airline baggage handlers. The existing baggage claim devices are direct feed devices. Therefore, a section of frontage of each device is exposed to the public (i.e., presentation frontage) and a nonpublic section is exposed to baggage handlers (i.e., offload frontage). Requirements for this functional element were estimated based on a planning ratio of 0.30 foot of offload frontage for every foot of presentation frontage. Presentation frontage requirements are discussed in the following section. For reference, the average ratio of offload frontage to presentation frontage for the existing claim devices is approximately Results of the requirements analysis are presented in Table 3-1; as shown, based on the 0.30 planning ratio, minor deficiencies could occur in PAL 4 (2027) and PAL 5 (2035). 3.9 Domestic Baggage Claim The requirements analysis for this functional element focused on identifying the linear footage of claim device presentation frontage required for passengers claiming bags, and the required circulation area for passengers and visitors in the baggage claim area. The existing domestic baggage claim facilities are located on the lower level of the terminal and include nine separate baggage claim areas. Each area is equipped with a flat bed/direct feed baggage claim device. The devices are configured in a variety of T, L, and U shapes of different sizes. The devices are common-use, but airlines typically operate from a preferred device. The requirements analysis involved developing estimates of passenger flows to each baggage claim area for each planning schedule. In developing these area-specific passenger flows, device allocations were based on current airline preferences and assignments. The frontage and area required at each area was calculated based on the peak-hour passenger flow for the airlines allocated to that area. The individual requirements for each area were summed to provide aggregate totals for the terminal. These aggregate totals are presented in Table
71 As shown in Table 3-1, the analysis indicated that the existing domestic baggage claim facilities would provide sufficient capacity through PAL 5 (2035). Key assumptions used in the analysis include the following: Percentage of terminating passengers that would claim bags at domestic baggage claim: Domestic 60% International* 50% Claim device allocation begins: Domestic flights International flights 10 minutes after scheduled arrival time 35 minutes after scheduled arrival time The number of meeters/greeters per passenger at baggage claim would be The area required in the baggage claim area would be 18.0 square feet per occupant (IATA level-of-service C for baggage claim) The frontage required for queuing at the claim device edge would be 2.0 linear feet per passenger. The share of passengers claiming baggage and actively queuing at the edge of the device would be 75%. It was assumed that for every four passengers in the baggage claim area, three would be actively queuing at the device edge and one would be waiting in the peripheral area. The average dwell time per passenger at baggage claim would be 20 minutes. The active claim area and length of baggage belt available (i.e., frontage) at each of the nine baggage claim devices are shown on Figure 3-3. *100% of international passengers claim bags at the FIS facilities, located on level 1 of Concourse D. Upon exiting the FIS facilities, approximately 50% of passengers carry their bags with them on a shuttle to the main terminal, and 50% deposit their bags on a belt for transport to a domestic bag claim device where they are reclaimed a second time at the main terminal. Assuming a lag time to account for the fact that international passengers must first claim their baggage within the FIS facilities, exit the FIS facilities, and recheck their baggage before it can be transported to a domestic claim device located in the main terminal. 3-20
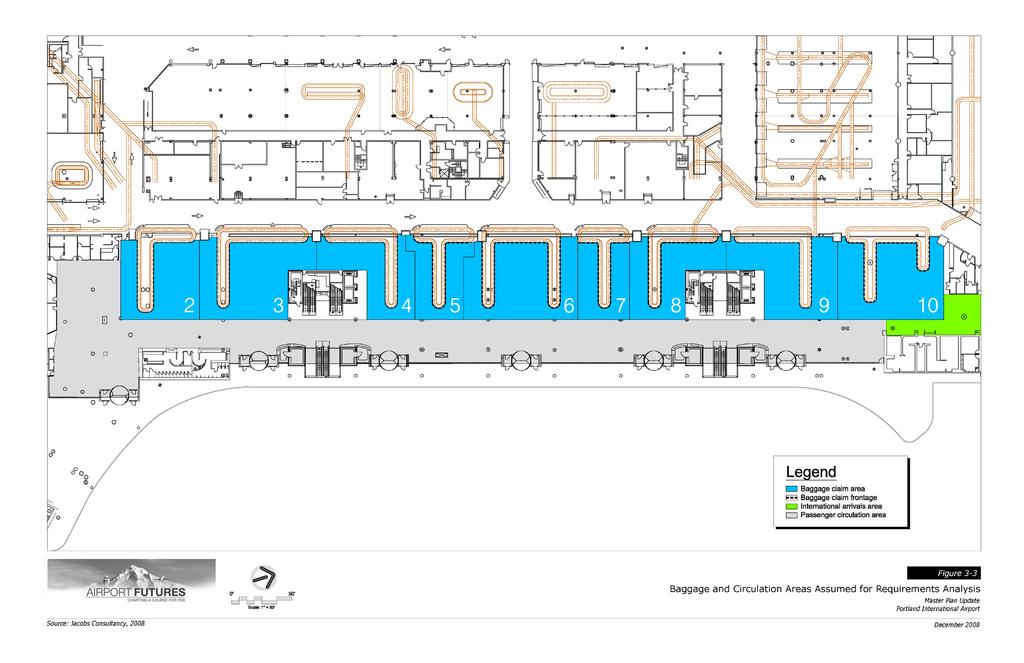
72
73 Several issues beyond the scope of this should be addressed in follow-on studies. These issues include the following: Managing meeters and greeters awaiting the arrival of international passengers Managing the needs (e.g., temporary check-in desks) of tour groups The potential need for additional or expanded baggage storage areas or baggage offices The effect on circulation of the flight information display screens located on level 1 at the bottom of the escalators The locations of the international arrivals area and general circulation space on level 1 of the terminal are shown on Figure Federal Inspection Services Facilities The FIS facilities provide a number of passenger and baggage processing functions for arriving international flights. The requirements analysis for FIS facilities focused on key functional components whose requirements are directly driven by passenger and baggage flow volumes and that account for a significant percentage of the total space requirements of the FIS facilities. Guidelines for these and other elements of the FIS are provided in the U.S. Customs and Border Protection s (CBP) August 2006 edition of Airport Technical Design Standards, Passenger Processing Facilities. The following key functional components described in the CBP design standards were addressed as part of the FIS facilities requirements analysis. Primary Processing. All arriving international passengers must be examined and screened by CBP officers at the primary processing area to determine nationality and/or admissibility to the United States. The requirements analysis for primary processing focused on identifying the number of processing booths and the amount of queuing area required for this function. Baggage Claim. After primary processing, passengers with checked baggage proceed to the international baggage claim area within the FIS facilities. Typically, all arriving international passengers have checked baggage to be reclaimed. The requirements analysis for international baggage claim focused on identifying the number of devices required and the amount of presentation frontage and peripheral/retrieval area required for each device. 3-22
74 Secondary Processing. The CBP identifies a subset of arriving international passengers as requiring additional processing and examination. These passengers, along with any baggage they have reclaimed, are directed or escorted to the CBP secondary processing area located downstream from baggage claim. The following component elements of secondary processing were addressed in the requirements analysis: Secondary Queue Area. All passengers directed to secondary processing by a CBP officer must queue up, with their baggage, in front of a triage podium. At the triage podium, a CBP officer examines the passenger and determines whether further inspection is required. Passengers requiring further inspection are designated as referral passengers. Referral Passenger Waiting Area. Referral passengers and their baggage are provided with a waiting area located upstream of the secondary exam stations. Secondary Exam Stations. At these stations, CBP officers conduct more extensive inspections of passenger documents and baggage. There are two standard types of secondary exam stations: a larger station that includes an x-ray machine, and a slightly smaller station without an x-ray machine. Each station accommodates two CBP officers. Security Screening. Arriving international passengers and baggage that are transferring to another flight after exiting the FIS facilities are subject to the same security screening processes as originating passengers and baggage. The requirements analysis focused on identifying the number of passenger security screening checkpoint lanes and the number of primary EDS machines for baggage screening that would be required. The existing FIS facilities are located at the end of Concourse D on the lower level. Currently, six gates provide access to the FIS facilities by means of a sterile corridor, stairs, and elevators. These gates can also be used for domestic flights. Doors within the sterile corridor can be closed to isolate arriving international passenger flows from nonsterile passenger flows. Based on observation and discussion with Port staff, the following issues were noted with respect to the existing FIS facilities prior to conducting the requirements analysis: The queue area available for primary processing is technically compliant with CBP design guidelines. However, the existing stairs and escalators feed this area from the side, reducing the effective area that can be used for queuing. The Port has developed options for relocating the circulation core to allow the queue area to be fed from the back. 3-23
75 There are two baggage claim devices at the FIS facilities. This number is sufficient to handle two simultaneous arrivals, which is the current peak requirement. However, the devices are undersized for the size of aircraft they serve. The peripheral and retrieval areas around the devices are similarly undersized. In addition, the devices are spaced with about 27 feet from edge to edge, leaving little room for a circulation zone between the devices. Terminating passengers exiting the FIS facilities travel to the main terminal/landside via a shuttle bus with a drop-off point near Gate D1. The shuttle bus allows terminating passengers to avoid the walking distance and processing through TSA passenger security screening that would otherwise be necessary. Passengers have the option of carrying their baggage with them on the shuttle bus. Alternatively, baggage can be placed on a belt in the FIS facilities where it is picked up by airline baggage handlers and conveyed to a domestic baggage claim device in the main terminal. The Port has examined a scheme for providing a dedicated pedestrian corridor between the FIS facilities and the main terminal at the lower level of Concourse D to replace the shuttle bus. Key assumptions used in FIS requirements analysis include the following: 46% of peak-hour international passengers would be transferring to another flight. Each primary processing module provides a throughput of 100 passengers per hour and requires 862 square feet of queuing area.* 5% of passengers would be directed to secondary processing; 50% of these passengers would be referred to an exam station.* The required queuing area for secondary processing and the exam station would be 25.0 square feet per passenger. Results of the requirements analysis are presented in Table 3-1. Key findings of the analysis are summarized below. The existing baggage claim devices and areas are undersized. The largest aircraft served by the devices today is the A with 247 seats. The existing devices provide 145 linear feet of presentation frontage. The estimated frontage per device that would provide an acceptable level-of-service for this size aircraft is 210 linear feet. Similarly, 2,970 square feet for the retrieval and *Source: U.S. Customs and Border Protection, Airport Technical Design Standards, Passenger Processing Facilities, August
76 peripheral area for each device should be provided versus the existing 2,520 square feet. By PAL 2 (2017) one additional primary processing module and queuing area and a third baggage claim device will be required. Based on the planning schedules, beginning in PAL 2 (2017) and continuing through PAL 5 (2035), the international arrivals peak-hour will include three widebody aircraft, which is one more than the current peak. This roughly translates to a 50% increase in peak-hour passengers, which will require one additional primary processing module and additional queue space plus a third baggage claim device. The amount of secondary queuing space is currently deficient. The deficiency will increase with the addition of a third widebody arrival in the peak hour. The referral waiting area and secondary exam stations will be sufficient throughout the planning period. The number of EDS machines currently provided for screening international recheck baggage is deficient. One Reveal CTX-80 machine is provided; it is estimated that three machines of this type are currently required. There is a surplus number of security lanes currently provided for screening international transfer passengers. Four lanes are currently provided; it is estimated that two lanes will be sufficient throughout the planning period Concessions is one of a few airports in North America that have been developed with a significantly higher than average amount of concessions space per passenger. These few airports generate sales per passenger that significantly exceed the average and are recognized in the industry as having very successful concessions programs. An analysis of concessions requirements is outside the scope of this master plan update. However, it is acknowledged that the concessions program is central to the Port s goal of maintaining and enhancing the Airport s reputation as one of the nation s premier airports. The concession program at the Airport is unique; its requirements have evolved with the program s development and therefore cannot be characterized solely on the basis of square footage. Instead, the requirements are based on a range of considerations including layout, function, product spacing, circulation and visibility. 3-25
77 While Concourse C has been identified as having an ideal mix of concessions space relative to other concourse functions, it is recognized that a number of constraints (e.g., apron depth, existing structures, passenger circulation and changes in airline space needs and layout) may limit the ability to create this ideal situation on other concourses. Gate utilization and passenger processing have a direct relationship to concessions requirements. Therefore, as the Airport evolves, the concessions program requirements should be refined through further careful study. Furthermore, future concessions development and redevelopment should be considered during the design of any new or modified terminal facilities (e.g., modifications to correct existing circulation and holdroom deficiencies in Concourses A, B and E). 3-26
78 4. GROUND TRANSPORTATION AND PARKING Ground transportation and parking requirements at are primarily based on (a) the assessment of 2008 peak period activity, as described in Section 5.3 of Technical Memorandum No. 1 Inventory of Existing Conditions and (b) the projected need for each type of ground transportation facility to accommodate forecast peak period activity, as presented in Technical Memorandum No. 2 Aviation Demand Forecasts, at an acceptable level-of-service. The definition of acceptable level-of-service for each facility type is provided in the appropriate subsections below. For all facilities, the existing Airport configuration was assumed in determining future requirements. If alternative configurations (e.g., two independent terminal areas, more than one principal access route) are considered during the alternatives development and analysis process, certain requirements may need to be modified to reflect the new configuration. 4.1 Key Assumptions Affecting Ground Transportation and Parking Requirements In general, ground transportation and parking facilities requirements are based on (a) the level of activity to be accommodated, (b) the level-of-service goal for that activity, and (c) functional requirements for specific modes or vehicle types. For almost all travel modes, the level of activity was assumed to increase in direct proportion to growth in annual passenger activity at the Airport. While demand for ground transportation and parking facilities is closely tied to the hourly and daily airline flight schedules, the aviation demand forecasts and flight schedules show no major changes to the existing monthly, daily, and hourly distribution of passenger activity. The other key assumption governing future facility requirements is the various access modes (also known as mode choice ) assumed for future years. Historical mode choice data are summarized in Table 4-1. It is possible that, during the planning period of this, these mode choices may change as passengers adapt to changes in the regional transportation system (e.g., the introduction of new modes or elimination of existing modes serving the Airport, vehicle operating costs, transit coverage and schedules, changes in regional freeway congestion). However, the mode choice data presented in Table 4-1 represents the share of total annual originating and terminating passengers using each mode in the years shown. As requirements for ground transportation facilities are typically driven by peak hour or daily demands, they may not be proportionally affected by changes in the annual mode choice distribution. For purposes of determining the ground transportation and parking facilities requirements at the Airport through PAL 5 (2035), it was assumed that mode choices from 2006 were appropriate and that future changes in passenger mode choice and the resulting changes in requirements would be explored through sensitivity testing during the alternatives analysis. 4-1
79 Table 4-1 HISTORICAL AIRLINE PASSENGER MODE CHOICE DATA Mode 1997/ Private vehicle picked up or dropped off (a) 41% 66% (b) 54% (b) 61% (b) Private vehicle parked for duration of trip 17 Rental car Taxicab/limousine Shuttles (c) Tri-Met (MAX light rail transit after 2001) Other (a) Includes vehicles parked in the Airport s parking facilities for short durations (less than 2 hours). (b) Passenger survey data prior to 2006 do not distinguish between vehicles parked for the duration of an airline trip versus those parked while picking up or dropping off passengers. (c) Includes shared-ride (door-to-door) vans, buses, and courtesy vehicles operated by hotels and motels. Source: Port of Portland, Research and Marketing Department. 4.2 Access Roadways and Intersections This section focuses on key terminal access intersections and roadways and their ability to accommodate motor vehicle traffic to and from the Airport in the future. Other key intersections on or near the Airport are discussed in Section The facilities discussed in this section (and shown on Figure 4-1) include seven intersections and two major roadways, NE Airport Way (from approximately NE 82nd Avenue to Interstate 205) and NE 82nd Avenue (from approximately NE Airport Way to NE Columbia Boulevard). These intersections and roadways were evaluated to determine their ability to accommodate the demand forecast for PAL 1 (2012), PAL 2 (2017), PAL 3 (2022), PAL 4 (2027), and PAL 5 (2035) and to determine when a facility may become deficient and the potential capacity improvements that may be required. 4-2
80 AIRTRANS WY 102ND AV Portland International Airport AIRPORT Columbia FRONTAGE RD CORNFOOT COLUMBIA PORTLAND HWY KILLINGSWORTH ST LEGEND Airtrans Center AV WY RD CASCADE PKWY RD River 82ND 63RD AV BLVD HOLMAN AV MARX DR 105TH AV 92ND CULLY BLVD - Study Area Roadway Columbia Portland International Center Slough I ING MARINE DR GLEN W D ALDERWOOD SANDY BLVD - Study Area Intersection 1 MT. HOOD AV X PDX610 Fig4-1.ai Figure 4-1 Terminal Access Intersections and Roadways MAP NOT TO SCALE Source: Port of Portland
81 4.2.1 Baseline Conditions Baseline conditions for the seven intersections and two roadways are discussed below. Intersections The study area intersections were analyzed to identify their current performance, and to compare that performance against adopted intersection operational standards based on delay and capacity. The Oregon Department of Transportation (ODOT) adopted standards for highway mobility as part of its 1999 Oregon Highway Plan* (as amended January 2006), requiring operation at or below a volume-to-capacity (V/C) ratio of 0.99 during each of the busiest two consecutive hours of weekday traffic. The City of Portland requires intersections to operate at a level-of-service (LOS) D or better for signalized intersections, and LOS E or better at unsignalized intersections, as determined by the amount of delay experienced during the design hour. The Port of Portland also applies the City of Portland s mobility standards to Port-owned roadways. Volume-to-capacity ratios are comparisons of the actual motor vehicle volumes using the intersection (or a particular movement) to the maximum volume that could be served. For example, if the calculated V/C ratio at an intersection is 0.85 during the afternoon peak hour, approximately 85% of the available capacity at that intersection is being used. It is expected that V/C ratios for existing conditions would be at or below 1.0 during the peak hour. When an intersection approaches a 1.0 ratio, that intersection is very heavily used and typically will become very congested Intersections with V/C ratios over 1.0 typically have long vehicle delays and queues that do not clear in one signal cycle. This congestion can lead to other delays and queuing upstream of the intersection. Instead of using a V/C ratio to measure the level of mobility (or available capacity) at an intersection, the City of Portland uses a level-of-service performance standard based on the average delay experienced by vehicles at the intersection. Levels-of-service A, B, and C indicate conditions in which traffic moves without significant delays during periods of peak hour demand. LOS D and E are progressively worse peak hour operating conditions. LOS F represents long delays and vehicle queues and is commonly considered to be a failing condition. Table 4-2 presents the range of average per-vehicle delays (in seconds) corresponding with each LOS. *Oregon Department of Transportation, 1999 Oregon Highway Plan, originally adopted March 18, 1999; including amendments through January
82 Table 4-2 LOS CRITERIA FOR SIGNALIZED AND UNSIGNALIZED INTERSECTIONS Control Delay per Vehicle (seconds) LOS Signalized Unsignalized A B > > C > > D > > E > > F Source: Transportation Research Board, National Research Council, Highway Capacity Manual, December Traffic patterns at the study area intersections are influenced by both terminal-related traffic and non-terminal related traffic (i.e., local area commute or background traffic). Terminal-related traffic typically is greatest during the midday peak period between 11:00 a.m. and 2:00 p.m. whereas local area traffic typically is greatest during the afternoon peak period between 4:00 p.m. and 6:00 p.m. Depending on the share of total traffic accounted for by terminal-related traffic, peak period activity at an intersection could occur during the midday peak period or during the afternoon peak period. Accordingly, traffic was forecast for both the afternoon and midday peak periods for all planning periods; requirements were based on the peak period. Table 4-3 summarizes the baseline operating conditions at the study area intersections shown on Figure
83 Table 4-3 SUMMARY OF EXISTING (2007) AFTERNOON PEAK PERIOD OPERATING CONDITIONS AT KEY STUDY AREA INTERSECTIONS Intersection Delay (seconds) LOS V/C Operational standard 1 NE Airport Way/NE 82nd Avenue 11.9 B 0.62 D 2 NE Mt. Hood Avenue/NE Airport Way eastbound 5.5 A 0.45 D 3 NE Mt. Hood Avenue/NE Frontage Road 6.5 A 0.23 D 4 NE Frontage Road/NE Airport Way westbound 15.7 C 0.13 E 5 NE Airport Way/I-205 northbound on ramp 28.8 C NE Airport Way/I-205 southbound off ramp 14.3 B NE 82nd Avenue/NE Alderwood Road 52.9 D 0.59 D Note: Peak period traffic occurs between 4:00 p.m. and 6:00 p.m. at all study area intersections except NE 82nd Avenue/NE Airport Way where the peak period traffic occurs between 11:00 a.m. and 2:00 p.m. Delay = Average intersection delay in seconds (calculated using 2000 Highway Capacity Manual methodology) LOS V/C Source: = Level of service (calculated using 2000 Highway Capacity Manual methodology) = Volume-to-capacity ratio (calculated using 2000 Highway Capacity Manual methodology) DKS Associates, September 2008, based on traffic counts provided by the Port of Portland and Oregon Department of Transportation. Data collected on multiple days throughout 2007 were combined and adjusted to represent the 30th busiest hour of the year. As shown in Table 4-3, existing operations at these intersections meet the governing operational standards. In addition, the intersection of NE Airport Way/Interstate 205 northbound is approaching the V/C mobility standard, primarily due to eastbound left turns and westbound right turns accessing the interstate. During severe conditions, queuing along NE Airport Way (resulting from I-205 northbound ramp congestion preventing the eastbound left and westbound right turns) has been observed to extend to NE 82nd Avenue to the west and to 122nd Avenue to the east (over 7,000 feet and 4,000 feet, respectively). As results of the delay analysis present the average delay experienced by all traffic at an intersection, delay for specific movements, such as the two turns onto I-205, could be worse than for the intersection as a whole. 4-6
84 Roadways For the two major access roadways, traffic counts were conducted to establish a 24-hour volume profile. These data, presented on Figures 4-2 and 4-3, were used to determine the variations in motor vehicle volumes accessing the terminal along the key approach roadways throughout the day. Figure 4-2 DAILY VEHICLE VOLUME PROFILE: NE AIRPORT WAY, WEST OF INTERSTATE 205, TYPICAL BUSY DAY IN 2007 Eastbound Westbound 2,500 2,000 Vehicle Volume 1,500 1, :00 1:00 2:00 3:00 4:00 5:00 6:00 7:00 8:00 9:00 10:00 11:00 12:00 13:00 14:00 15:00 16:00 17:00 18:00 19:00 20:00 21:00 22:00 23:00 Time of Day Time of Day Note: Vehicle volumes were measured on NE Airport Way between NE Mount Hood Avenue and NE 82nd Avenue. 4-7
85 Figure 4-3 DAILY VEHICLE VOLUME PROFILE: NE 82ND AVENUE, SOUTH OF NE AIRPORT WAY, TYPICAL BUSY DAY IN 2007 Northbound Southbound Vehicle Volume :00 1:00 2:00 3:00 4:00 5:00 6:00 7:00 8:00 9:00 10:00 11:00 12:00 13:00 14:00 15:00 16:00 17:00 18:00 19:00 20:00 21:00 22:00 23:00 Time of Day Time of Day Note: Vehicle volumes were measured on NE 82nd Avenue between Air Cargo Road and NE Alderwood Road. Both of these roadways exhibit typical commuter traffic patterns with peak directional flows in both the morning and afternoon peak periods. In this case, NE Airport Way has a westbound (toward the terminal) peak in the morning, and then an eastbound (toward Interstate 205) peak in the afternoon. Conversely, NE 82nd Avenue has a southbound (away from the terminal) peak in the morning and a northbound (toward Interstate 205) peak in the late afternoon. This pattern is most likely due to regional trips (not Airport terminal trips) accessing Interstate 205 via NE Airport Way and NE 82nd Avenue Methodology Metro, the regional planning agency, maintains a travel demand model for the Portland metropolitan area that includes land uses for both the base year as defined by Metro (2005) and future year (2035). These land uses are grouped into smaller focused areas called transportation analysis zones that are usually bordered by natural or manmade obstructions, such as rivers, freeways, topographical features, railroads, and other obstructions. The land uses generate motor vehicle trips that access the roadway 4-8
86 network and traverse the network through intersections to their final destinations. This regional travel demand model was used as the basis for determining future traffic forecasts at study area intersections. The methodology for projecting future traffic along the roadways and at the signalized (and unsignalized) intersections incorporated existing motor vehicle volumes, base case travel demand model vehicle volumes, and future travel demand model vehicle volumes. This methodology minimized the effects of model error by adding the incremental growth projected by the travel demand model (modeled 2035 vehicle volumes minus the modeled vehicle volumes for existing base year 2005 conditions) to the base year motor vehicle volumes. Therefore, intersection approach and departure volumes used in the LOS calculations have been adjusted and may not exactly match raw model volumes produced by the regional travel demand model. After developing the 2035 vehicle volumes, volumes for the interim assessment years (2012, 2017, 2022, and 2027) were established by interpolating between the 2005 and 2035 volumes. Future traffic includes not only Airport area growth, but also background regional growth. Background growth (non-airport area) was estimated using the Metro travel demand model for 2005 and The 2035 forecast growth in traffic (subtracting Airport-area uses) was compared to the existing 2005 model (subtracting Airport-area uses) to determine background traffic growth at the key intersections. This growth was then reflected in the traffic analysis for each intersection. The capacity of the study area intersections was analyzed using the traffic analysis software Synchro, which uses the methodology in the 2000 Highway Capacity Manual.* In addition to this methodology, existing morning and afternoon peak hour motor vehicle volumes (collected in 2007) were adjusted to represent the 30 th -busiest vehicle hour of the year. To reflect intermediate analysis years between 2005 and the end of the planning period for this (2035), a straightlining methodology was used, which prorates the volumes from the end of the planning period back to the base year on a per year basis. Therefore, incremental growth occurs on all motor vehicle movements at an intersection based on the per year growth in activity. This methodology was used for all study area intersections with the exception of NE 82nd Avenue/NE Airport Way because of the proximity to the terminal and the fact that passenger activity (which directly relates to motor vehicle activity) does not increase uniformly over the planning period. Therefore, the growth in motor vehicle activity to/from the terminal through this intersection was assumed to increase at the same rate as the forecast for airline passengers. *Transportation Research Board, National Research Council, Highway Capacity Manual, Washington, D.C., December
87 When evaluating the future study area constraints relating to facility requirements, the controlling bottlenecks in the area that drive potential capacity improvements are typically the signalized (or unsignalized) intersections, and not typically the roadways themselves. However, the roadways were analyzed for their ability to accommodate motor vehicles transitioning from one travel path to another (also known as weaving) particularly between I-205 and the Mt. Hood interchange along NE Airport Way Future Intersection Facility Requirements The following summarizes the results of the capacity and requirements analysis for the terminal access intersections and roadways. Capacity constraints were identified if (a) an intersection does not meet a jurisdictional mobility standard for either delay (i.e., LOS) or volume-to-capacity or (b) the V/C ratio for a critical movement at the intersection exceeds 1.0 during the afternoon peak hours. For identified capacity constraints, recommendations are provided to mitigate the deficiency. The levels of service represented on the following tables reflect conditions assuming implementation of the recommended action. NE 82nd Avenue/NE Airport Way (Figure 4-1, Intersection 1) This signalized intersection delineates the point at which motor vehicles enter or exit the terminal area roadway system. When severe congestion occurs, vehicle access to and from the terminal is not reliable. Currently, NE Airport Way has three eastbound and three westbound travel lanes that traverse through the signal at this intersection. In addition, the TriMet MAX light rail system operates on the south side of this intersection with 15-minute headways, which affect the westbound left turn, the northbound approach, and the eastbound right turn. The limiting factor at this intersection is the eastbound through traffic because it must stop more frequently than the westbound traffic. Eastbound traffic stops for the westbound traffic turning left as well as northbound traffic while the westbound traffic only stops for the northbound left turning movement. An additional through travel lane is currently under construction in each direction along NE Airport Way through this intersection, which will result in a total of six travel lanes (three lanes in each direction). This construction is scheduled for completion by the end of Unlike intersections typically experiencing commute traffic patterns, a midday peak period occurs at this intersection (between 11:00 a.m. and 2:00 p.m.), with more eastbound/westbound traffic than during the afternoon peak period (occurring between 4:00 p.m. and 6:00 p.m.). This peaking activity occurs because terminal-related traffic, which peaks during the midday, accounts for a large share of the traffic using the intersection. For this reason, traffic during all intervening planning periods was forecast for both the afternoon and midday peak periods. (No other study area intersections share this characteristic because the background traffic traffic not associated with the terminal at other intersections peaks during the 4:00 p.m. to 6:00 p.m. period, 4-10
88 increasing traffic levels above those experienced during the midday peak.) Table 4-4 summarizes the operations at this intersection for future planning years. Table 4-4 SUMMARY OF CAPACITY AND REQUIREMENTS ANALYSIS NE 82ND AVENUE/NE AIRPORT WAY PAL (Forecast Year) LOS (a) V/C Facility Requirements Afternoon Peak Period (4 p.m. - 6 p.m.) PAL 1 (2012) (b) B 0.74 No additional requirements PAL 2 (2017) (c) C 0.84 Implement grade-separated interchange PAL 3 (2022) (c) C 0.87 No additional requirements PAL 4 (2027) (c) C 0.91 No additional requirements PAL 5 (2035) (c) D 0.96 No additional requirements Midday Peak Period (11 a.m. - 2 p.m.) PAL 1 (2012) (b) D 0.91 No additional requirements PAL 2 (2017) (c) C 0.82 Implement grade-separated interchange PAL 3 (2022) (c) C 0.85 No additional requirements PAL 4 (2027) (c) C 0.88 No additional requirements PAL 5 (2035) (c) D 0.93 No additional requirements Note: Level-of-service standard is LOS D. V/C standard is LOS = Level of service V/C = Volume-to-capacity ratio (a) Assuming implementation of projects to meet facility requirements. (b) Assuming three lanes in both eastbound/westbound directions on NE Airport Way. (c) Assuming diamond configured grade-separated interchange (due to midday peak initially). Source: DKS Associates, September Based on the analysis summarized in Table 4-4, the intersection of NE 82nd Avenue/ NE Airport Way becomes capacity constrained during the midday peak hour before the afternoon peak hour, and is forecast to need additional capacity at PAL 2 (2017). One potential improvement in the Regional Transportation Plan, on the list of projects that are Financially Constrained, is a grade-separated interchange at this location. This interchange would provide for unimpeded travel eastbound and westbound on NE Airport Way while northbound/southbound traffic on NE 82nd Avenue would use the signalized interchange ramps. With this configuration, the higher midday traffic on NE Airport Way would not affect the signalized operations of the interchange and the two signals would operate at LOS D (or better) and V/C 0.96 (or better) by PAL 5 (2035), meeting both the City of Portland and the Port of Portland mobility standards. 4-11
89 Mt. Hood Interchange Area (Figure 4-1, Intersections 2, 3, and 4) This area consists of three intersections (one signal controlled, one unsignalized, and one roundabout). The interchange is the primary access point for both the Portland International Center (PIC) and the economy parking lots (Blue and Red). This analysis did not include changes in vehicle volumes that could result from any significant addition to the economy parking lots or changes in surrounding land uses along the frontage road, but the future retail and office land use buildout of the PIC area was considered. Table 4-5 summarizes the results of the capacity and requirements analysis for this area. Table 4-5 SUMMARY OF CAPACITY AND REQUIREMENTS ANALYSIS MT. HOOD INTERCHANGE AREA PAL (Forecast Year) LOS V/C Facility Requirements Mt. Hood Avenue/NE Airport Way eastbound (signal control) (Figure 4-1, Intersection 2) PAL 1 (2012) A 0.76 No improvement necessary PAL 2 (2017) A 0.78 No improvement necessary PAL 3 (2022) A 0.81 No improvement necessary PAL 4 (2027) A 0.83 No improvement necessary PAL 5 (2035) B 0.95 No improvement necessary NE Frontage Road/NE Airport Way westbound (unsignalized) (Figure 4-1, Intersection 3) PAL 1 (2012) C 0.15 No improvement necessary PAL 2 (2017) C 0.16 No improvement necessary PAL 3 (2022) C 0.17 No improvement necessary PAL 4 (2027) C 0.19 No improvement necessary PAL 5 (2035) C 0.21 No improvement necessary NE Frontage Road/Mt. Hood Avenue (roundabout) (Figure 4-1, Intersection 4) PAL 1 (2012) A 0.25 No improvement necessary PAL 2 (2017) A 0.26 No improvement necessary PAL 3 (2022) A 0.27 No improvement necessary PAL 4 (2027) A 0.29 No improvement necessary PAL 5 (2035) B 0.32 No improvement necessary Note: Level-of-service standard is LOS D. V/C standard is LOS = Level of service V/C = Volume-to-capacity ratio Source: DKS Associates, September
90 As shown in Table 4-5, these intersections have available capacity to accommodate future traffic demand. However, a significant increase in economy parking capacity could result in hourly traffic volumes exceeding the capacity of one or more of these intersections. As a sensitivity test for motor vehicle operations, net new motor vehicle trips associated with the potential expansion of the economy parking lots were added to the interchange area to determine potential facility requirements. This sensitivity test was conducted using existing ratios for current parking supply and trips generated during the afternoon peak period. The analysis indicates available capacity at the roundabout and the unsignalized intersection to accommodate expected growth in parking supply (up to 10,000 new stalls by PAL 4 (2035); however, the signalized intersection would not meet operational standards (LOS D) with this potential expansion. Improvements to accommodate this level of parking expansion could include an additional southbound left turn lane at this intersection. This additional left turn could affect the width of the overpass of NE Airport Way. It does appear that, by 2027, the intersection could accommodate future expansion of economy lots parking supply (approximately 6,800 net new parking stalls). NE Airport Way/I-205 Interchange Area (Figure 4-1, Intersections 5 and 6) This area consists of two signalized intersections and provides access to and from NE Airport Way and Interstate 205. As previously mentioned, capacity constraints exist at times with the eastbound left turn and the westbound right turn to access Interstate 205 northbound. For PAL 1 (2012) and beyond, an additional southbound off-ramp right turn pocket was assumed at this intersection. This improvement is currently being constructed and is expected to be operational by early Table 4-6 summarizes the results of the capacity and requirements analysis for this area. The volume-to-capacity ratios shown in Table 4-6 indicate that only the northbound intersection would have a capacity constraint in the future. The northbound access would be constrained by the combined eastbound left turns and westbound right turns from NE Airport Way by PAL 1 (2012). Previous studies indicated two additional requirements at the interchange. The first is the need for an additional southbound right turn from the I-205 off ramp to westbound NE Airport Way. The second is the need to relocate the eastbound to northbound I-205 access. ODOT is currently conducting a study to determine and evaluate alternatives associated with relocating this movement via a flyover, loop-ramp, or some other means. Addressing the eastbound left turning movement at this intersection would allow for adequate intersection operations during the afternoon peak period through PAL 5 (2035). 4-13
91 Table 4-6 SUMMARY OF CAPACITY AND REQUIREMENTS ANALYSIS NE AIRPORT WAY/I-205 INTERCHANGE AREA PAL (Forecast Year) LOS V/C Facility Requirements NE Airport Way/Interstate 205 southbound intersection (Figure 4-1, Intersection 6) (a) PAL 1 (2012) B 0.64 No improvement necessary PAL 2 (2017) C 0.69 No improvement necessary PAL 3 (2022) C 0.75 No improvement necessary PAL 4 (2027) D 0.81 No improvement necessary PAL 5 (2035) C 0.92 No improvement necessary NE Airport Way/Interstate 205 northbound (Figure 4-1, Intersection 5) (b) PAL 1 (2012) A 0.54 The eastbound left turn movement requires improvement to provide for adequate operations PAL 2 (2017) A 0.61 The eastbound left turn movement requires improvement to provide for adequate operations PAL 3 (2022) A 0.65 The eastbound left turn movement requires improvement to provide for adequate operations PAL 4 (2027) A 0.69 The eastbound left turn movement requires improvement to provide for adequate operations PAL 5 (2035) A 0.76 The eastbound left turn movement requires improvement to provide for adequate operations Note: Level-of-service standard is LOS D. V/C standard is LOS = Level of service V/C = Volume-to-capacity ratio (a) Assuming second southbound right turn. (b) Assuming improvements for eastbound to northbound movement that would remove it from signalized operations. Source: DKS Associates, September NE 82nd Avenue Intersection/NE Alderwood Road (Figure 4-1, Intersection 7) Similar to the Mt. Hood interchange signalized intersection, this intersection is a major access point to and from the PIC, as well as being located on a key roadway providing access to the terminal area. This intersection includes improvements from the conditions that are currently being planned or constructed and would be in place by PAL 1 (2012). These improvements include modifying the eastbound approach geometry to include two left turn lanes, one through lane, and a separate right turn pocket (i.e., a limited-length lane that allows automobiles to wait for a turning opportunity without blocking through traffic). The westbound approach geometry would be similar with dual left turn lanes, one through lane, and a separate right turn pocket. The southbound approach would include a left turn lane, two through lanes, and a separate right turn pocket. Table 4-7 summarizes 4-14
92 the results of the capacity and requirements analysis for this intersection with these improvements in place for the various planning years. Table 4-7 SUMMARY OF CAPACITY AND REQUIREMENTS ANALYSIS NE 82ND AVENUE/NE ALDERWOOD ROAD INTERSECTION PAL (Forecast Year) LOS (a) V/C Facility Requirements PAL 1 (2012) C 0.61 No additional requirements PAL 2 (2017) D 0.70 No additional requirements PAL 3 (2022) D 0.81 No additional requirements PAL 4 (2027) D 0.91 No additional requirements PAL 5 (2035) D 0.97 Adjust signal timing to increase cycle length Note: Level-of-service standard is LOS D. V/C standard is LOS = Level of service V/C = Volume-to-capacity ratio (a) Assuming implementation of projects to meet facility requirements. Source: DKS Associates, September By PAL 5 (2035), the signal cycle length would need to be lengthened to accommodate slightly longer phases to serve additional demand. This longer cycle length would allow the intersection to meet the mobility standard for delay and maintain a V/C ratio below Future Roadway Facility Requirements As noted above, NE Airport Way and NE 82nd Avenue are the two major roadways providing access to and from the terminal area. In addition to capacity constraints created by intersections along those roadways, the roadways were evaluated to determine whether or not weaving movements affect roadway capacity. It was concluded that no significant weaving activity occurs on NE 82nd Avenue, but that weaving movements on NE Airport Way between the Mt. Hood interchange and Interstate 205 could affect roadway operations. For NE Airway Way between NE 82nd Avenue and the Mt. Hood interchange, it was determined that conditions at the intersections would have a larger impact on roadway level of service than would weaving activity on NE Airport Way. Table 4-8 summarizes the results of the capacity and requirements analysis for the eastbound and westbound weaving movements on the section of NE Airport Way between the Mt. Hood interchange and I-205. The eastbound weaving area on NE Airport Way may also be influenced by the eastbound left turn leading to the I-205 northbound on-ramp. Capacity constraints for this turning movement result in queues that extend into the weaving area. Because the eastbound left turn deficiency is 4-15
93 addressed as part of a separate analysis, the weaving operations on NE Airport Way were evaluated independent of the surrounding intersections. Table 4-8 SUMMARY OF WEAVING OPERATIONAL ANALYSIS NE AIRPORT WAY, EASTBOUND AND WESTBOUND PAL (Forecast Year) LOS Speed Facility Requirements Eastbound Mt. Hood Avenue to I-205 PAL 1 (2012) B 36mph No improvement necessary PAL 2 (2017) C 35mph No improvement necessary PAL 3 (2022) D 34mph No improvement necessary PAL 4 (2027) D 33mph No improvement necessary PAL 5 (2035) E 32mph May explore opportunity to braid ramps Westbound I-205 to Mt. Hood Avenue 2007 A 38mph No improvement necessary PAL 1 (2012) B 37mph No improvement necessary PAL 2 (2017) B 36mph No improvement necessary PAL 3 (2022) B 35mph No improvement necessary PAL 4 (2027) B 34mph No improvement necessary PAL 5 (2035) C 33mph No improvement necessary Note: Level-of-service standard is LOS D. LOS = Level of service (based on average speed on roadway) mph = Miles per hour Source: DKS Associates, September As shown in Table 4-8, improvements may be necessary by PAL 5 (2035) to meet the mobility standards for eastbound weaving operations. These improvements may include improved operations at the NE Airport Way/Interstate 205 interchange, which, as noted earlier in the discussion of this interchange, is the subject of an ongoing study of potential interchange improvements intended to address existing and future deficiencies at the signalized intersections. 4.3 Terminal Area Roadways This section focuses on key terminal area roadways and the number of lanes needed to accommodate future peak period vehicle volumes at an acceptable level of service. The roadway links evaluated include: NE Airport Way, west of NE 82nd Avenue P-1 access road Approach to enplaning level curbside Approach to deplaning level curbside 4-16
94 Departure from enplaning level curbside Departure from deplaning level curbside Parking exit roadway (east of the exit plaza) Terminal exit roadway Return-to-terminal roadway Terminal area exit roadway Level-of-Service Goal For terminal area roadways, requirements are based on the desired LOS during the design hour for each roadway. The LOS is based on a ratio of the volume of vehicles using the roadway during the design hour versus the assumed capacity of the roadway. Table 4-9 presents the levels of service that correspond to the range of values typically observed for that ratio. Table 4-9 LEVEL OF SERVICE ASSUMPTIONS TERMINAL AREA ROADWAYS Level of Service Ratio of Hourly Volume versus Capacity A 0 to 0.25 B 0.25 to 0.40 C 0.40 to 0.60 D 0.60 to 0.80 E 0.80 to 1.00 F Greater than 1.00 Source: Jacobs Consultancy, September 2008, based on information presented in Transportation Research Board, National Research Council, Highway Capacity Manual, December 2000, Exhibit For master planning purposes, roadway facility requirements are established to meet the anticipated design-hour demand at LOS C. While this LOS may be higher than the standard used for roadways and other transportation facilities not located on an airport (such as those discussed in Section 4.2), it is justified by: The high proportion of unfamiliar drivers that typically use on-airport roadways and curbsides. The consequences of delays and congestion typically associated with LOS D, E, and F. Under LOS D, E, or F conditions, drivers typically experience slower travel speeds that may result in queues. When these conditions occur on roads predominantly used by commuters, drivers may risk being a few minutes 4-17
95 late to work. Under these conditions on an airport, passengers may risk missing flights or baggage check-in cut-off times. The significantly reduced tolerance for delay, once drivers are at the Airport Assessment of Future Activity and Requirements Design hour volumes were established for each key roadway link based on data collected in August 2007 (see Technical Memorandum No. 1 Inventory of Existing Conditions). These volumes were assumed to increase in proportion to the growth in annual numbers of passengers. Future volumes were then compared with the assumed lane capacity for each roadway to identify the number of lanes required to provide LOS C. Table 4-10 presents the requirements for the roadway links, which are identified on Figure Curbside Roadways The terminal curbside is a two-level configuration, with enplaning passengers dropped off on the upper roadway outside the ticketing lobbies and deplaning passengers picked up on the lower roadway outside baggage claim. The upper-level roadway consists of two separate four-lane roadways while the lower-level roadway consists of a four-lane roadway for private vehicles and three separate roadways for commercial vehicles. Requirements for the commercial vehicle roadways and curbsides on the deplaning level are discussed in Section 4.5, Commercial Vehicle Facilities Level-of-Service Goal For curbside roadways, facility requirements were developed for (a) the length of curb needed to accommodate vehicles loading or unloading passengers at the curb and (b) the number of lanes required to carry traffic past the vehicles that are loading or unloading. For both components, requirements are based on a goal to provide facilities that meet the anticipated design hour demand at an acceptable level of service. For the length of curb, the LOS is based on a ratio of the combined length of vehicles that would be parked simultaneously during the design hour versus the available length of curbside. Table 4-11 presents the levels of service that correspond to the range of values typically observed for that ratio. As shown, LOS B through F correspond to situations where the length of parked vehicles exceeds the length of available curb. In such cases, some vehicles are double (or triple) parked as they load or unload passengers. At most airports, double parking is considered acceptable during busy periods and, therefore, curbside roadways where double parking occurs may still operate at an acceptable level of service (such as LOS C). 4-18
96 Table 4-10 TERMINAL AREA ROADWAY REQUIREMENTS PAL (Forecast Year) Link Identifier (a) Description Existing Lanes Lane Capacity (b) Total Capacity Design Hour Volume Volume/ Capacity Ratio Additional Lanes Required to Accommodate Demand at LOS C 2007 A NE Airport Way West, westbound 2 1,290 2,580 1, B NE Airport Way West, eastbound 2 1,290 2,580 1, C Parking entrance 1 1,130 1, D Enplaning level approach 2 1,070 2, E Deplaning level approach 3 1,130 3, F Enplaning level departure 1 1,150 1, G Deplaning level departure 2 1,210 2, H Parking exit roadway 1 1,210 1, I Terminal exit 2 1,290 2,580 1, J Return-to-terminal road 1 1,210 1, K Terminal area exit 2 1,290 2,580 1, PAL 1 A NE Airport Way West, westbound (c) 3 1,290 3,870 1, (2012) B NE Airport Way West, eastbound (c) 3 1,290 3,870 1, C Parking entrance 1 1,130 1, D Enplaning level approach 2 1,070 2, E Deplaning level approach 3 1,130 3, F Enplaning level departure 1 1,150 1, G Deplaning level departure 2 1,210 2, H Parking exit roadway 1 1,210 1, I Terminal exit 2 1,290 2,580 1, J Return-to-terminal road 1 1,210 1, K Terminal area exit 2 1,290 2,580 1, PAL 2 A NE Airport Way West, westbound (c) 3 1,290 3,870 2, (2017) B NE Airport Way West, eastbound (c) 3 1,290 3,870 2, C Parking entrance 1 1,130 1, D Enplaning level approach 2 1,070 2,140 1, E Deplaning level approach 3 1,130 3,390 1, F Enplaning level departure 1 1,150 1,150 1, G Deplaning level departure 2 1,210 2,420 1, H Parking exit roadway 1 1,210 1, I Terminal exit 2 1,290 2,580 1, J Return-to-terminal road 1 1,210 1, K Terminal area exit 2 1,290 2,580 1, PAL 3 A NE Airport Way West, westbound (c) 3 1,290 3,870 2, (2022) B NE Airport Way West, eastbound (c) 3 1,290 3,870 2, C Parking entrance 1 1,130 1, D Enplaning level approach 2 1,070 2,140 1, E Deplaning level approach 3 1,130 3,390 1, F Enplaning level departure 1 1,150 1,150 1, G Deplaning level departure 2 1,210 2,420 1, H Parking exit roadway 1 1,210 1, I Terminal exit 2 1,290 2,580 2, J Return-to-terminal road 1 1,210 1, K Terminal area exit 2 1,290 2,580 2, PAL 4 A NE Airport Way West, westbound (c) 3 1,290 3,870 2, (2027) B NE Airport Way West, eastbound (c) 3 1,290 3,870 2, C Parking entrance 1 1,130 1, D Enplaning level approach 2 1,070 2,140 1, E Deplaning level approach 3 1,130 3,390 1, F Enplaning level departure 1 1,150 1,150 1, G Deplaning level departure 2 1,210 2,420 1, H Parking exit roadway 1 1,210 1, I Terminal exit 2 1,290 2,580 2, J Return-to-terminal road 1 1,210 1, K Terminal area exit 2 1,290 2,580 2,
97 Table 4-10 (page 2 of 2) TERMINAL AREA ROADWAY REQUIREMENTS PAL (Forecast Year) Link Identifier (a) Description Existing Lanes Lane Capacity (b) Total Capacity Design Hour Volume Volume/ Capacity Ratio Additional Lanes Required to Accommodate Demand at LOS C PAL 5 A NE Airport Way West, westbound (c) 3 1,290 3,870 3, (2035) B NE Airport Way West, eastbound (c) 3 1,290 3,870 2, C Parking entrance 1 1,130 1, D Enplaning level approach 2 1,070 2,140 1, E Deplaning level approach 3 1,130 3,390 1, F Enplaning level departure 1 1,150 1,150 1, G Deplaning level departure 2 1,210 2,420 1, H Parking exit roadway 1 1,210 1, I Terminal exit 2 1,290 2,580 2, J Return-to-terminal road 1 1,210 1, K Terminal area exit 2 1,290 2,580 2, (a) See Figure 4-4. (b) Lane capacity is based on Transportation Research Board, National Research Council, Highway Capacity Manual, December 2000, Exhibit Capacities reflect assumed free-flow speed and adjustments for driver population, heavy vehicles, and lateral clearances. (c) Assuming completion of third lane on NE Airport Way, both eastbound and westbound. Source: Jacobs Consultancy, September Table 4-11 LEVEL OF SERVICE ASSUMPTIONS CURBSIDE LOADING AND UNLOADING AREAS Level of Service Ratio of Length of Parked Vehicles versus Available Length of Curbside (a) A 0 to 0.9 B 0.9 to 1.1 C 1.1 to 1.3 D 1.3 to 1.7 E 1.7 to 2.0 F Greater than 2.0 (a) Values are for curbside roadways providing two parking lanes and at least two travel lanes. Source: Transportation Research Board, Special Report 215: Measuring Airport Landside Capacity, 1987, Figure
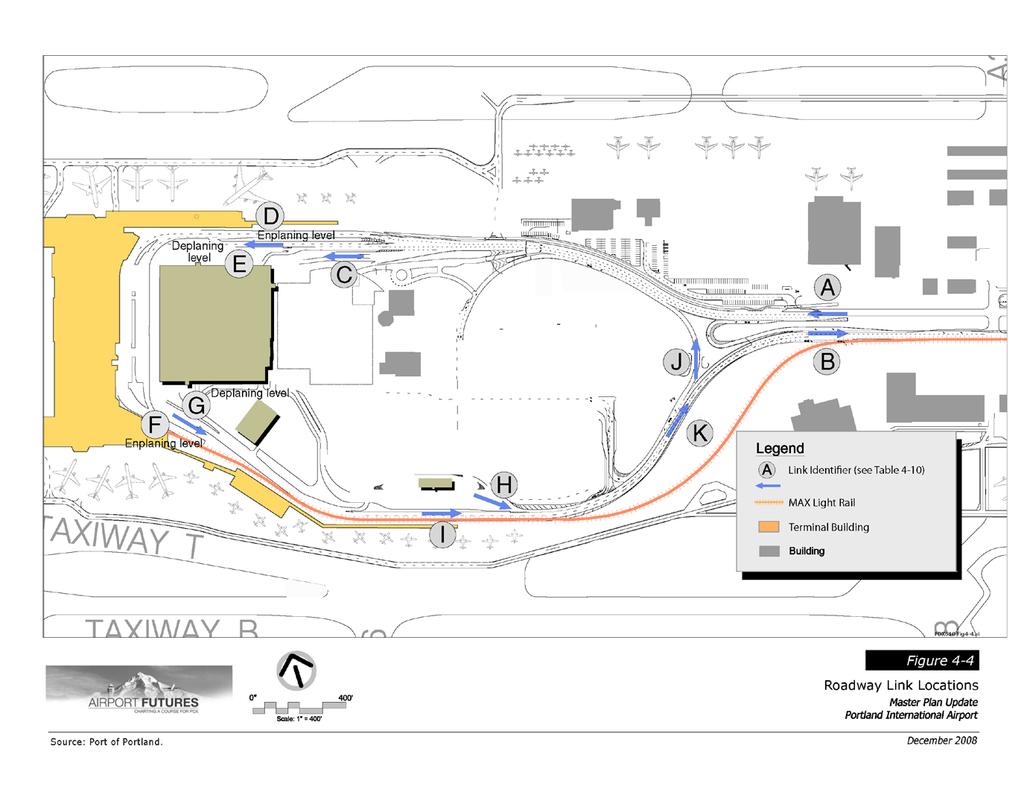
98
99 For the travel lanes on the curbside roadway, the level of service is based on a ratio of the hourly volume of vehicles using the roadway (including vehicles that may or may not be loading or unloading) versus the assumed capacity of the roadway. Table 4-12 presents the levels of service that correspond to the range of values typically observed for that ratio. Level of Service Table 4-12 LEVEL OF SERVICE ASSUMPTIONS CURBSIDE TRAVEL LANES Volume/ Capacity Ratio A 0 to 0.25 B 0.25 to 0.40 C 0.40 to 0.60 D 0.60 to 0.80 E 0.80 to 1.00 F Greater than 1.00 Source: Jacobs Consultancy, September 2008, based on information presented in Transportation Research Board, National Research Council, Highway Capacity Manual, December 2000, Exhibit As described earlier in Section 4.3, Terminal Area Roadways, for master planning purposes, facility requirements were established to meet the anticipated design-hour demand at LOS C. In addition to the reasons presented above, this higher standard is justified by the fact that, on curbside roadways under LOS D, E, or F conditions, drivers may have difficulty finding available loading or unloading spaces near their desired destination (e.g., a particular doorway, curbside check-in position, or pre-arranged meeting point). On the Airport s deplaning level, these conditions can result in queues that block access to commercial vehicle loading areas, rental car facilities, and the P-1 parking garage Enplaning Level Requirements On the enplaning level roadway, the inner roadway is used by private vehicles and the outer roadway is predominantly used by commercial vehicles (the outer roadway also serves valet parking customers). Data from field observations were used to determine (a) a vehicle fleet mix, indicating the relative proportions of different vehicle modes (private vehicles, taxicabs, etc) within the design hour; (b) vehicle dwell times by mode; and (c) the amount of time that pedestrians using crosswalks connecting to the outer curbside restrict the free flow of vehicular traffic on the inner curbside roadway. Using 4-22
100 these data, requirements for the enplaning level curbsides were determined based on the following assumptions and guidelines: Requirements were based on projected design hour traffic volumes, which are based on 2007 enplaning level traffic volumes, as described in Technical Memorandum No. 1 Inventory of Existing Conditions. It was assumed that design-hour volumes will increase in direct proportion to the forecast growth in average day peak month originating passengers. Private vehicles will continue to use the inner roadway and commercial vehicles will continue to use the outer roadway. Vehicular fleet mix, dwell times, and stand requirements (the length of curb required for a vehicle to stop and unload passengers and baggage) will remain consistent throughout the planning period. Pedestrian activity crossing the inner lanes and, therefore the amount of time the inner roadway would be obstructed by pedestrian activity will increase in direct proportion to the volume of vehicles using the outer curbside. The curbsides will meet the unloading vehicle demand 95% of the time during the design hour, based on a Poisson distribution of average demand at a V/C ratio of 1.3 or lower. Curbside dwell time policies will continue to be actively and visibly enforced. Table 4-13 presents the requirements for the enplaning level curbside unloading area and Table 4-14 presents the requirements for the enplaning level curbside travel lanes. As shown, the existing inner and outer roadway lengths available for unloading would accommodate the requirements until PAL 3 (2022). The inner roadway travel lanes, however, would require an additional lane by PAL 4 (2027). This requirement could be addressed by reducing the outer roadway area reserved for non-curbside functions and encouraging drivers to use the outer roadway for passenger unloading. 4-23
101 Table 4-13 ENPLANING LEVEL CURBSIDE UNLOADING AREA REQUIREMENTS PAL (Forecast Curbside Peak Hour Volume Curb Length (feet) Volume/ Capacity Level of Curbside Length Required to Accommodate Volume at Year) Roadway (a) (vph) Required Available Ratio Service LOS C (feet) 2007 (b) Inner B 445 Outer B 280 PAL 1 Inner B 445 (2012) Outer B 280 PAL 2 Inner C 520 (2017) Outer C 320 PAL 3 Inner D 595 (2022) Outer D 365 PAL 4 Inner 1, D 675 (2027) Outer D 410 PAL 5 Inner 1, E 750 (2035) Outer D 450 vph = Vehicles per hour (a) Inner lanes serve private vehicles. Outer lanes are reserved for commercial vehicles. (b) Reflects peak 2007 volumes (which occurred during August) applied to improvements completed in October Source: Jacobs Consultancy, September
102 Table 4-14 ENPLANING LEVEL CURBSIDE TRAVEL LANE REQUIREMENTS PAL (Forecast Year) Curbside Roadway (a) Peak Hour Volume (vph) Existing Number of Total Lanes Adjusted Capacity (vph) (a) Volume/ Capacity Ratio Level of Service Additional Lanes Required to Meet LOS C (b) 2007 (c) Inner , B 0 Outer , A 0 PAL 1 Inner , B 0 (2012) Outer , A 0 PAL 2 Inner , C 0 (2017) Outer , A 0 PAL 3 Inner , D 0 (2022) Outer , A 0 PAL 4 Inner 1, , D 1 (d) (2027) Outer , A 0 PAL 5 Inner 1, , F 2 (e) (2035) Outer , B 0 vph = Vehicles per hour (a) Reflects the capacity of existing lanes, with reductions due to crosswalks and curbside activity in adjacent lanes. (b) Assuming that the curbside unloading area is operating at LOS C or better. (c) Reflects peak 2007 volumes (which occurred during August) applied to improvements completed in October (d) Could be reduced to zero if a portion of drivers on the inner roadway is encouraged to use the outer roadway. (e) Could be reduced to zero or one additional lane if a portion of drivers on the inner roadway is encouraged to use the outer roadway. Source: Jacobs Consultancy, September Deplaning Level Requirements On the deplaning level roadway, the innermost curbside roadway is used exclusively by private vehicles. The other curbside roadways are used by commercial vehicles and are discussed in Section 4.5. Data from field observations were used to determine average vehicle dwell times and the amount of time that pedestrians using crosswalks connecting to the commercial vehicle curbsides and P-1 parking garage restrict the free flow of vehicular traffic on the inner curbside roadway. Using these data, requirements 4-25
103 for the deplaning level curbsides were determined based on the following assumptions and guidelines: Requirements were based on projected design hour traffic volumes, which are based on 2007 deplaning level traffic volumes, as described in Technical Memorandum No. 1 Inventory of Existing Conditions. It was assumed that design-hour volumes will increase in direct proportion to the forecast growth in average day peak month originating passengers. Dwell times and stand requirements (the length of curb required for a vehicle to stop and unload passengers and baggage) will remain consistent throughout the planning period. Curbside dwell time policies will continue to be actively and visibly enforced. During busy periods, traffic enforcement staff will continue to assemble pedestrians into platoons that cross the inner roadway as a group, thereby minimizing the amount of time the roadway is obstructed by pedestrians. As activity increases in the commercial vehicle area and P-1 parking garage, it was assumed that the number of pedestrians in each platoon will increase, but that the amount of time the roadway is obstructed will not. The curbsides will meet loading vehicle demand 95% of the time during the design hour, based on a Poisson distribution of average demand, at a V/C ratio of 1.3 or lower. Table 4-15 presents the requirements for the deplaning level curbside loading area and Table 4-16 presents the requirements for the deplaning level curbside travel lanes. As shown, the existing area available for loading would accommodate the projected requirements until PAL 2 (2017). The roadway travel lanes would require an additional lane by PAL 3 (2022). 4-26
104 Table 4-15 DEPLANING LEVEL CURBSIDE LOADING AREA REQUIREMENTS Curbside Length PAL Peak Hour Volume Curb Length (feet) Volume/ Capacity Level of Required to Accommodate Demand at LOS C (Forecast Year) (vph) Required Available Ratio Service (feet) C 440 PAL 1 (2012) C 440 PAL 2 (2017) D 520 PAL 3 (2022) D 595 PAL 4 (2027) 1, E 655 PAL 5 (2035) 1, E 730 vph = Vehicles per hour Source: Jacobs Consultancy, September PAL (Forecast Year) Table 4-16 DEPLANING LEVEL CURBSIDE TRAVEL LANE REQUIREMENTS Peak Hour Volume (vph) Existing Number of Total Lanes Adjusted Capacity (vph) (a) Volume/ Capacity Ratio Level of Service Additional Lanes Required to Meet LOS C (b) , B 0 PAL 1 (2012) , B 0 PAL 2 (2017) , C 0 PAL 3 (2022) , D 1 PAL 4 (2027) 1, , E 1 PAL 5 (2035) 1, , F 1 vph = Vehicles per hour (a) Reflects the capacity of existing lanes, with reductions due to crosswalks and curbside activity in adjacent lanes. (b) Assuming curbside loading area operates at LOS C or better. Source: Jacobs Consultancy, September
105 4.5 Commercial Vehicle Facilities Commercial vehicle facilities consist of three curbside roadways used for passenger loading on the deplaning level and the Transportation Providers Hold Lot Level-of-Service Goal For commercial vehicle loading areas, facility requirements were developed for the length of curb needed to accommodate vehicles loading passengers. To assist patrons in locating their desired transportation mode, specific curb areas within the commercial vehicle loading area are allocated to each mode. These requirements are based on a goal to provide facilities that meet the anticipated design-hour demand for each mode without requiring vehicles to double park. Therefore, requirements for each mode equal the combined length of vehicles parked simultaneously during the design hour Passenger Loading Requirements For some modes (e.g., courtesy vehicles, pre-arranged limousines, charter buses), the curb length required is directly related to the number of trips made by vehicles in each mode during the design hour. For on-demand modes (taxicabs and on-demand limousines), the curb length required is related to the number of trips made by mode vehicles during the design hour, and also reflects the ability of support facilities, such as the Transportation Providers Hold Lot and close-by feeder queues, to deliver ondemand vehicles to curbside so that vehicles are always available as passengers arrive at the curbside. For on-airport public and employee parking shuttles, the required curb length is related to the number of distinct facilities being served by the shuttles. For all modes, especially those with low volumes, a minimum amount of curb length is required regardless of the level of demand. To develop requirements, data from field observations were used to determine typical vehicle dwell times and typical vehicle mix. Using these data, requirements for the commercial vehicle area were determined based on the following assumptions and guidelines: Requirements were based on projected design hour traffic volumes, which are based on 2007 commercial vehicle area traffic volumes, as described in Technical Memorandum No. 1 Inventory of Existing Conditions. It was assumed that design-hour volumes will increase in direct proportion to the forecast growth in average day peak month originating passengers. Dwell times and stand requirements (the length of curb required for a vehicle to stop and unload passengers and baggage) will remain consistent throughout the planning period. 4-28
106 Curbsides will meet the loading vehicle demand 95% of the time during the design hour, based on a Poisson distribution of the average demand, at a V/C of 1.0 or lower. Requirements for travel lanes were not analyzed because of the low design-hour total volume of commercial vehicles and the availability of three separate roadways to carry the traffic. Table 4-17 presents requirements for the commercial vehicle area. As shown, the total capacity of the three roadways would be sufficient to meet requirements through PAL 5 (2035). However, areas allocated for individual modes may need to be adjusted to meet mode-specific requirements. Table 4-17 COMMERCIAL VEHICLE AREA Curbside requirements (feet) PAL (Forecast Year) Taxicabs Pre-arranged limousines On-demand executive sedans Door-to-door vans Long-haul vans Courtesy vehicles (a) Airport public parking shuttles (b) Airport employee parking shuttles (b) Charter bus/trimet bus bridge Other (c) Total demand Existing total capacity (feet) Additional curb required to meet demand (feet) PAL 1 (2012) PAL 2 (2017) ,285 0 PAL 3 (2022) PAL 4 (2027) PAL 5 (2035) ,065 0 (a) Includes vehicles operated by hotels, motels, off-airport parking, and off-airport rental car operators. (b) Assuming one bus stop per distinct parking facility. (c) Includes Airport vehicles and police vehicles. Source: Jacobs Consultancy, September Transportation Providers Hold Lot Currently, commercial vehicle operators waiting for dispatch to the commercial vehicle loading area park in the Transportation Providers Hold Lot, located east of the Airport traffic control tower. This area is approximately 37,000 square feet and accommodates 4-29
107 taxicabs, door-to-door vans, long-haul vans, other scheduled vehicles, and charter buses waiting to be dispatched to curbside. Port staff indicated that this area is adequately sized for existing demand. Assuming that the required area is directly related to the annual originating/terminating passenger activity at the Airport, requirements for the Transportation Providers Hold Lot are as shown in Table Table 4-18 TRANSPORTATION PROVIDERS HOLD LOT REQUIREMENTS PAL (Forecast Year) Required Area (square feet) Existing Area (square feet) Additional Area Needed to Meet Requirements (square feet) ,000 0 PAL 1 (2012) 38,000 1,000 PAL 2 (2017) 45,000 8,000 37,000 PAL 3 (2022) 52,000 15,000 PAL 4 (2027) 60,000 23,000 PAL 5 (2035) 68,000 31,000 Source: Jacobs Consultancy, September It was assumed that the functions accommodated in the Transportation Providers Hold Lot will be provided in one consolidated location within a short drive (i.e., less than 5 minutes) of the commercial vehicle loading area. If a hold area is developed for a specific mode, or if the area is located further away, total requirements would increase. 4.6 Public Transit Requirements for public transit facilities at the Airport are predominantly driven by (a) the number of individual services and/or routes serving the Airport and (b) the functional requirements of the service. Currently, only one service, TriMet s MAX lightrail transit system, provides service at the Airport. As demand for the service increases, it was assumed that more passengers would board each train and/or TriMet would increase the frequency of trains serving the Airport. Future requirements for this service are predominantly functional and include the following: A MAX station would continue to be provided within a short walking distance of the terminal building. 4-30
108 For periods when the MAX light-rail system is unable to serve the Airport because of a service disruption, a bus stop would be provided near the MAX station to accommodate buses, providing a bus bridge for the MAX service. Changes to the existing alignment and station location should incorporate TriMet s design requirements for right-of-way width, track separation, double tracking, horizontal and vertical curve radii, grade, and vertical clearance. Although no other systems currently serve the Airport, in the event that a new transit operator (i.e., C-Tran, based in Clark County, Washington) begins service at the Airport (C-Tran currently provides service to the Parkrose Transit Center, where passengers can transfer to MAX), the Port will attempt to accommodate the vehicle within the commercial vehicle loading area on the deplaning level. 4.7 Public Parking Public parking is currently provided in the P-1 parking garage, the Long-Term Lot, the Economy Lots, and in privately operated off-airport parking lots. In 2010, the P-2 parking garage will also available Level-of-Service Goal In general, the public parking requirements presented here are based on projected peak occupancy of close-in and remote parking facilities during a design day, which is based on the 30th-highest occupancy observed during In determining the requirements for remote facilities, such as the existing Economy Lot, 10% additional spaces were assumed as a circulation allowance, recognizing a patron s inability to locate the last available spaces in a busy, large parking facility. In determining requirements for close-in facilities, which consist of the P-1 parking garage, the Long-Term Lot, and the P-2 parking garage, a 5% circulation allowance was assumed. This reduced allowance reflects the availability of the single-space guidance system (which is currently available in P-1 and may be available in P-2), in which indicator lights at the end of each aisle and over each parking space are used to direct patrons to available spaces Assessment of Future Activity and Requirements Future public parking requirements are presented for a design day, which is based on the 30th-highest observed peak occupancy during 2007 and was used to identify requirements for permanent parking facilities. Requirements are also presented for holiday/overflow parking, which is based on the highest observed peak occupancy in 2007 and was used to identify requirements for temporary or multi-use facilities that would only be needed during the busiest days of the year. To estimate the total demand for Airport-related public parking, future off-airport demand is presented as well. In the event that off-airport operators are unable to maintain their existing share of 4-31
109 the parking market or if the Port elects to increase the share of parking accommodated on-airport, parking requirements may increase to accommodate a share of the off- Airport demand. Since 2003, public parking demand at the Airport has grown at a faster rate than the growth in the number of originating passengers a consistent trend at airports nationwide. Recognizing that (a) this trend may or may not continue in the future and (b) external factors, such as use of public transit, may affect future parking requirements, parking requirements are shown for three growth rates: A low growth rate, at which parking demand increases at the same rate as originating passengers. A high growth rate, at which parking demand increases faster than originating passengers, similar to growth observed since A medium growth rate, at which parking demand increases slightly faster than originating passengers, but not as fast as the high growth rate. Table 4-19 presents the public parking requirements. As shown, under all growth scenarios, additional capacity would be required by PAL 2 (2017) Cell Phone Lot Currently, the Port provides a 30-space cell phone lot at the Airport where drivers unwilling to use the public parking garage may park for a limited period of time (e.g., 30 minutes or less) while awaiting a call from the arriving passenger(s). It was assumed that demand for such a lot will continue through the planning period, but no quantitative requirement has been prepared. Rather, it is recommended that, for future years, a cell phone lot site be identified that meets the following functional requirements: Easily accessible from the major Airport access route. Sufficiently distant from the terminal so that drivers are discouraged from walking into the terminal to meet passengers. Easy access to the roadway leading to the terminal building. 4.8 Employee Parking Employee parking is provided on Airport property in the Portland International Center off Alderwood Road and in the North Employee Lot located near the Transportation Providers Hold Lot. 4-32
110 PAL (Forecast Year) Average Annual Growth Rate Table 4-19 PUBLIC PARKING REQUIREMENTS Design Day (a) Additional Close-in Remote Holiday/ Off-Airport Grand Spaces to Meet Facilities (b) Facilities (c) Total Overflow (d) Demand (e) Total Capacity (f) Requirements Low Parking Demand Growth Rate (assuming that parking grows at same rate as the base enplaned passenger forecast) ,750 7,660 12, ,300 14,320 12,964 1,356 PAL 1 (2012) 0.4% 4,860 7,830 12, ,330 14,640 16,198 0 PAL 2 (2017) 3.7% 5,830 9,400 15, ,590 17,570 16,198 1,372 PAL 3 (2022) 2.8% 6,690 10,780 17, ,830 20,160 16,198 3,962 PAL 4 (2027) 2.8% 7,670 12,360 20, ,100 23,110 16,198 6,912 PAL 5 (2035) 1.6% 8,680 14,000 22,680 1,110 2,270 26,060 16,198 9,862 Medium Parking Demand Growth Rate ,750 7,660 12, ,300 14,320 12,964 1,356 PAL 1 (2012) 1.5% 5,120 8,260 13, ,400 15,430 16,198 0 PAL 2 (2017) 5.0% 6,540 10,540 17, ,790 19,710 16,198 3,512 PAL 3 (2022) 3.5% 7,760 12,510 20, ,120 23,380 16,198 7,182 PAL 4 (2027) 3.0% 9,000 14,510 23,510 1,150 2,460 27,120 16,198 10,922 PAL 5 (2035) 2.0% 10,540 17,000 27,540 1,350 2,880 31,770 16,198 15,572 High Parking Demand Growth Rate ,750 7,660 12, ,300 14,320 12,964 1,356 PAL 1 (2012) 3.0% 5,510 8,880 14, ,510 16,600 16, PAL 2 (2017) 6.0% 7,370 11,890 19, ,020 22,220 16,198 6,022 PAL 3 (2022) 4.5% 9,190 14,820 24,010 1,180 2,510 27,700 16,198 11,502 PAL 4 (2027) 4.0% 11,180 18,030 29,210 1,430 3,060 33,700 16,198 17,502 PAL 5 (2035) 3.0% 14,160 22,830 36,990 1,810 3,870 42,670 16,198 26,472 (a) Based on 30th-highest occupancy observed in (b) Includes 5% circulation allowance. (c) Includes 10% circulation allowance. (d) Based on highest occupancy observed in Includes no circulation allowance. (e) Based on estimated busy-day occupancy in (f) Assuming completion of the P-2 garage by 2012, which will add 3,000 public parking spaces and replaces the spaces lost in the P-1 garage and the Long-Term Lot during construction. Source: Jacobs Consultancy, September
111 4.8.1 Level-of-Service Goal In general, the employee parking requirements presented here are based on projected combined peak occupancy of both employee parking facilities during a design day, which is based on the 30 th -highest occupancy observed during For planning purposes, 10% additional spaces were assumed as a circulation allowance, recognizing a patron s inability to locate the last available spaces in a busy, large parking facility Assessment of Future Activity and Requirements For future years, employee parking requirements were assumed to increase at a blended rate of the growth in annual enplaned passengers and the growth in total aircraft operations. Table 4-20 presents the employee parking requirements. Table 4-20 EMPLOYEE PARKING REQUIREMENTS PAL (Forecast Year) Enplaned Passengers Average Annual Growth Airport Operations Blended Rate Requirements (spaces) Existing Capacity (spaces) Additional Spaces Needed to Meet Requirements ,900 0 PAL 1 (2012) 0.4% -0.5% 0.0% 1,900 0 PAL 2 (2017) 3.7% 2.4% 3.1% 2, ,544 PAL 3 (2022) 2.8% 1.8% 2.3% 2,500 0 PAL 4 (2027) 2.8% 1.8% 2.3% 2, PAL 5 (2035) 1.6% 1.1% 1.3% 3, Source: Jacobs Consultancy, September Rental Cars In 2007, alternative plans and strategies for providing rental car facilities near the terminal for as long as possible were identified in the CH2M-Hill report Assessment of Alternative Plans for Accommodation of Rental Car Operations through 23 Million Passengers, February 23, 2007 (the 2007 Rental Car Report). Multiple operating configurations and assumptions were examined and it was concluded that: So long as rental cars are allowed to operate from the terminal area, the Port should maintain its current goal of accommodating 80% of the rental car market in on-airport facilities. 4-34
112 Through a series of incremental improvements (e.g., adding a car wash), rental cars could continue to operate in the terminal area until the Airport is serving approximately 21 million annual passengers (expected to occur around 2022). The requirements presented below are based on facility needs identified in the 2007 Rental Car Report, under the following assumptions: Through PAL 3 (2022), 80% of the rental car market would be accommodated in on-airport facilities. For PAL 4 (2027) and beyond, the facilities needed to accommodate 100% of the rental car market would be provided. Through PAL 3 (2022), requirements reflect an operating condition that minimizes the number of ready / return stalls (which must be within walking distance of the terminal), but increases the number of vehicle storage stalls (which do not have to be within walking distance of the terminal). This condition reflects the Port s desire to maintain ready/return facilities within the footprint of the existing P-1 parking garage for as long as possible. This configuration would increase staffing costs for the rental car companies because they would have to shuttle cars between storage and ready/return stalls during peak rental and return periods. For PAL 4 (2027) and beyond, requirements reflect a balanced configuration that reduces the staffing costs for rental car companies by providing sufficient ready/return stalls (and, in turn, fewer storage stalls) to meet the needs of a 2.0- to 2.5-hour rental or return peak period. Table 4-21 presents future rental requirements for the following elements: Ready/return area where customers pick up and return their vehicles. The portion of the area used for ready vehicles versus return vehicles varies throughout the day. Storage area near the ready/return area where rental car companies can store vehicles (parked nose-to-tail) for quick transport to or from the ready/return area. Customer building/office area where customers conduct transactions with rental car company representatives. Area also includes back office and support space for the rental car companies, as well as lobby and circulation space for customers. 4-35
113 Service center (also known as the quick turnaround area, or QTA) where rental car companies refuel and wash returned cars before moving them either to the storage area or to the ready/return area. The area typically consists of car washes, fueling islands, and nose-to-tail stacking stalls for vehicles that are about to be fueled and washed, or have just been fueled and washed. Table 4-21 RENTAL CAR FACILITIES REQUIREMENTS PAL (Forecast Ready/Return Area Storage Area Customer Building/Office Service Center Total Area Additional Area Required to Meet Year) Spaces (a) Acres (acres) Area (acres) (acres) (acres) Demand (acres) (b) PAL (2012) PAL 2 (2017) PAL 3 (2022) PAL 4 (2027) PAL 5 (2035) 1, , , , Notes: For 2007 through 2022, it was assumed that 80% of the rental car market would be accommodated on-airport. After 2022, 100% of the rental car market would be accommodated on-airport For 2007 through 2022, requirements reflect a goal to minimize the ready/return area. After 2022, requirements reflect a goal to provide balanced facilities. (a) Equivalent public parking spaces. (b) In addition to the existing acres. Source: Jacobs Consultancy, 2008, from analyses prepared by CH2MHILL and John F. Brown Company, 2006 and In addition to the requirements presented here, rental car operators may elect to provide additional area for long-term storage, overflow, and heavy maintenance. These functions, however, are often accommodated off-airport in areas independently leased by the rental car companies and, therefore, are not included in the on-airport facility requirements. Data presented in Table 4-22 further reconcile the requirements shown in Tables 1-1 and 4-21 with the requirements estimated by CH2M Hill and the John F. Brown Company in 2006 and
114 Table 4-22 RECONCILIATION OF RENTAL CAR REQUIREMENTS WITH PREVIOUS ESTIMATES BY CH2MHILL AND THE JOHN F. BROWN COMPANY Facility Requirements Requirements by CH2M Hill Requirements Assuming 100% Market Share and Assuming 80% Market Share Efficient Operations with No Facilities Constraints and Inefficient Operations By By Jacobs Consultancy, Based Due to Facilities Constraints (a) CH2M Hill (b) on Estimate by CH2M Hill (c) Planning activity level (PAL) PAL 1 PAL 2 PAL 3 not applicable PAL 4 PAL 5 Forecast year not applicable Forecast passenger activity (MAP) Rental Car Operational Areas Ready stalls (i.e., parking spaces) ,500 1,540 1,750 Return stalls (i.e., parking spaces) ,150 1,180 1,340 Total stalls (spaces) 1,080 1,300 2,650 2,720 3,090 Equivalent ready stalls (as shown in Table 1-1) (d) 910 1,090 1,250 2,300 2,400 2,700 Total operational area (SF) (e) 318, , , , , ,500 Storage Nose-to-tail stalls Additional stalls required due to inadequate area Total storage area (f) 181, , , , , ,740 Building Space Customer service lobby 16, ,640 25,336 28,700 Rental car company support areas (SF) 6, ,860 10,139 11,485 Total building space (SF) 22,500 27,000 30,900 34,500 35,475 40,185 Quick Turn Around (QTA) Facilities Fuel positions Car wash bays Stacking stalls (nose-to-tail stalls) Total QTA facilities (SF) 97, , , , , ,650 Total storage, building and QTA area (SF) (g) 300, , , , , ,575 Total storage, building and QTA area (acres) (as shown in Table 1-1) (h) Total Rental Car Facility Space (SF) 618, , ,800 1,171,000 1,202,632 1,365,075 (a) CH2MHILL and Blunk Demattei Associates, Update to the Assessment of Alternative Plans for Accommodation of Rental Car Operations Through 23 Million Passengers, February 23, 2007 (b) John F. Brown Company and CH2MHill, Assessment of Alternative Plans For Accommodation of Rental Car Operations Through 23 Million Annual Passengers, February 24, 2006 (c) Estimates are extrapolated from CH2MHill's 23 MAP estimates (d) Equivalent ready stalls equals the number of ready stalls plus the number of return stalls multiplied by 250/350 (e) Assumes 350 square feet per ready stall and 250 square feet per return stall (f) Assumes 200 square feet per storage stall (g) Equals the total area required for storage stalls, building space, and QTA facilities in square feet (h) Equals the total storage, building and QTA area in square feet divided by 43,560 square feet per acre 4-37
115 4.10 Pedestrian/Bicycle Facilities Requirements for on-airport pedestrian and bicycle facilities are predominantly qualitative because activity levels are typically sufficiently low that geometric requirements (e.g., path widths) are based on minimum design standards instead of demand. Requirements for on-airport pedestrian and bicycle facilities include: Identified pedestrian and bicycle paths should connect the regional pedestrian/bicycle network to major on-airport destinations, including the terminal and major employment centers. Nonsecure pedestrian paths should be provided to connect passenger terminal facilities to all close-in public parking facilities Other Key Intersections On or Near the Airport This section focuses on key on-airport and off-airport intersections not on the two major terminal access routes, and their ability to accommodate motor vehicle traffic to and from the Airport in the future. These intersections and roadways provide direct (or adjacent) access to non-terminal-area facilities, such as general aviation, cargo, and military facilities. The facilities analyzed in this section (and shown on Figure 4-5) include six intersections. These intersections were evaluated to assess their ability to accommodate the demand forecast for PAL 1 through PAL 5; to determine when a facility may become deficient; and to determine the potential capacity improvements that may be required Baseline Conditions The six intersections identified on Figure 4-5 were analyzed to identify their current performance and to compare that performance against adopted intersection operational standards based on delay and capacity. The assumed operational standards are identical to those presented in Section in the discussion of the analysis of the seven intersections on the two main terminal access roadways. Table 4-23 summarizes the baseline operating conditions at these other study area intersections. 4-38


116 AIRTRANS WY CASCADE PKWY 102ND AV Columbia River I ING MARINE DR GLEN W D HOLMAN 105TH AV LEGEND PDX610 Fig4-5.ai Figure 4-5 Other Study Area Intersections WY FRONTAGE RD AV AV MARX DR 92ND 82ND Portland International Airport AIRPORT Airtrans Center CORNFOOT RD Columbia Portland International Center 205 SANDY BLVD MT. HOOD AV 9 RD Slough ALDERWOOD 63RD AV COLUMBIA BLVD PORTLAND HWY 30 8 BLVD KILLINGSWORTH ST CULLY X - Study Area Intersection MAP NOT TO SCALE Source: Port of Portland
117 Table 4-23 SUMMARY OF EXISTING (2007) AFTERNOON PEAK HOUR OPERATING CONDITIONS AT OTHER STUDY AREA INTERSECTIONS Intersection Delay (seconds) LOS V/C Operational Standard 8 NE Alderwood Road/NE Cornfoot Road > 80.0 F 1.00 E 9 NE Airtrans Way/NE Cornfoot Road 25.4 D 0.53 D 10 NE Columbia Boulevard/NE 82nd Avenue southbound > 80.0 F 0.93 E 11 NE Columbia Boulevard/NE 82nd Avenue northbound 21.1 C 0.19 E 12 NE Killingsworth Street/I-205 southbound 42.2 D NE Killingsworth Street/I-205 northbound 30.2 C Delay LOS V/C = Average intersection delay in seconds (calculated using 2000 Highway Capacity Manual methodology) = Level of service (calculated using 2000 Highway Capacity Manual methodology) = Volume-to-capacity ratio (calculated using 2000 Highway Capacity Manual methodology) = Does not meet jurisdiction s operational standard Source: DKS Associates, September 2008, based on counts provided by the Port of Portland and Oregon Department of Transportation. Multiple data collection days were used throughout 2007; however, all counts were adjusted for analysis to represent the 30th busiest hour of the year. As shown in Table 4-23, existing conditions at three of the evaluated intersections do not meet the governing jurisdiction s operational standards Methodology For the two on-airport intersections (NE Alderwood Road/NE Cornfoot Road and NE Airtrans Way/NE Cornfoot Road), the methodology used for projecting future year volumes was identical to that used for the analysis of intersections on the two main terminal access roadways (see Section 4.2.2). Capacity constraints were identified if (a) an intersection did not meet a jurisdictional mobility standard for either delay (LOS) or volume-to-capacity or (b) the V/C ratio for a critical movement at the intersection exceeded 1.0 during the afternoon peak hour. Regarding the four remaining intersections listed in Table 4-23: typically, these intersections serve some users originating from, or destined to, Airport facilities, but they generally do not provide direct access to those facilities or they serve many other regional users. As a result of the limited share of Airport-related traffic at these intersections, detailed year-by-year analysis was not conducted, but the capacity 4-40
118 constraints at the intersections were identified to indicate which movements would be expected to limit operations in the future Future Intersection Facility Requirements The following summarizes the results of the capacity and requirements analysis for the other study area intersections. NE Alderwood Road/NE Cornfoot Road Intersection (Figure 4-5, Intersection 8) This intersection is used by a portion of Airport traffic traveling to and from the south side of the airfield, as well as a limited portion of traffic traveling to and from the terminal area. This traffic typically consists of air cargo and military users. It was assumed that a number of improvements will be in place at this intersection by 2012 that will affect traffic operations. By 2012, it was assumed that this intersection will be signalized with separate eastbound left and right turn pockets, and the southbound approach will have a separate right turn pocket. Table 4-24 summarizes the results of the capacity and requirements analysis for this intersection with these improvements in place for the various planning years. Table 4-24 SUMMARY OF CAPACITY AND REQUIREMENTS ANALYSIS NE ALDERWOOD ROAD/NE CORNFOOT ROAD INTERSECTION PAL (Forecast Year) LOS V/C Facility Requirements PAL 1 (2012) B 0.78 No additional requirements PAL 2 (2017) B 0.85 No additional requirements PAL 3 (2022) E 1.11 Add northbound left turn pocket PAL 4 (2027)* B 0.84 No additional requirements PAL 5 (2035)* C 0.99 No additional requirements LOS = Level of service V/C = Volume-to-capacity ratio *Assuming northbound left turn pocket. Source: DKS Associates, September As shown in Table 4-24, this intersection will require the addition of a separate northbound left turn pocket by PAL 3 (2022) to meet mobility standards. One consequence of widening NE Alderwood Road to accommodate a northbound left turn pocket could be a need to rebuild the existing Columbia Slough overpass located south of this intersection on NE Alderwood Road. 4-41
119 NE Airtrans Way/NE Cornfoot Road Intersection (Figure 4-5, Intersection 9) This intersection is the primary access point for Airport facilities on the south side, including the AirTrans Cargo Center, Airport and airline support areas, and military facilities. Table 4-25 summarizes the results of the capacity and requirements analysis for this intersection. Table 4-25 SUMMARY OF CAPACITY AND REQUIREMENTS ANALYSIS NE AIRTRANS WAY/NE CORNFOOT ROAD INTERSECTION PAL (Forecast Year) LOS V/C Facility Requirements PAL 1 (2012) F 0.88 Signalized intersection PAL 2 (2017)* B 0.67 No additional requirements PAL 3 (2022)* B 0.76 No additional requirements PAL 4 (2027)* B 0.84 No additional requirements PAL 5 (2035)* C 0.94 No additional requirements LOS = Level of service V/C = Volume-to-capacity ratio *Assuming signalization Source: DKS Associates, September Based on the results of the capacity and requirements analysis, future growth in the area will require signalization of this intersection by With signalization, this location will meet mobility standards through Future Off-Airport Intersection Facility Requirements The following summarizes the off-airport intersection requirements. Typically, some users of these intersections originate from, or are destined to, Airport facilities but these intersections generally do not provide direct access from or to those Airport facilities and have many other regional users. Therefore, detailed year-by-year analysis was not conducted, but capacity constraints at the intersections were identified to indicate which movements would limit operations in the future. 4-42
120 NE Columbia Boulevard/NE 82nd Avenue Interchange Area (Figure 4-5, Intersections 10 and 11) This area consists of two unsignalized intersections that provide access from NE Columbia Boulevard to NE 82nd Avenue. While not an on-airport facility, this interchange area is a key entry and exit point between NE 82nd Avenue and destinations further east and west. Improvements planned within the interchange area, which will be in place by PAL 1 (2012), would affect the capacity at these intersections in future years. These improvements consist of signalizing the southbound on-/offramp. In addition, the southbound ramp will accommodate both left and right turn pockets, and the eastbound approach will have a separate left turn pocket and single through lane. The westbound approach at the signal will include a through lane and a shared through/right lane. The northbound ramp intersection will have the same eastbound and westbound geometry as the signalized intersection, but will not be signalized and will have a shared southbound approach geometry. Based on the results of the capacity analysis, the northbound intersection would have capacity constraints at the southbound approach, primarily resulting from delays caused by heavy eastbound and westbound traffic volumes. While not the responsibility of the Port of Portland, the widening of NE Columbia Boulevard to create a five-lane cross-section would help meet the needs of regional traffic demand in the future. This widening would help to match the existing upstream and downstream five-lane cross section at NE 60th Avenue and approximately NE 87th Avenue. NE Killingsworth Street/Interstate 205 Interchange Area (Figure 4-5, Intersections 12 and 13) This interchange area provides secondary regional access to the Airport and surrounding land uses. Within the area, the southbound intersection currently operates near capacity and is constrained during the afternoon peak hour. Capacity is constrained by access to the southbound on-ramp, as well as by heavy volumes eastbound and westbound. The southbound intersection reaches capacity first with the eastbound right turn pocket. The heavy demand for this movement would require some form of free-flow movement to alleviate the capacity constraint. In addition, the southbound off-ramp movement would have capacity constraints later in the planning period and would need some form of capacity improvement to allow for adequate operations. 4-43
121 5. AIR CARGO This section provides the projected air cargo requirements for Portland International Airport through PAL 5 (2035). Airport-wide facility requirements were determined to accommodate the growth in air cargo tonnage as presented in the forecasts contained in Technical Memorandum No. 2 Aviation Demand Forecasts. Cargo facility requirements are presented for three facility components: Processing and Warehouse Space Processing and warehouse space consists of enclosed areas used to store and sort air cargo as well as to provide office and other space to facilitate air cargo operations. Processing and warehouse facilities requirements are presented in square feet. Ramp Area Ramp areas are the paved airside areas used for aircraft parking while air cargo is loaded and unloaded. For larger air cargo complexes, ramp area may include a maneuvering area for aircraft to access parking positions as well as storage areas for ground service equipment used to load air cargo onto aircraft, unload air cargo from aircraft, or service aircraft. Ramp area requirements are presented in square yards. Landside Areas Air cargo landside areas include vehicle access and circulation from the Airport s primary roadway network, parking for employees and visitors, and truck parking for delivering air cargo to warehousing and sorting facilities and for taking delivery of air cargo from these facilities. An allowance is made for landscaping and other improvements in the total landside area calculation. Landside area requirements are presented in square feet. These three components encompass the total air cargo facility requirements at the Airport. The total Airport-wide area required is presented in acres for use in developing an Airport land use plan. Table 5-1 depicts the forecast cargo tonnage at the Airport for PAL 1 through PAL 5. The cargo forecasts are provided for passenger airlines (referred to as belly cargo, as it is transported in the belly of passenger aircraft) and all-cargo airlines. The all-cargo airlines carry approximately 91% of the total cargo volume of 732,000 annual tons forecast at the Airport in PAL 5 (2035). 5-1
122 Table 5-1 TOTAL AIR CARGO FORECAST (tons, in thousands) 2007 (a) PAL PAL PAL PAL PAL Belly cargo All-cargo airlines Total cargo (a) According to Port records, in 2007, 35,000 tons of belly cargo and 245,000 tons of cargo on the all-cargo airlines, for a total of 280,000 tons of cargo, were processed at the Airport. Source: Jacobs Consultancy, Technical Memorandum No. 2 Aviation Demand Forecasts,,, September 2008, except as noted. 5.1 Processing and Warehouse Space Cargo facilities used by the passenger airlines for belly cargo are located in the North Cargo Complex, Northeast Cargo Complex, and the Southeast Cargo Complex. Cargo facilities used by the all-cargo airlines are located in the AirTrans Center. Other cargo facilities are located at the Southwest Ramp. The locations of these facilities are shown on Figure 5-1. The Port of Portland owns all facilities in the North Cargo Complex and the Northeast Cargo Complex, except for the United States Postal Service (USPS) facilities. The USPS facility, located in the Southeast Cargo Complex, is currently used for ground sorting purposes only and, for the purposes of facility requirements, is not considered as a belly cargo or an all-cargo facility. Facilities in the AirTrans Cargo Center and Southwest Ramp are tenant owned and managed. In 2007, 649,039 square feet of cargo building and office space were provided at the Airport, where 280,323 tons of cargo carried on passenger and all-cargo aircraft were processed. Table 5-2 provides a breakdown of the building areas of the various cargo facilities, the volume of cargo processed at each facility, and the building utilization rate (the square footage of building space per annual ton of cargo processed). All cargo operations at PDX are considered on-airport operations. The warehouse space at the Airport has a very low utilization rate for the volume of cargo processed relative to other North American airports with similar cargo volumes. Figure 5-2 depicts the cargo warehouse area compared with total tons of cargo processed at select North American airports. 5-2
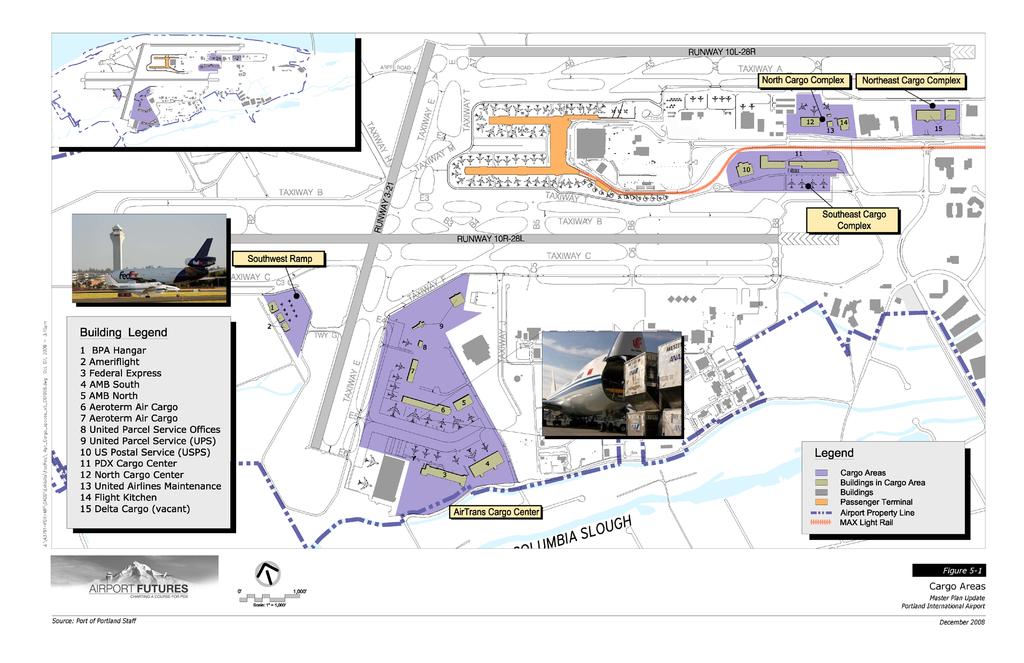
123
124 Table 5-2 AIR CARGO BUILDING SIZES AND UTILIZATION RATES 2007 Cargo Complex Building Area (square feet) Cargo Processed (tons) Building Utilization Rate (square feet/ton) North Cargo Complex (multi-tenant building) 42,000 2, Northeast Cargo Complex (multi-tenant 63, building; former Delta Cargo Complex) (a) Southeast Cargo Complex U.S. Postal Service(b) 114, PDX Cargo Center East Cargo Complex 77,645 20, PDX Cargo Center - West Cargo Complex 52,612 9, AirTrans Cargo Center AMB (2 multi-tenant buildings) 159,500 44, Aeroterm (2 multi-tenant buildings) 91,554 2, FedEx 101, , United Parcel Service (UPS) 10,914 66, Southwest Ramp BPA Hangar 20, Ameriflight 28,998 7, TOTAL (excluding U.S. Postal Service facility) 649, , (a) The Northeast Cargo Complex is currently vacant. (b) The USPS facility serves as a mail sorting facility. The total area for the USPS facility was not considered a part of the total cargo area. Source: Port of Portland. 5-4
125 Figure 5-2 CARGO WAREHOUSE AREA VS. CARGO VOLUME AT SELECT NORTH AMERICAN AIRPORTS 700 Cargo Building Area (square feet, thousands) TPA BOS SAN DTW PHX ONT PDX SEA OAK Cargo Volume (tons, thousands) Sources: HNTB Corporation, September 2008 and Air Cargo World, The building utilization rate (square feet per annual ton of cargo processed) is the measure typically used to define the capacity of cargo facilities. The average building utilization rate at U.S. airports is between 1.50 and 1.75 square feet per annual cargo ton. The range of adequacy, however, averages between 1.0 square foot and 2.5 square feet per annual cargo ton. A building utilization rate of 1.0 square foot per annual ton generally implies that facilities are well-utilized and some near-term expansion is required. A utilization rate of 2.5 square feet per annual ton implies that facilities are adequately spaced for current activities and may provide additional capacity for growth. Table 5-3 presents the cargo building utilization rates at selected North American airports. PDX has lower utilization of cargo building space than the majority of other airports listed in the table. This low utilization may partly be 5-5
126 attributable to inefficient space allocation. For instance, some of the cargo handlers at the Airport have expressed a desire for smaller processing areas, sized less than 10,000 square feet. Other tenants may desire larger facilities. And although the Airport may have available square footage, the space cannot be subdivided to meet the needs of these potential tenants. Thus, a lack of flexibility with the existing facilities limits their usability despite space availability. It is recommended that the Port consider flexible facility designs for future air cargo processing facilities so that a wide range of space needs can be accommodated. Table 5-3 PEER AIRPORT CARGO BUILDING UTILIZATION RATES Airport IATA Code (a) Utilization Rate (square feet/ annual ton) Airport IATA Code (a) Utilization Rate (square feet/ annual ton) FLL 0.23 BOS 1.67 SJC 0.44 LAS 1.67 SNA 0.46 SEA 1.70 ONT 0.48 IAH 1.77 SAN 0.54 LGA 1.80 DFW 0.56 DTW 1.94 OAK 0.56 JFK 2.31 PHX 0.71 PDX 2.32 LAX 1.01 PIT 2.42 IAD 1.10 MCO 2.53 ATL 1.20 SLC 2.73 TPA 1.22 BWI 3.26 SFO 1.24 YVR 4.43 EWR 1.32 MSP 5.34 MIA 1.37 CLT 5.58 ORD 1.55 CVG 5.71 DEN 1.66 (a) International Air Transport Association. Sources: Air Cargo World, 2007 and Airports Council International North America, A range of cargo building utilization rates was assumed for the requirements developed for the 2000 Master Plan. The utilization rates assumed for the Airport in 2000, 2005, 2010, and 2020 requirements were 1.20, 1.14, 1.09, and 1.00 square feet per ton, respectively. The current Airport-wide building utilization rate, however, is approximately 2.32 square feet per annual ton. The planned cargo building utilization rates at selected peer airports (i.e., the utilization rates assumed by planners for cargo facilities at these airports) were examined to establish an appropriate utilization rate for PDX. Figure 5-3 presents these rates for Ontario International Airport (in the 5-6
127 Los Angeles area), Tampa International Airport, Seattle-Tacoma International Airport, San Diego International Airport, and from the 2000 PDX Master Plan Figure 5-3 PLANNED PEER AIRPORT CARGO BUILDING UTILIZATION RATES Utilization Rate (square feet per ton) Ontario Tampa Seattle- Tacoma San Diego PDX Sources: 2008 Ontario International Airport Master Plan, Los Angeles World Airports, Master Plan, Port of Portland, September (A variable utilization rate was used in the 2000 Master Plan, from 1.21 square feet to 1.00 square foot of warehouse and office space per annual ton of cargo processed. An average utilization rate of 1.13 square feet per annual ton was graphed.) 2008 San Diego International Airport Master Plan, San Diego County Regional Airport Authority, May Seattle-Tacoma International Airport Regional Air Cargo Strategy, Puget Sound Regional Council, October Tampa International Airport, Hillsborough County Aviation Authority,
128 For the purposes of this Master Plan, a 1.50 square feet per annual ton building utilization rate was applied to the cargo forecast to determine future cargo building requirements for both belly cargo and for all-cargo processing facilities. Table 5-4 presents the required total cargo processing and warehouse space at the Airport for the planning activity levels. The PAL 5 requirement for total cargo processing and warehouse space is 1,098,000 square feet. This represents a deficiency of approximately 449,000 square feet. Belly cargo facility space would be sufficient to accommodate forecast cargo activity, but the all-cargo facilities would require additional building space by PAL 3. Table 5-4 CARGO PROCESSING AND WAREHOUSE SPACE FACILITY REQUIREMENTS (square feet, in thousands) 2007(a) PAL PAL PAL PAL PAL Belly Cargo Building Area All-Cargo Building Area ,005 Total Building Area ,098 Total Building Deficiency (a) Existing cargo processing and warehouse space. Source: HNTB Corporation,. The building utilization rate suggests that any new construction or renovation of existing cargo processing facilities would incorporate a more sustainable design to accommodate varying tenant requirements with increased efficiency. Although the building utilization rate provides an overview of how efficiently facilities are being used, it does not account for anomalies in the characteristics of a given market that may influence facility efficiency. It is expected that, prior to PAL 5, the existing cargo facilities would be reconfigured to accommodate multiple tenants in appropriately sized facilities. It is recommended that the Port redevelop the North, Northeast, and Southeast Cargo Complexes into flexible cargo facilities to meet the varying needs of multiple tenants. For example, the former Delta Cargo Complex, also known as the Northeast Cargo Complex, could be redeveloped to accommodate the varying needs of multiple cargo tenants. 5-8
129 5.2 Ramp Area The Airport currently provides approximately 256,000 square yards of cargo ramp area. Air cargo ramp area requirements vary based on aircraft size and tenant requirements and may be constrained due to available land or the airport layout. The Jacobs Consultancy Team s experience indicates that a planning criterion of 7.5 square feet of ramp per forecast ton of all-cargo airline freight is appropriate to determine cargo aircraft parking ramp space requirements at the Airport. This criterion takes into account aircraft parking and staging areas for freight and support vehicles. Airline belly cargo operations, however, require a minimal amount of ramp area, which is generally used for ground service vehicle loading and storage. For planning purposes, a factor of 1.0 square foot of ramp per forecast ton of belly cargo freight was applied. As shown in Table 5-5, approximately 565,000 square yards of ramp space would be required for PAL 5, resulting in a deficiency of approximately 309,000 square yards. The majority of this long-term expansion relates to all-cargo operations. Table 5-5 CARGO RAMP REQUIREMENTS (square yards, in thousands) 2007 (a) PAL PAL PAL PAL PAL Belly Cargo Ramp Area All-Cargo Ramp Area Total Ramp Area Total Ramp Deficiency (a) Existing cargo ramp. Source: HNTB Corporation,. 5.3 Landside Area Cargo landside areas consist of truck circulation, parking areas for visitors and employees, loading docks, and landscaping. For planning purposes, the cargo landside area approximately equals the required cargo building area (calculated as described in Section 5.1). The required landside area is summarized in Table 5-6. Cargo tenants at the Airport have indicated their desire to have more convenient public landside access for their customers. 5-9
130 Table 5-6 CARGO LANDSIDE REQUIREMENTS (square feet, in thousands) 2007 PAL PAL PAL PAL PAL Landside Area ,098 Source: HNTB Corporation,. 5.4 Cargo Land Area Summary The aggregate requirements for cargo operations at the Airport are presented in Table 5-7. In total, approximately 167 acres of land would be needed to support cargo operations at the Airport for PAL 5. Approximately 206 acres of land are currently available for cargo operations. Table 5-7 CARGO LAND AREA REQUIREMENTS (square feet in thousands, except as noted) 2007 (a) PAL PAL PAL PAL PAL Cargo Building Area ,098 Cargo Ramp Area (square yards) Cargo Landside Area ,098 Cargo Land Area Required (acres) (a) Existing cargo areas Source: HNTB Corporation,. From a land use perspective, this area would be sufficient to accommodate the forecast cargo tonnage through PAL 5; however, from a facilities perspective, some degree of flexibility would be required to reconfigure and redevelop the existing cargo footprints to more efficiently use facilities and ramp areas. 5-10
131 6. GENERAL AVIATION This section summarizes general aviation (GA) facility requirements at the Airport. GA activity includes all flight operations by aircraft other than scheduled or charter passenger aircraft and military aircraft. GA covers a range of activity from recreational flights on small single-engine or multi-engine propeller-driven aircraft to operations by larger corporate or business jet aircraft. GA facility requirements are expressed in terms of total land area and were developed considering existing facilities, the GA market, facilities at benchmark airports, activity forecasts, and FAA policy. 6.1 Background As presented in Technical Memorandum No. 2 Aviation Demand Forecasts, for the median scenario, the total number of GA operations is forecast to increase an average of 0.5% per year from 2007 through 2035, which includes a period of continued decline between 2007 and Approximately 27,600 GA operations were conducted at the Airport in Approximately 32,500 GA operations are forecast for Historically, itinerant operations have accounted for the majority of GA operations at the Airport; in 2006 and 2007, itinerant operations accounted for approximately 97% and 98%, respectively, of total GA operations. Approximately 60% to 70% of itinerant GA aircraft at the Airport are jets and turboprops, which are generally associated with business aviation; these customers choose to operate at PDX because of its proximity to downtown Portland and Vancouver. Although southwest Washington has a number of GA airports, only Kelso/Longview Regional Airport has the capability to serve the business aviation market, but that airport lacks many of the facilities that make PDX more desirable. According to a recent long-range aviation study completed by the Washington State Department of Transportation (WSDOT), business aviation and turbine aircraft operations have been growing faster than other components of aviation. The FAA s latest forecasts indicate that business use of general aviation will continue to expand more rapidly than personal/sport use. This trend is true at the Airport, as an increasing percentage of total GA operations are in the business aviation segment of GA and operating jet or turboprop aircraft. This trend is reflected in the Port s philosophy toward managing its reliever airports and working with other airport operators to provide reasonable and appropriate alternatives to the Airport for smaller piston-engine aircraft. The Port is committed to serving GA by providing facilities and services that are reasonable and appropriate to managing demand across a system of airports serving the region. Reliever airports for PDX include Hillsboro Airport, Troutdale Airport, and Mulino Airport operated by the Port, as well as Aurora State Airport, Scappoose Industrial Airpark, Pearson Field, Grove Field Airport, and Kelso/Longview Regional Airport. Each of these airports serves a unique need in a larger system, providing essential alternatives for smaller GA aircraft, thereby reducing congestion for commercial service aircraft and larger business aviation aircraft operating at PDX. 6-1
132 The WSDOT study also postulated that needs and expectations regarding types and quality of aviation services will increase along with increases in business jet traffic. Accordingly, airport sponsors should prepare for new or expanded fixed base operator (FBO) services with appropriate land use planning, developing up-to-date minimum standards for aeronautical service providers, and developing appropriate rates, charges, and leasing policies. GA services offered at airports such as PDX typically include aircraft fuel and oil sales, aircraft parking, hangar storage, maintenance, aircraft charters or rentals, deicing, and ground services, such as towing and baggage handling. These services are typically provided by one or more FBOs or specialized aeronautical service operators, which provide any one or combination of commercial aeronautical services with the exception of aircraft fueling. 6.2 Current Situation Requirements for additional GA facilities (i.e., land to accommodate an additional FBO or additional GA service providers) at PDX are driven by FAA policy and the Port s philosophy toward managing a system of airports serving the needs of a growing region. The Port s management philosophy has evolved with the growth of the region, regional economy, the development of PDX, other regional airports, and the evolution of the general aviation industry. In general, this philosophy is based on an understanding that the segment of the GA market most appropriate for PDX is the high-end cabin class business aviation aircraft. While the Port cannot prohibit smaller GA aircraft from using the Airport, its general approach is to continue to invest in more suitable reliever airports to accommodate that segment of the GA market. This approach is consistent with the Port s desire to balance the Airport s primary role as the region s primary commercial service airport with the desire to provide sufficient land for the development of additional GA facilities appropriate to PDX and continue to satisfy FAA grant assurances. According to the FAA, when airport owners or sponsors, planning agencies, or other organizations accept funds from FAA-administered airport financial assistance programs, they must agree to certain obligations (or assurances). These assurances require the recipients to maintain and operate their airports in accordance with specified conditions. The Port receives funding from the FAA s Airport Improvement Program (AIP). The AIP provides grants to public agencies for the planning and development of public-use airports within the National Plan of Integrated Airport Systems. Since the AIP is an FAA-administered financial assistance program, by accepting AIP funding, the Port also agrees to certain grant assurances. 6-2
133 As specified by the FAA in Assurances Airport Sponsors, Paragraph 23: Exclusive Rights, March 2005: [The airport sponsor] will permit no exclusive right for the use of the airport by any person providing, or intending to provide, aeronautical services to the public. For purposes of this paragraph, the providing of the services at an airport by a single fixed-based [sic] operator shall not be construed as an exclusive right if both of the following apply: It would be unreasonably costly, burdensome, or impractical for more than one fixed-based operator to provide such services, and If allowing more than one fixed-based [sic] operator to provide such services would require the reduction of space leased pursuant to an existing agreement between such single fixedbased [sic] operator and such airport. A strict interpretation of the grant assurances would imply that the Port should either (1) reserve land that could be developed by willing GA service providers should that demand materialize, or (2) make the case that it would be unreasonably costly, burdensome, or impractical for additional GA service providers to operate at the Airport. Reserving land for the development of additional GA facilities would be consistent with the Port s policy of compliance with FAA grant assurances and a management philosophy that promotes competition and balanced use of the region s system of airports in a way that is reasonable, appropriate, and applicable to each airport s distinct role. 6.3 Approach to Determining GA Requirements The amount of land that should be reserved for the development of additional GA facilities was determined considering the aviation demand forecasts, current business aviation activity, potential minimum commercial aeronautical activity standards, land areas occupied by FBOs and related GA facilities at other airports, and minimum standards for GA development at other airports Potential General Aviation Minimum Commercial Aeronautical Activity Standards Airport staff is considering the development of minimum standards that would apply to all potential GA service providers at the Airport. The purpose of the minimum standards would be to encourage, promote, and ensure: Consistent delivery of high quality GA products, services, and facilities to Airport customers 6-3
134 Development of high-quality GA improvements GA safety and security The economic health of GA businesses These minimum standards would require FBOs and/or other GA service providers to have an adequate amount of land. For example, if the FBO owns or leases the aircraft ramp, 8 acres may be required. If the FBO does not own or lease that aircraft ramp, but manages the Port s ramp, 4 acres may be required. Additionally, minimum land requirements for other commercial GA operators may be identified. These would include aircraft maintenance, avionics, charter, sales, and storage. For planning purposes, it was assumed that minimum standards for land area would vary between 0.5 acre to 1.0 acre for specialized aeronautical service operators, depending on the type of service provided Fixed Base Operator Facilities at Other Airports Land areas occupied by FBOs at other airports are described below. Additionally, minimum FBO commercial aeronautical activity standards at San Francisco International Airport are identified. A comparison of FBO land areas and minimum commercial aeronautical activity standards is presented in Table 6-1. The airports included in Table 6-1 were not specifically selected for the purpose of comparing GA facilities. Rather, these airports (with the exception of Memphis International Airport) were selected as benchmark airports for this Master Plan for their similarity to PDX at current and future activity levels. The table illustrates: (1) minimum standards at San Francisco International Airport, (2) the range of area allocated to FBOs, and (3) that the number of FBOs at airports varies. Table 6-1 FBO AREA COMPARISON (acres) Airport FBO 1 FBO 2 Total Minimum Standards Tampa International Airport San Francisco International Airport Memphis International Airport Sources: Jacobs Consultancy, September San Francisco International Airport staff, August Tampa International Airport staff, August
135 Tampa International Airport Tampa International Airport has two FBOs. The Tampa International Jet Center occupies a 21-acre facility located on the extreme southeast corner of the airport, adjacent to the facilities of the other FBO. Services provided include: fueling, aircraft maintenance, concierge services, automobile rental, conference facilities, pilot lounge, crew cars, and courtesy transportation. The other FBO, Signature Flight Support, encompasses approximately 18 acres and offers its customers the following services: fueling, charter services, parts sales, avionics services, airframe maintenance, aircraft cleaning, and U.S. Customs and Border Protection services. Memphis International Airport The Memphis International Airport s two FBOs Signature Flight Support and Wilson Air Center are located in separate areas of the airport and provide a wide range of services to GA users. Signature provides a complete range of GA services, including fueling, aircraft basing, airframe and engine repair and maintenance, flight instruction, ground handling, and aircraft charters. Signature leases 11 acres of land from the Memphis-Shelby County Airport Authority. Wilson, either directly or through sublessees, offers a wide-range of GA services, including fueling, airframe and engine repair and maintenance, flight instruction, ground handling, and aircraft charters. Wilson leases 19 acres of land from the Authority. San Francisco International Airport San Francisco International Airport s sole FBO Signature Flight Support occupies a 14-acre site that accommodates an executive air terminal, two hangars, ground service equipment storage space, and aircraft and vehicle parking. Signature s services include aircraft fueling, maintenance, line service, minor aircraft repairs, conference rooms, and other amenities. Minimum standards for FBO services have also been developed for San Francisco International Airport. As part of these minimum standards, each FBO operating at San Francisco International Airport must occupy not less than 13 acres of land Requirements for Future General Aviation Facilities In keeping with the Port s management philosophy of reserving land area to accommodate additional GA service providers (if demand materializes), ensuring a competitive environment, and promoting balanced use of the region s system of airports in a way that is reasonable, appropriate, and applicable to each airport s distinct role, it 6-5
136 is recommended that an additional 10 to 20 acres be reserved for future GA facilities. This recommendation is based on the following assumptions: The existing GA area may be relocated to facilitate other development essential to the Airport s primary role related to passengers and air cargo. Existing or future GA areas do not need to be in a contiguous parcel and do not need to be adjacent to the passenger terminal. Existing GA leaseholders will retain the land they currently lease or the equivalent at a future location. An additional FBO will require a site size consistent with site sizes at similar airports. Additional land will be reserved for specialized aeronautical service operators. An FBO or specialized aeronautical service operator may need more or less land depending on the geometry of a particular parcel. GA parcels must have public roadway access and access to the airfield. An increasing percentage of GA aircraft using the Airport are jets and turboprops; this trend is likely to continue and is consistent with the business aviation segment of GA that is most appropriate to PDX. This segment of GA elects to operate at PDX because the Airport is better suited to larger jet aircraft (e.g., multiple approaches and long runways), offers connections to commercial airline service, provides better access to commercial transportation services (e.g., taxicabs and town cars), and is more accessible to clients living or doing business in Portland and Vancouver. 6-6
137 7. MILITARY Military units at the Airport include the 142nd Fighter Wing of the Oregon Air National Guard (ORANG), the 224th Combat Communications Squadron, the 272nd Combat Communications Squadron, the 366th Operating Location-Alpha Communications Squadron, and the 123rd Weather Flight unit. The units are located on 246 acres of land leased to ORANG until 2029, when the lease expires. The military has indicated that it intends to request an extension to its lease. The scope of this related to the military is limited to planning the appropriate location on the Airport for military area requirements, as determined by the military. At present, that requirement is being reviewed by the 142nd Fighter Wing of ORANG. For the purposes of this, it was assumed that the current lease area, 246 acres, will satisfy the military requirement through PAL 5 (2035). 7-1
138 8. AIRLINE SUPPORT This section identifies the amount of land that should be preserved for future growth of airline support facilities at PDX for inclusion in the land use plan. The requirements for each area were identified based on discussions with Port staff, observations of existing facilities, forecast growth at PDX, and comparison of similar facilities at other airports. 8.1 Airline Maintenance and Support Approximately 28 acres of land at the Airport are currently allocated to airline maintenance and support functions. Two facilities are currently used for airline maintenance, the Horizon Air maintenance facility, located just south of the ground run-up enclosure near the intersection of the south parallel and crosswind runways, and the aircraft maintenance hangar, located in the AirTrans Cargo Center at the south end of the crosswind runway. Table 8-1 provides the building size and ramp area for these facilities. Other, limited maintenance facilities include the Ameriflight facility located on the Southwest Ramp and the SkyWest Airlines facility located north of NE Airport Way. Table 8-1 AIRLINE MAINTENANCE AND SUPPORT FACILITY AND RAMP AREAS PDX Maintenance Facilities Building Size (square feet) Ramp Area (square yards) Total Acres Horizon Air Maintenance Facility 150,935 47, Aircraft Maintenance Center 289,000 38, Total 439,935 86, Source: Port of Portland staff. Airline maintenance hangars and facilities are typically constructed by the airlines based on corporate business decisions and are not necessarily related to the volume of airline traffic at a given airport. It is, therefore, difficult to estimate the requirement for such facilities. The factors that typically influence the construction of such facilities include the location of airline headquarters, hubbing characteristics, fleet size, maintenance scheduling, climate, and the location of terminating flights. As indicated in the facility requirements Focus Group Meeting #1 held on June 10 and 11, 2008, there may be no imminent need to expand the maintenance facilities at the Airport, as no plans are yet in place to change existing airline maintenance operations. However, Port staff expressed a need, as further discussed in Section 9.3, to provide additional storage facilities for ground service equipment. 8-1

139 8.2 Deicing Facilities and Glycol Storage The Port s existing deicing runoff collection system became operational in November 2003 following a 3-year construction period. The system protects the Columbia Slough by controlling the release of deicing runoff to ensure that biological organisms in the Columbia Slough will not use up oxygen at a rate deemed unhealthy for aquatic life. The Port uses a combination of glycol (a naturally biodegradable form of alcohol) and warm water to deice aircraft parking ramps and aircraft. Concentrated runoff is currently treated at the City of Portland s wastewater treatment plant. Dilute runoff is diverted to temporary storage and then discharged to the Columbia Slough. The existing deicing system is depicted on Figure 8-1 below. Figure 8-1 PDX DEICING SYSTEM Source: Port of Portland. 8-2
 New permitted")
140 The Port has completed schematic design of deicing system enhancements and intends to complete final design by June The system improvements are scheduled to be operational by The key elements of the deicing system enhancements include: Onsite biological treatment Expansion of collection area to include the west airfield (drainage basin one, Figure 8-2) New permitted Columbia River outfall Additional storage capacity New pump stations and piping The proposed deicing system enhancements are shown on Figure 8-2. Figure 8-2 PROPOSED DEICING SYSTEM ENHANCEMENTS Source: Port of Portland. 8-3
Appendix B Ultimate Airport Capacity and Delay Simulation Modeling Analysis
 Appendix B ULTIMATE AIRPORT CAPACITY & DELAY SIMULATION MODELING ANALYSIS B TABLE OF CONTENTS EXHIBITS TABLES B.1 Introduction... 1 B.2 Simulation Modeling Assumption and Methodology... 4 B.2.1 Runway
1.0 Project Background Mission Statement and Goals Objectives of this Sustainable Master Plan
 TABLE OF CONTENTS CHAPTER 1 INTRODUCTION 10 Project Background 1-1 11 Mission Statement and Goals 1-1 12 Objectives of this Sustainable Master Plan 1-2 CHAPTER 2 INVENTORY 20 Airport Background 2-1 201
AIRPORT MASTER PLAN UPDATE
 AIRPORT MASTER PLAN UPDATE PENSACOLA INTERNATIONAL AIRPORT Technical Advisory Committee Meeting #2 June 20, 2017 Agenda» Introduction» Facility Requirements Airside Terminal Landside General Aviation Cargo
According to FAA Advisory Circular 150/5060-5, Airport Capacity and Delay, the elements that affect airfield capacity include:
 4.1 INTRODUCTION The previous chapters have described the existing facilities and provided planning guidelines as well as a forecast of demand for aviation activity at North Perry Airport. The demand/capacity
Table of Contents. Master Plan March 2014 TOC i Spokane International Airport
 Table of Contents Page Chapter 1 Inventory 1. Introduction... 1 1 1.1 Community Profile... 1 2 1.1.1 Location and Setting... 1 1 1.1.2 Climate... 1 2 1.1.3 Socioeconomic Conditions... 1 5 1.1.4 Area Land
BNA Master Plan Update Community Advisory Committee Meeting No. 5
 A Six Sigma Organization BNA Master Plan Update Community Advisory Committee Meeting No. 5 September 19, 2012 Introductions MNAA Staff RW Armstrong Team Albersman & Armstrong, Ltd. Atkins North America,
TABLE OF CONTENTS. General Study Objectives Public Involvement Issues to Be Resolved
 TABLE OF CONTENTS Description Page Number LIST OF ACRONYMS... a CHAPTER ONE INTRODUCTION General... 1-1 Study Objectives... 1-1 Public Involvement... 1-2 Issues to Be Resolved... 1-2 CHAPTER TWO EXISTING
The purpose of this Demand/Capacity. The airfield configuration for SPG. Methods for determining airport AIRPORT DEMAND CAPACITY. Runway Configuration
 Chapter 4 Page 65 AIRPORT DEMAND CAPACITY The purpose of this Demand/Capacity Analysis is to examine the capability of the Albert Whitted Airport (SPG) to meet the needs of its users. In doing so, this
The demand/capacity analysis was performed utilizing Federal Aviation Administration (FAA) publications, including the following:
 publications, including the following:") Chapter Three To properly plan for the future of Monterey Regional Airport, it is necessary to examine the capacities of the key airport systems. This chapter uses the results of the forecasts prepared
Chapter Three To properly plan for the future of Monterey Regional Airport, it is necessary to examine the capacities of the key airport systems. This chapter uses the results of the forecasts prepared
Draft Concept Alternatives Analysis for the Inaugural Airport Program September 2005
 Draft Concept Alternatives Analysis for the Inaugural Airport Program September 2005 Section 3 - Refinement of the Ultimate Airfield Concept Using the Base Concept identified in Section 2, IDOT re-examined
Washington Dulles International Airport (IAD) Aircraft Noise Contour Map Update
 Aircraft Noise Contour Map Update") Washington Dulles International Airport (IAD) Aircraft Noise Contour Map Update Ultimate ASV, Runway Use and Flight Tracks 4th Working Group Briefing 8/13/18 Meeting Purpose Discuss Public Workshop input
Washington Dulles International Airport (IAD) Aircraft Noise Contour Map Update Ultimate ASV, Runway Use and Flight Tracks 4th Working Group Briefing 8/13/18 Meeting Purpose Discuss Public Workshop input
DRAFT FINAL REPORT AIRPORT MASTER PLAN. Rifle Garfield County Airport Revised May 15, 2014
 DRAFT FINAL REPORT AIRPORT MASTER PLAN Rifle Garfield County Airport Revised May 15, 2014 As required by Paragraph 425.B(4) of FAA Order 5100.38C, Airport Improvement Program (AIP) Handbook: The preparation
BNA Master Plan Update Public Meeting No. 2
 A Six Sigma Organization BNA Master Plan Update Public Meeting No. 2 September 18, 2012 Agenda BNA Master Plan Update Consultants Status of the BNA Master Plan Update Workstation Boards Forecasts of Aviation
Hartford-Brainard Airport Potential Runway Closure White Paper
 Hartford-Brainard Airport Potential Runway 11-29 Closure White Paper June 2012 In recent years there has been discussion regarding the necessity of Runway 11-29 to the Hartford- Brainard Airport (HFD)
SAN JOSÉ INTERNATIONAL AIRPORT
 SAN JOSÉ INTERNATIONAL AIRPORT NEAR-TERM TERMINAL CAPACITY ANALYSIS AIRPORT COMMISSION AUGUST 14, 2017 August 14, 2017 AGENDA 1. Forecast Review (with 14 MAP High Case) 2. Gate Requirements and Aircraft
FORECASTING FUTURE ACTIVITY
 EXECUTIVE SUMMARY The Eagle County Regional Airport (EGE) is known as a gateway into the heart of the Colorado Rocky Mountains, providing access to some of the nation s top ski resort towns (Vail, Beaver
Draft Concept Alternatives Analysis for the Inaugural Airport Program September 2005
 Draft Concept Alternatives Analysis for the Inaugural Airport Program September 2005 Section 1 - Introduction This report describes the development and analysis of concept alternatives that would accommodate
Prepared By: Mead & Hunt, Inc Port Lansing Road Lansing, MI 48906
 Master Plan The preparation of this document was financed in part through a planning grant from the Federal Aviation Administration (FAA) as provided under Section 505 of the Airport and Airway Improvement
MASTER PLAN GEORGE BUSH INTERCONTINENTAL AIRPORT/HOUSTON. Houston Airport System Houston, Texas DRAFT TECHNICAL REPORT.
 in association with AirProjects Inc. Conway Consulting Gunda Corporation Quadrant Consultants RdlR Architects Sunland Group DRAFT TECHNICAL REPORT MASTER PLAN Prepared for Houston Airport System Houston,
The presentation was approximately 25 minutes The presentation is part of Working Group Meeting 3
 This is the presentation for the third Master Plan Update Working Group Meeting being conducted for the Ted Stevens Anchorage International Airport Master Plan Update. It was given on Thursday March 7
Las Vegas McCarran International Airport. Capacity Enhancement Plan
 Las Vegas McCarran International Airport Capacity Enhancement Plan Las Vegas McCarran International Airport Capacity Enhancement Plan September 1994 Prepared jointly by the U.S. Department of Transportation,
Tampa International Airport Master Plan Update. December 12, 2012
 Tampa International Airport Master Plan Update December 12, 2012 1 Prior Presentation Consolidated rental car and people mover Decongest curbsides and roadways Enable rental car growth Gain long term parking
MASTER PLAN UPDATE. Planning Advisory Committee (PAC) FRESNO YOSEMITE INTERNATIONAL AIRPORT. Meeting #4
 FRESNO YOSEMITE INTERNATIONAL AIRPORT. Meeting #4") MASTER PLAN UPDATE Planning Advisory Committee (PAC) FRESNO YOSEMITE INTERNATIONAL AIRPORT Meeting #4 December 14, 2017 Today s Agenda o Welcome o Introductions o Progress update o Alternatives analysis
MASTER PLAN UPDATE Planning Advisory Committee (PAC) FRESNO YOSEMITE INTERNATIONAL AIRPORT Meeting #4 December 14, 2017 Today s Agenda o Welcome o Introductions o Progress update o Alternatives analysis
SouthwestFloridaInternational Airport
 SouthwestFloridaInternational Airport SouthwestFloridaInternationalAirportislocatedinLee CountyalongtheGulfCoastofSouthFlorida,tenmiles southeastofthefortmyerscentralbusinessdistrict. Theprimaryhighwayaccesstotheairportfrom
STUDY WORK GROUP MEETING No. 3. November 29, 2016
 STUDY WORK GROUP MEETING No. 3 November 29, 2016 Agenda Welcome and introductions Update project schedule Brief overview of previous SWG meeting Update on aviation forecasts Introduction to airfield demand/capacity
TABLE OF CONTENTS. Airport Master Plan Update Manchester-Boston Regional Airport. W:\ _Manchester\MPU\Final\Executive Summary.
 TABLE OF CONTENTS Section Page Section Page 1.0 INTRODUCTION... 1 1.1 Purpose of an... 1 1.2 Goals and Objectives... 1 1.3 Mission Statement... 2 1.4 Stakeholder/Public Involvement... 2 1.5 Major Deliverables...
The CLE Master Plan Includes:
 The CLE Master Plan Includes: An inventory of existing conditions Forecasting future demand and analyzing future needs Evaluating alternative development scenarios Preparing the Airport Layout Plan Preparing
Tallahassee International Airport Master Plan. Technical Advisory Committee Meeting #2 October 19, 2016
 Tallahassee International Airport Master Plan Technical Advisory Committee Meeting #2 October 19, 2016 Agenda Welcome / Introductions Master Plan Process and Project Status Forecast of Aviation Demand
TABLE OF CONTENTS. Washington Aviation System Plan Update July 2017 i
 TABLE OF CONTENTS Chapter 1 Overview... 1-1 1.1 Background... 1-1 1.2 Overview of 2015 WASP... 1-1 1.2.1 Aviation System Performance... 1-2 1.3 Prior WSDOT Aviation Planning Studies... 1-3 1.3.1 2009 Long-Term
Forecast and Overview
 Forecast and Overview DENVER INTERNATIONAL AIRPORT Overall goals of the (MPR): Work with DEN to refine the preferred airport development plan to guide the development over an approximate 25-year planning
CATCODE ] CATCODE
![CATCODE ] CATCODE](/thumbs/82/85644630.jpg "CATCODE ] CATCODE") Runways. FAC: 1111 CATCODE: 111111 OPR: AFCEC/COS OCR: AF/A3O-A 1.1. Description. The runway is the paved surface provided for normal aircraft landings and take offs. Runways are classified as either Class
Runways. FAC: 1111 CATCODE: 111111 OPR: AFCEC/COS OCR: AF/A3O-A 1.1. Description. The runway is the paved surface provided for normal aircraft landings and take offs. Runways are classified as either Class
Gerald R. Ford International Airport Authority Master Plan Update A World Class Gateway
 Gerald R. Ford International Airport Authority Master Plan Update A World Class Gateway Master Plan Advisory Committee (MPAC) Alternatives September 28, 2017 AGENDA Review of Previous Work Ultimate Land
Savannah / Hilton Head International Airport Master Plan Update
 EXECUTIVE SUMMARY Savannah / Hilton Head International Airport Master Plan Update Prepared for: The Savannah Airport Commission Prepared by: URS Corporation In Association With: RS&H and Ruth and Associates,
Airport Master Plan. Brookings Regional Airport. Runway Runway 17-35
 Runway 17-35 Airport Master Plan Runway 12-30 Brookings Regional Airport Table of Contents Table of Contents Chapter 1: Master Plan Goals... 1-1 1.1. Introduction... 1 1.2. Objective 1 Identify improvements
RNP AR APCH Approvals: An Operator s Perspective
 RNP AR APCH Approvals: An Operator s Perspective Presented to: ICAO Introduction to Performance Based Navigation Seminar The statements contained herein are based on good faith assumptions and provided
Draft Concept Alternatives Analysis for the Inaugural Airport Program September 2005
 Section 10 Preferred Inaugural Airport Concept 10.0 Introduction The Preferred Inaugural Airport Concept for SSA was developed by adding the preferred support/ancillary facilities selected in Section 9
CHAPTER 4: ALTERNATIVES
 MSP Long Term Comprehensive Plan Update Metropolitan Airports Commission 4.1 INTRODUCTION CHAPTER 4: ALTERNATIVES Several alternatives were developed and evaluated based on their capability to meet the
City of Austin Department of Aviation Austin Bergstrom International Airport 2040 Master Plan. Public Workshop #2 April 19, 2018
 City of Austin Department of Aviation Austin Bergstrom International Airport 2040 Master Plan Public Workshop #2 April 19, 2018 DISCUSSION TOPICS Introduction About the Master Plan Public Workshop #1 Recap
Table of Contents. Overview Objectives Key Issues Process...1-3
 Table of Contents Chapter One Introduction Overview...1-1 Objectives...1-1 Key Issues...1-2 Process...1-3 Chapter Two Inventory of Existing Conditions Airport Setting...2-1 Locale...2-1 Airport Surroundings...2-5
Greater Orlando Aviation Authority Orlando International Airport One Jeff Fuqua Boulevard Orlando, Florida Memorandum TO: FROM:
 Greater Orlando Aviation Authority One Jeff Fuqua Boulevard Orlando, Florida 32827-4399 Memorandum TO: FROM: Participating Airlines Phil Brown, Executive Director DATE: SUBJECT: Rate Methodology for FY
CHAPTER 4 DEMAND/CAPACITY ANALYSIS
 CHAPTER DEMAND/CAPACITY ANALYSIS INTRODUCTION The demand/capacity analysis examines the capability of the airfield system at Blue Grass Airport (LEX) to address existing levels of activity as well as determine
CHAPTER 5 - FACILITY REQUIREMENTS
 CHAPTER 5 - FACILITY REQUIREMENTS This chapter identifies the requirements for airfield and landside facilities to accommodate the forecast demand level. Facility requirements have been developed for the
DEVELOPMENT OF TOE MIDFIELD TERMINAL IROJECT CAPACITY ENHANCEMENT REPORT DEPARTMENT OF AVIATION TOM FOERSTER CHAIRMAN BARBARA HAFER COMMISSIONER
 PETE FLAHERTY COMMISSIONER TOM FOERSTER CHAIRMAN DEPARTMENT OF AVIATION BARBARA HAFER COMMISSIONER STEPHEN A. GEORGE DIRECTOR ROOM M 134, TERMINAL BUILDING GREATER PITTSBURGH INTERNATIONAL AIRPORT PITTSBURGH,
Airport Master Plan for Montgomery-Gibbs Executive Airport PAC Meeting #3
 Airport Master Plan for Montgomery-Gibbs Executive Airport PAC Meeting #3 Agenda > Introductions > Public Meetings Overview > Working Paper 3 - Facility Requirements > Working Paper 4 - Environmental Baseline
CHAPTER 1 EXECUTIVE SUMMARY
 CHAPTER 1 EXECUTIVE SUMMARY 1 1 EXECUTIVE SUMMARY INTRODUCTION William R. Fairchild International Airport (CLM) is located approximately three miles west of the city of Port Angeles, Washington. The airport
DRAFT. Airport Master Plan Update Sensitivity Analysis
 Dallas Love Field Sensitivity Analysis PREPARED FOR: The City of Dallas Department of Aviation PREPARED BY: RICONDO & ASSOCIATES, INC. August 201 Ricondo & Associates, Inc. (R&A) prepared this document
1.1.3 Taxiways. Figure 1-15: Taxiway Data. DRAFT Inventory TYPICAL PAVEMENT CROSS-SECTION LIGHTING TYPE LENGTH (FEET) WIDTH (FEET) LIGHTING CONDITION
 WIDTH (FEET) LIGHTING CONDITION") 1.1.3 Taxiways EWN has an extensive network of taxiways and taxilanes connecting the terminal, air cargo, and general aviation areas with the runways as listed in Figure 1-15. A 50-foot wide parallel taxiway
1.1.3 Taxiways EWN has an extensive network of taxiways and taxilanes connecting the terminal, air cargo, and general aviation areas with the runways as listed in Figure 1-15. A 50-foot wide parallel taxiway
Merritt Island Airport
 TABLE OF CONTENTS CHAPTER 1 INTRODUCTION... 1-1 INTRODUCTION AND PROJECT OVERVIEW... 1-1 General Guidelines... 1-1 Prior Planning Documentation... 1-2 Key Issues... 1-2 Goals and Objectives... 1-2 Regulatory
FORT LAUDERDALE-HOLLYWOOD INTERNATIONAL AIRPORT ENVIRONMENTAL IMPACT STATEMENT DRAFT
 D.3 RUNWAY LENGTH ANALYSIS Appendix D Purpose and Need THIS PAGE INTENTIONALLY LEFT BLANK Appendix D Purpose and Need APPENDIX D.3 AIRFIELD GEOMETRIC REQUIREMENTS This information provided in this appendix
RSAT RUNUP ANALYSIS 1. INTRODUCTION 2. METHODOLOGY
 RSAT RUNUP ANALYSIS 1. INTRODUCTION The FAA Runway Safety Action Team (RSAT) is a team of FAA staff that works with airports to address existing and potential runway safety problems and issues. The RSAT
Executive Summary. MASTER PLAN UPDATE Fort Collins-Loveland Municipal Airport
 Executive Summary MASTER PLAN UPDATE Fort Collins-Loveland Municipal Airport As a general aviation and commercial service airport, Fort Collins- Loveland Municipal Airport serves as an important niche
Westover Metropolitan Airport Master Plan Update
 Westover Metropolitan Airport Master Plan Update June 2008 INTRODUCTION Westover Metropolitan Airport (CEF) comprises the civilian portion of a joint-use facility located in Chicopee, Massachusetts. The
MASTER PLAN UPDATE GRANT NUMBER
 T MASTER PLAN UPDATE D R AF GRANT NUMBER 3-48-0062-42 MAY 2015 1. Introduction... 1-1 1.1 History of Dallas Love Field... 1-1 1.2 Airport Setting... 1-2 1.2.1 DALLAS-FORT WORTH-ARLINGTON METROPOLITAN STATISTICAL
Executive Summary DRAFT
 TABLE OF CONTENTS 1. Introduction... 6 2. Aviation Forecasts... 7 3. Demand/Capacity and Facility Requirements... 10 4. Terminal Demand/Capacity Analysis... 14 5. Landside Development Needs... 17 6. Support
Airport Engineering Lectures
 Airport II- Airport. II-1 Definitions System capacity: Ability efficiently process the transported units. Aircrafts Passengers Baggage cargo Public access facilitation Runway Taxiway Gate Terminal Building
Agenda: SASP SAC Meeting 3
 Agenda: SASP SAC Meeting 3 Date: 04/12/18 Public Involvement Plan Update Defining the System Recommended Classifications Discussion Break Review current system Outreach what we heard Proposed changes Classification
Airport Master Plan for. Brown Field Municipal Airport PAC Meeting #3
 Airport Master Plan for Brown Field Municipal Airport PAC Meeting #3 Public Meeting #1 > 8/24/17 from 5:30 to 8:00 pm > 41 attendees signed-in > Comments: > EAA area > Environmental constraints > Focus
Regional Jets ,360 A319/ , , , ,780
 Excel Tab Name: Seats (18 MAP) PASSENGER AIRLINE FLIGHT SCHEDULE CALCULATION RECORD Summary 17.2 MAP flight schedule* (with Southwest Airlines B737-800s changed to B737-700s) Number of Total Seats Avg.
APPENDIX D MSP Airfield Simulation Analysis
 APPENDIX D MSP Airfield Simulation Analysis This page is left intentionally blank. MSP Airfield Simulation Analysis Technical Report Prepared by: HNTB November 2011 2020 Improvements Environmental Assessment/
 Existing Conditions AIRPORT PROFILE Passenger Terminal Complex 57 air carrier gates 11,500 structured parking stalls Airfield Operations Area 9,000 North Runway 9L-27R 6,905 Crosswind Runway 13-31 5,276
LONG BEACH, CALIFORNIA
 LONG BEACH, CALIFORNIA 1 LONG BEACH, CALIFORNIA Airport Capacity Session Kent Duffy Senior Airport Planner Federal Aviation Administration kent.duffy@faa.gov 2 Agenda FAA Airport Capacity Guidance Airport
JOSLIN FIELD, MAGIC VALLEY REGIONAL AIRPORT DECEMBER 2012
 1. Introduction The Federal Aviation Administration (FAA) recommends that airport master plans be updated every 5 years or as necessary to keep them current. The Master Plan for Joslin Field, Magic Valley
Meeting Summary ABE Master Plan Project Advisory Group (PAG) Meeting #3 August 15, Shannon Eibert, C&S Companies
 Meeting #3 August 15, Shannon Eibert, C&S Companies") Meeting Summary ABE Master Plan Project Advisory Group (PAG) Meeting #3 August 15, 2017 Prepared by: File: Attendees: Shannon Eibert, C&S Companies N93.012.001 See Sign-In List A third meeting was held
Meeting Summary ABE Master Plan Project Advisory Group (PAG) Meeting #3 August 15, 2017 Prepared by: File: Attendees: Shannon Eibert, C&S Companies N93.012.001 See Sign-In List A third meeting was held
Planning, Development and Environment Committee
 Page 1 of 7 MEMORANDUM TO: Planning, Development and Environment Committee FROM: Neil Ralston, Airport Planner Airport Development (726-8129) SUBJECT: 2035 MSP LONG TERM COMPREHENSIVE PLAN FORECAST, FACILITY
Fort Wayne International Airport Master Plan Study. Executive Summary
 Fort Wayne International Airport Master Plan Study Executive Summary March 2012 Introduction Airport Background Forecast of Aviation Activity Development Plans Recommended Airfield & Access Development
1. Background and Proposed Action
 1. Background and Proposed Action This chapter describes Hillsboro Airport and the planning background for the proposed project. The Port of Portland (the Port) is the sponsor for the Hillsboro Airport
3.1 CRITICAL AIRCRAFT
 The purpose of the demand capacity analysis is to determine an airport s capacity and its ability to support the forecasted aviation demand. Facility requirements identify development, replacement, and/or
Master Plan Update Technical Advisory Committee Meeting
 Nashville International Airport Master Plan Update Technical Advisory Committee Meeting February 14, 2019 Agenda Welcome and Introductions Aviation Activity Forecast Facility Requirements Alternatives
Norfolk International Airport
 Norfolk International Airport Master Plan Update Technical Advisory Committee Meeting #1 Community Advisory Committee Meeting #1 January 24, 2018 Agenda Project Background Introductions Overview of Airport
Raleigh-Durham International Airport Airport Capacity Enhancement Plan. August 1991
 ii Raleigh-Durham International Airport Airport Capacity Enhancement Plan August 1991 Prepared jointly by the U.S. Department of Transportation, Federal Aviation Administration, Raleigh-Durham Airport
Appendix 6.1: Hazard Worksheet
 Appendix 6.1: Appendix 6.1: Ref. Condition, real or potential; that can cause injury, illness, etc. This is a prerequisite for an Airfield Hazards 1. Taxiway Geometry Direct access to runway from ramp
Table of Contents. List of Tables. Cincinnati/Northern Kentucky International Airport 2035 Master Plan Update
 Table of Contents 7.1. Airport Layout Plan (Existing Conditions)... 2 7.2. Airport Layout Plan (Future Conditions)... 3 7.3. Technical Data Sheet... 5 7.4. Commercial Terminal Area Drawing... 5 7.5. East
IDENTIFICATION AND EVALUATION OF ALTERNATIVES ST. PETERSBURG-CLEARWATER INTERNATIONAL AIRPORT
 IDENTIFICATION AND EVALUATION OF ALTERNATIVES ST. PETERSBURG-CLEARWATER INTERNATIONAL AIRPORT 7 7.1 GENERAL The primary objective of this chapter is to evaluate potential development alternatives and identify
Study Committee Meeting. September 2015
 W ki P T / Working Paper Two/ Study Committee Meeting September 2015 Agenda Introductions and Opening Comments Project Overview, Process, and Schedule Review Materials from Working Paper Two Comments,
Document prepared by MnDOT Office of Aeronautics and HNTB Corporation. MINNESOTA GO STATE AVIATION SYSTEM PLAN
 LAST UPDATE JULY 2013 Acknowledgements The preparation of this document was financed in part by a grant from the Federal Aviation Administration (Project No: 3-27-0000-07-10), with the financial support
Chapter 8.0 Implementation Plan
 Chapter 8.0 Implementation Plan 8.1 Introduction This chapter is the culmination of the analytical work accomplished in the previous chapters. The result is a prioritized list of the essential projects.
Master Plan Update Community Advisory Committee Kick-off Meeting
 Nashville International Airport Master Plan Update Community Advisory Committee Kick-off Meeting September 13, 2018 Agenda Welcome and Introductions Master Plan Objectives Master Plan Process BNA Vision
Chapter 3. Demand/Capacity & Facility Requirements
 Chapter 3. Demand/Capacity & Facility Requirements Chapter 3. DEMAND/CAPACITY & FACILITY REQUIREMENTS This chapter provides an assessment of future airport development requirements based upon the forecasts
Washington Dulles International Airport (IAD) Aircraft Noise Contour Map Update. Ultimate Operations 5th Working Group Briefing 9/25/18
 Aircraft Noise Contour Map Update. Ultimate Operations 5th Working Group Briefing 9/25/18") Washington Dulles International Airport (IAD) Aircraft Noise Contour Map Update Ultimate Operations 5th Working Group Briefing 9/25/18 Meeting Purpose Discuss methodology of Ultimate build scenario operations
Washington Dulles International Airport (IAD) Aircraft Noise Contour Map Update Ultimate Operations 5th Working Group Briefing 9/25/18 Meeting Purpose Discuss methodology of Ultimate build scenario operations
STAFF REPORT. Airport Land Use Plan Consistency Review: Santa Barbara Airport Master Plan. MEETING DATE: November 19, 2015 AGENDA ITEM: 7D
 STAFF REPORT SUBJECT: Airport Land Use Plan Consistency Review: Santa Barbara Airport Master Plan MEETING DATE: AGENDA ITEM: 7D STAFF CONTACT: Peter Imhof, Andrew Orfila RECOMMENDATION: Adopt findings
FUTURE PASSENGER PROCESSING. ACRP New Concepts for Airport Terminal Landside Facilities
 FUTURE PASSENGER PROCESSING ACRP 07-01 New Concepts for Airport Terminal Landside Facilities In association with: Ricondo & Associates, TransSolutions, TranSecure RESEARCH Background Research Objective
Public Information Meeting. September 2015
 W ki P O & T / Working Papers One & Two/ Public Information Meeting September 2015 Agenda Introductions and Opening Comments Project Overview, Process, and Schedule Review Materials from Working Papers
C > Capacity Analysis and Facility Requirements
 Buchanan Field Buchanan Field Airport Master Planning Program C. CAPACITY ANALYSIS & FACILITY REQUIREMENTS C > Capacity Analysis and Facility Requirements INTRODUCTION. The capacity of an airfield is primarily
Current and Forecast Demand
 Existing Facilities Jacksonville International Airport (JIA) is served by a number of airside and landside facilities. There are two runways that serve the airport in an open V configuration. The Annual
CHAPTER 1 BACKGROUND AND PROPOSED ACTION
 CHAPTER 1 BACKGROUND AND PROPOSED ACTION 1.0 INTRODUCTION An Environmental Assessment (EA) evaluates the effects of a proposed Federal action on the surrounding environment and is prepared in compliance
Preliminary Findings of Proposed Alternative
 Preliminary Findings of Proposed Alternative The attached drawing provides a schematic layout of the proposed alternative that will be discussed on July 27, 2010. A full report will follow and should be
SECTION 4 DEMAND/CAPACITY ANALYSIS AND FACILITY REQUIREMENTS
 SECTION 4 DEMAND/CAPACITY ANALYSIS AND FACILITY REQUIREMENTS This Section compares the projected demand and the existing capacity for the major elements of the Airport and establishes the facility requirements
4. Demand/Capacity Assessment and Facility Requirements
 4. This chapter presents an evaluation of the existing airfield facilities, buildings, and other facilities at the Airport and an assessment of their potential use under the demand scenarios defined for
MONTEREY REGIONAL AIRPORT MASTER PLAN TOPICAL QUESTIONS FROM THE PLANNING ADVISORY COMMITTEE AND TOPICAL RESPONSES
 MONTEREY REGIONAL AIRPORT MASTER PLAN TOPICAL QUESTIONS FROM THE PLANNING ADVISORY COMMITTEE AND TOPICAL RESPONSES Recurring topics emerged in some of the comments and questions raised by members of the
EXHIBIT E to Signatory Airline Agreement for Palm Beach International Airport RATE AND FEE SCHEDULE
 EXHIBIT E to Signatory Airline Agreement for Palm Beach International Airport RATE AND FEE SCHEDULE SECTION I - DEFINITIONS The following words, terms and phrases used in this Exhibit E shall have the
ENVISIONING AUSTIN s Airport of the Future
 ENVISIONING AUSTIN s Airport of the Future ABIA 2040 Master Plan Public Workshop #1 October 12, 2017 WHAT IS THE PURPOSE OF TODAY S WORKSHOP? Educate & Inform Solicit Input Answer Questions 2 WHAT IS A
Chapter III - Demand/Capacity and Facility Requirements
 Chapter III - Demand/Capacity and Facility Requirements The facility requirements identified in this chapter are summarized on Exhibit III.1. The future requirements serve to determine which airport facilities
Lake Tahoe Airport Master Plan Public Meeting March 16, 2015
 Lake Tahoe Airport Master Plan Public Meeting March 16, 2015 What is an Airport Master Plan? a comprehensive study of an airport [that] usually describes the short, medium, and long term development plans
CHAPTER 1: INTRODUCTION
 CHAPTER 1: INTRODUCTION Purpose and Scope The information presented in this report represents the study findings for the 2016 Ronan Airport Master Plan prepared for the City of Ronan and Lake County, the
Airport Master Plan. Rapid City Regional Airport. October 2015 FAA Submittal
 Airport Master Plan Rapid City Regional Airport October 2015 FAA Submittal Rapid City Regional Airport Master Plan Update Table of Contents Executive Summary... i Scope & Timeline... i Forecasts... i Preferred
AIRPORT MASTER PLAN ADVISORY COMMITTEE MEETING #2 AGENDA
 AIRPORT MASTER PLAN ADVISORY COMMITTEE MEETING #2 AGENDA MEETING DATE: Wednesday, June 1, 2011 TIME: 2:30 PM (1½ Hours) LOCATION: Duluth Airport Terminal Building, Skyline Room (2 nd Floor) This meeting
Birmingham Airport 2033
 Over the next 15 years, we will expand and improve the Airport to maximise our potential as a single runway airport by investing 500 million in new development. Our plans take account of our forecasted
msp macnoise.com MSP Noise Oversight Committee (NOC) November 17, 2010
 November 17, 2010") MSP Noise Oversight Committee (NOC) November 17, 2010 Operations Update Technical Advisor s Report Summary MSP Complaints September October 2010 3,025 3,567 2009 6,350 6,001 Total Operations September
MSP Noise Oversight Committee (NOC) November 17, 2010 Operations Update Technical Advisor s Report Summary MSP Complaints September October 2010 3,025 3,567 2009 6,350 6,001 Total Operations September
STUDY WORK GROUP MEETING No. 4. July 12, 2017
 STUDY WORK GROUP MEETING No. 4 July 12, 2017 Agenda Welcome and introductions Update of project schedule Brief overview of previous SWG meeting Introduction to airport development alternatives Comments,
Airport Preliminary Master Plan Workshop Board of County Commissioners April 18, 2017
 Airport Preliminary Master Plan Workshop Board of County Commissioners April 18, 2017 (PRELIMINARY DRAFT) WORK IN PROGRESS - FOR DISCUSSION PURPOSES ONLY Agenda (PRELIMINARY DRAFT) WORK IN PROGRESS - FOR