Passenger Retention Analysis
|
|
|
- Darren Nichols
- 6 years ago
- Views:
Transcription


1 Passenger Retention Analysis March 2013 By:
2 Table of Contents Introduction... 3 Objectives... 4 Methodology/Limitations... 4 Summary... 6 Bookings... 6 Service Level... 6 Frequency, Capacity and Marketing Airlines... 6 Destinations... 7 Passenger Activity... 7 Airfares... 8 True Market Estimate... 8 Airport Use... 8 Air Service Opportunities... 8 Airport Use and Retention... 9 Catchment Area... 9 Current Air Service... 9 Enplanements Load Factors, Seats and Passengers Load Factors by Airline in Gillette Summary of ARC Findings All Catchment Area Bookings Bookings Retained at Gillette Bookings Leaked to Rapid City Bookings Leaked to Denver True Market Estimate Conclusions Recommendations... 25
3 Introduction In aviation, two things are certain: the industry will continue to change and, for smaller communities, access to national air travel will become more and more challenging. The fact is, since deregulation began in 1978, smaller communities across the nation have seen equipment downgrades, frequency reductions, and eliminations of nonstop destinations. And that s a best-case scenario. In the face of multiple mergers, growing presence of low-cost carriers, unpredictable oil prices, terrorist actions and subsequent capacity reductions, many small communities have lost all scheduled airline service. After all, major airlines have turned their focus elsewhere within their multi-billion dollar networks. And, although some continue to serve small communities, they give very little time to thoroughly understanding the smaller, individual pieces of their route structures. Leaders in small communities then, like Gillette, have realized the critical importance of keeping a close eye on service levels, load factors, passenger retention and other industry trends to attempt to understand the issues impacting passenger service at their airports. This report will examine statistics and trends surrounding passenger service at Gillette Campbell County Airport, specifically passenger retention and leakage. With this information, Gillette s leaders may take action to maintain current access to the national air service network, enhance existing airline service levels, and help airlines maintain or improve the service Gillette currently enjoys
4 Objectives The purpose of this report is to examine data on the travel patterns of airline passengers who live in the Gillette Campbell County Airport catchment area. This report will show: 1. Airports where travelers originate or terminate travel; that is, an estimate of the percentage of Gillette travelers who use Gillette Campbell County Airport versus nearby airports. 2. Destinations/Origins of travelers in the Gillette Campbell County Airport catchment area and detail on Origin/Destination travel at airports Gillette travelers use most. 3. Passenger leakage and retention trends. 4. Estimates of the total number of travelers Gillette Campbell County Airport could potentially attract. 5. Airlines used by local travelers 6. Average fares at Gillette, nearby airports and significant city pairs. 7. Trends over the past few years in scheduled service, load factors and other variables. Methodology/Limitations This report uses data from the Airline Reporting Corporation, or ARC ( ARC data includes bookings originating in GCC s catchment area of nine zip codes, provided those bookings were made through a web booking engine (Travelocity, Expedia, etc.) or other travel agent. ARC tracks each passenger s zip code, not the zip code of a travel agent. ARC data does not include the travel habits of passengers who book directly with airlines. For example, this report does not estimate leakage for Allegiant Air passengers, since all passengers book directly through Allegiant s proprietary reservations system. This will result in an understatement of leakage to certain destinations, including Las Vegas and Phoenix. Nevertheless, the ARC data is a telling sample of the total passenger travel in and surrounding the Gillette area; most importantly, it reflects bookings made by an essential portion of airline travelers: high-yielding business travelers using web booking engines and those booking through corporate accounts
5 This report also uses various U.S. Department of Transportation (DOT) sources of airline data and schedules data from Diio s apgdat airline data software to attempt to create an accurate depiction of Gillette-area travelers trends. Prior to 2011/2012, data was collected through Marketing Information Data Tape (MIDT) from Global Distribution Systems (GDS)
, across nine zip codes in Wyoming essentially, Campbell County, WY.")
6 Summary Bookings This analysis includes 6,547 passenger enplanements for travel flown between April 1, 2011 and March 31, The Gillette catchment area has a population of 40,433 (as of 2011, source: MapPoint), across nine zip codes in Wyoming essentially, Campbell County, WY. Service Levels Between April 2011 and March 2012, Gillette had nonstop service to two major hubs: Denver and Salt Lake City. Great Lakes also operated service beyond Gillette to Rock Springs, WY and Williston, ND. Frequency, Capacity and Marketing Airlines Since 2004, GCC departing seats to hubs have increased from 25,963 to 62,229 annually, an increase of 140%. During the survey period, Great Lakes Airlines, Delta Connection (operated by SkyWest) and United Express (operated by SkyWest) served Gillette Campbell County Airport. Gillette averaged 40.9 weekly departures and 1,197 weekly departing seats. In the survey period, airlines were scheduled to operate 1,201 weekly outbound seats on 47 weekly departures from Gillette nonstop to Denver and nonstop or direct to Salt Lake City
7 United Express and Delta Connection each accounted for 35% of departing seats. Great Lakes accounted for 30% of departing seats. Four airlines currently serve Rapid City, SD with nonstop service to seven destinations. In October 2012 those carriers scheduled 6,806 weekly seats across 98 weekly departures. Fifteen airlines served Denver in October 2012 with nonstop service to 171 destinations. Airlines offered 605,904 weekly departing seats aboard 5,637 weekly flights. Of all passengers in the ARC survey, 66% flew on United/Continental, 18% flew on Delta, 8% flew on Frontier and another 8% flew on other carriers. Destinations From the GCC catchment area, Denver was the top final destination in the ARC survey with 16.6% of total survey passengers. Las Vegas, Orlando, Phoenix and Salt Lake City rounded out the top five destinations. The top 25 destinations accounted for 60.1% of all passenger enplanements. Passenger Activity Since 2004, according to DOT information, Gillette Campbell County Airport s origin and destination passengers were up 117%, from 28,526 in 2004 to 61,998 in 2011/2012. Rapid City s O&D passengers have increased approximately 9%. Denver s passengers have increased just over 28%
8 Airfares In the year ending 2011, the average one-way domestic airfare for Gillette was $187; $47 less than the average fare from Rapid City and $17 more than Denver. In Gillette s top 25 markets, the reported average fare YE4Q11 was approximately $36, or 18%, less than that of Rapid City. Airfares from Gillette to Denver and Salt Lake City were actually lower than from Rapid City by 31% and 46% respectively. From Denver, the reported 2012 average fare from Gillette s top 25 markets was approximately $56 (or 44%) more than from GCC. True Market Estimate The true market for Gillette Campbell County Airport, that is the number of enplanements generated by flyers living in the Gillette catchment area but flying from any airport, is estimated by the DOT to be 72,894 annually. Between April 2011 and March 2012, GCC carried 43,044 passengers, meaning an estimated 29,850 passengers used airports other than Gillette Campbell County Airport. Airport Use Over the survey period, 59% of catchment area passengers used Gillette Campbell County Airport, 12% used Rapid City Regional Airport and 22% used Denver International Airport. Seven percent of travelers used other airports including Billings Logan Airport, Casper s Natrona County International Airport and Sheridan County Airport. Air Service Opportunities Contingent on the sustained success of Gillette s current routes, Gillette s next opportunities for increased air service are potentially upgraded service on existing routes, or new routes, possibly to Las Vegas, Phoenix or Minneapolis/St. Paul. These routes either have a higher percentage of leakage from GCC or demonstrated ability in other markets to respond to new service and lower fares. These factors should be the subject of further investigation
, experiences particularly high leakage, which is when flyers leave the GCC catchment")
9 Airport Use and Retention Passengers choose whether or not to use a local airport for a variety of reasons, including price, schedule, flight frequency and the ease of driving to a nearby airport. GCC, being positioned relatively close to Denver International Airport and another regional option (Rapid City), experiences particularly high leakage, which is when flyers leave the GCC catchment area and use alternate airports. GCC also represents a prime example of a high origination airport (versus a destination airport), in which flyers start in GCC to travel elsewhere, then return home. ARC data studies Gillette s retention by tracking travel purchases from nine Wyoming zip codes (GCC s catchment area) and determining whether the travel originated at GCC. Airport Catchment Area This analysis includes 6,547 ARC passenger enplanements for travel between April 1, 2011 and March 31, The Gillette catchment area was estimated to cover nine Wyoming zip codes with a population of 40,433. This analysis examines passenger retention at Gillette Campbell County Airport and diversion to primarily five nearby airports: Billings, MT; Casper, WY; Sheridan, WY; Rapid City, SD and Denver, CO. Each of the five airports has levels of air service similar to or substantially exceeding Gillette s and is within driving distance. After examining travel patterns, Sheridan WY, Billings, MT, Rapid City, SD and others accounted for a small percentage of total travel each that they were combined into the category other, for purposes of comparison
10 Current Air Service Drive Time and Distance to Nearby Airports Gillette to: Miles: Drive Time: Sheridan, WY 105 1:35 Rapid City, SD 152 2:18 Casper, WY 191 2:43 Billings, MT 237 3:22 Denver, CO 356 5:46 Gillette Campbell County Airport In October 2012, two carriers served Gillette with service to two hubs. Delta Connection (operated by SkyWest Airlines) served Salt Lake City twice daily with 30-seat Embraer 120 aircraft. One flight operated nonstop to Salt Lake City, and the second operated with a stop in Rock Springs, WY. United Express (also operated by SkyWest Airlines) flew three times daily nonstop service to Denver, also on 30-seat Embraer 120 aircraft. From Gillette (GCC) Destination Marketing Airline Weekly Departures Weekly Seats Denver United Rock Springs Delta Salt Lake City Delta Total 35 1,050 Rapid City In nearby Rapid City, four airlines operated service to seven destinations. Rapid City offered three times as many flights across nearly six times the number of seats versus Gillette. As of October 2012, one low-cost carrier Allegiant Air offered service to/from Rapid City. From Rapid City (RAP) Destination Marketing Airline Weekly Departures Weekly Seats Chicago O'Hare United Dallas/Ft. Worth American Denver United 45 2,250 Las Vegas Allegiant Minneapolis/St. Paul Delta 27 2,057 Phoenix - Mesa Allegiant Salt Lake City Delta Total 101 6,
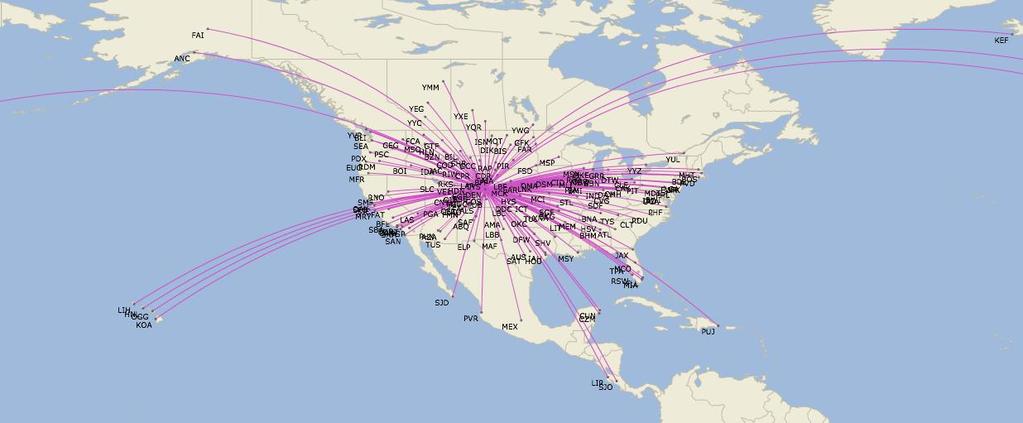
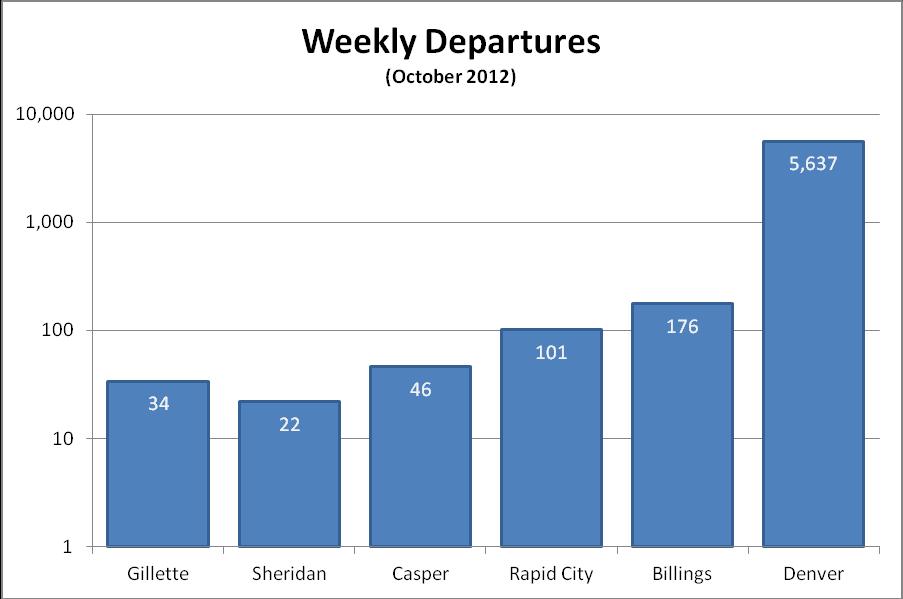
11 Sheridan, Casper and Billings Details of service to these airports are listed below: From Sheridan (SHR) Destination Marketing Airline Weekly Departures Weekly Seats Denver Great Lakes Total From Casper (CPR) Destination Marketing Airline Weekly Departures Weekly Seats Denver United 32 1,600 Las Vegas Allegiant Phoenix - Mesa Allegiant Salt Lake City Delta Total 52 3,200 *Allegiant s service are reflective of December 2012 From Billings (BIL) Destination Marketing Airline Weekly Departures Weekly Seats Portland Alaska Airlines Seattle Alaska Airlines 14 1,064 Minneapolis Delta Airlines 14 1,261 Salt Lake City Delta Airlines 28 1,416 Denver Frontier Airlines 11 1,089 Phoenix - Mesa Allegiant Air Las Vegas Allegiant Air Oakland Allegiant Air Denver United Airlines 27 2,734 Glasgow Silver Airways 5 95 Lewistown Silver Airways Miles City Silver Airways Wolf Point Silver Airways Sidney Silver Airways Total ,303 Denver Further away in Denver, fifteen airlines operated nonstop service to 171 destinations. Airlines offered 605,904 weekly departing seats over 5,637 weekly flights, obviously far more service than at smaller airports closer to Gillette s catchment area. While its service is too vast to detail here, a DEN service map is below, followed by a comparison (not to scale) of scheduled activity across all five airports:
12 - 12 -


13 Enplanements Traffic has been rising over the past 10 years at Gillette Campbell County Airport, with growth in nine of the past 10 years. Only in 2009 did traffic shrink, likely due to the economic slowdown. In 2012, traffic was basically flat, after a few years of double-digit growth
14 Load Factor, Seats and Passengers The following charts show load factor, capacity and passenger trends at Gillette Campbell County airport since January Prior to adding capacity in 2008, GCC s monthly load factors had generally averaged from the low-50% to low-60% range. With the capacity added in March 2008, load factors have since climbed to the mid-60% range, at times hitting 70%. Load Factors by Airline in Gillette Great Lakes consistently runs the highest load factors out of GCC, although United Express has gained ground and has surpassed them as recently as the spring of Of the three carriers that serve Gillette, Delta Connection consistently runs the lowest load factors, but has seen an increase in the past several months. In 2007 and prior, Great Lakes service ran load factors in the 50% range. Then, in early 2008, Delta Connection and United Express began service from Gillette. In response, Great Lakes reduced seats to Denver by approximately 35% and added one-stops via Gillette to Williston, Miles City and Sidney. From that point until now, Great Lakes has maintained load factors around 60%, thanks to reduced capacity, combined with the additional passengers from beyond cities. While United Express load factors started low, they ve risen to equal Great Lakes recently, and now hover in the mid-50%range. Delta s load factors are consistently lower than those of both United Express and Great Lakes, averaging in the high-40s
.")

15 Gillette load factors have recently trended lower than those of nearby airports (within the catchment area). Gillette s load factors are similar to Sheridan s, currently in the mid-50% range in the off-peak season, and in the 60-65% range in peak season. Denver generally has the highest load factor of the group, with Billings, Casper and Rapid City slightly below Denver. A load factor chart follows:
16 Summary of ARC Findings All Catchment Area ARC Bookings According to the ARC data, Gillette retained 59% of traffic from April 1, 2011 through March 31, 2012, a drop versus MIDT s numbers for 2010 (68%). Rapid City and other cities are flying a significant number of Gillette area residents 19% and Denver is basically unchanged in terms of percentage of Gillette passengers leaked at 22%. Retained Traffic Gillette Rapid City Denver Other % 16% 19% 11% % 10% 18% 1% % 9% 19% 1% % 12% 22% 7% Historical comparisons are made versus MIDT data, but ARC and MIDT track passengers differently (as explained in Methodology). Top City Pairs Denver was the top destination in the ARC survey, accounting for 16.6% of passenger segments booked. A list of the top 25 destinations for Gillette travelers in the ARC survey follows: Top 25 Gillette City Pairs ALL ARC bookings from GCC zip codes Rank Destination Pax % of TTL 1 DEN 1, % 2 LAS % 3 MCO % 4 PHX % 5 SLC % 6 DFW % 7 SEA % 8 LAX % 9 SAN % 10 PDX % 11 ORD % 12 IAH % 13 SNA % 14 ATL % 15 CUN %
17 Bookings Retained at Gillette 16 MSP % 17 ANC % 18 MCI % 19 MIA % 20 HNL % 21 OKC % 22 FLL % 23 STL % 24 SFO % 25 LGA % OTHERS 2, % TOTAL 6, % Gillette Campbell County Airport retained 59 percent of all ARC passengers over the survey period. But, naturally, there were differences in retention by city pair. Travelers chose GCC more often than not when traveling to classic business destinations, such as Phoenix, Dallas/Ft. Worth, St. Louis, New York (LGA), Houston, Atlanta and Chicago. Some popular leisure destinations Las Vegas and Ft. Lauderdale, for example also heavily originated in GCC. Still, passengers seemed to leak to other airports for classic leisure destinations, including Orlando, Tampa and cities throughout Mexico. Leakage to the West Coast has a less consistent pattern: San Francisco and San Diego leaked a smaller percentage of passengers than average to other airports. Seattle, Portland, Orange County and Los Angeles leaked a great deal more passengers than average. Seattle and Portland appeared to be leaking to Billings, which has nonstop service on Alaska Airlines to Seattle. Orange County and Los Angeles leaked a very high percentage of Gillette travelers to Denver, likely because of increasing competition on Denver-L.A. area routes and corresponding low fares. Travelers to Minneapolis consistently leaked to Rapid City, likely due to Delta s (formerly Northwest s) long history of service in the market. Passenger Retention by Destination Destination Gillette Rapid City Denver Other 1 DEN 93% 4% 0% 2% 2 LAS 62% 8% 19% 12% 3 MCO 31% 39% 26% 4%
18 4 PHX 64% 1% 28% 7% 5 SLC 89% 2% 4% 5% 6 DFW 56% 35% 6% 3% 7 SEA 43% 2% 12% 44% 8 LAX 52% 2% 44% 2% 9 SAN 60% 8% 29% 4% 10 PDX 49% 0% 27% 25% 11 ORD 62% 32% 5% 1% 12 IAH 59% 8% 32% 2% 13 SNA 45% 1% 52% 2% 14 ATL 50% 17% 33% 0% 15 CUN 35% 3% 62% 0% 16 MSP 46% 38% 10% 5% 17 ANC 40% 9% 16% 35% 18 MCI 49% 4% 42% 4% 19 MIA 38% 6% 56% 0% 20 HNL 29% 3% 41% 27% 21 OKC 48% 3% 41% 8% 22 FLL 56% 3% 41% 0% 23 STL 55% 3% 35% 7% 24 SFO 79% 9% 11% 2% 25 LGA 85% 4% 7% 4% OTHERS 50% 15% 27% 8% TOTAL 59% 12% 22% 7% International Traffic International city pairs accounted for 9.6% of passenger segments within the ARC survey. GCC leaked approximately 64% of its international traffic to other airports. Top 25 Destinations and Carrier Share International Leakage # Pax % Pax Gillette % Rapid City 66 10% Denver % Other 24 4% Total % The following table shows which carriers Gillette travelers use to travel to the top 25 destinations from GCC. As noted earlier, Alaska Airlines, which serves Billings, has a strong share to Seattle and Portland, likely accounting for the leakage in those markets. Likewise,
19 Delta has a strong share to Minneapolis and Washington, DC, explaining the leakage to those cities. Top 25 Destinations and Carrier Share UA+CO DL F9 AA US AS Other 1 DEN 84% 1% 5% 3% 3% 0% 3% 2 LAS 50% 27% 22% 0% 1% 0% 0% 3 MCO 61% 17% 10% 5% 6% 0% 1% 4 PHX 49% 15% 13% 0% 21% 1% 2% 5 SLC 2% 93% 4% 0% 1% 0% 1% 6 DFW 65% 2% 6% 26% 0% 0% 1% 7 SEA 15% 27% 7% 0% 2% 48% 2% 8 LAX 49% 7% 25% 7% 0% 1% 10% 9 SAN 47% 17% 35% 1% 0% 0% 0% 10 PDX 28% 23% 24% 0% 1% 24% 1% 11 ORD 77% 1% 0% 17% 5% 0% 0% 12 IAH 87% 4% 0% 5% 0% 0% 3% 13 SNA 19% 29% 47% 0% 1% 0% 4% 14 ATL 24% 55% 15% 1% 2% 0% 2% 15 CUN 46% 3% 42% 10% 0% 0% 0% 16 MSP 42% 46% 12% 0% 0% 0% 0% 17 ANC 9% 40% 13% 0% 0% 30% 8% 18 MCI 39% 7% 45% 0% 8% 0% 0% 19 MIA 51% 1% 0% 38% 6% 0% 4% 20 HNL 56% 21% 0% 0% 11% 11% 2% 21 OKC 70% 5% 19% 6% 0% 0% 0% 22 FLL 44% 3% 43% 7% 0% 0% 3% 23 STL 67% 2% 28% 2% 2% 0% 0% 24 SFO 75% 7% 9% 0% 0% 0% 9% 25 LGA 84% 0% 15% 0% 0% 0% 2% OTHER 48% 21% 10% 6% 6% 2% 8% Retained Bookings at Gillette and Carrier Share At 66%, United and Continental (now operating as United) carried the majority of GCC s passengers from April 2011 through March That share includes all passengers ticketed on United ticket stock, including those passengers traveling on Great Lakes from Gillette to Denver on connecting itineraries. Delta s share was second at 18%, followed by Frontier at 8%
, and are somewhat predictable based on leisure versus business travel.")
20 Top 25 Gillette Destinations and Carrier Share As discussed in Passenger Retention, leakage patterns can be tied to airline service to specific destinations (for example, potential GCC passengers commonly leak to DEN to fly to the L.A. area, due to high competition/low fares), and are somewhat predictable based on leisure versus business travel. Bookings Leaked to Rapid City United/Continental flew 45% of GCC-area travelers who leaked to Rapid City. Delta carried 36% of those passengers and American accounted for 13%
21 Top 25 Destinations Leaked to Rapid City and Carrier Share Gillette area passengers who leaked to Rapid City (approximately two hours east of the catchment area) were primarily traveling east. The breakdown of market share by carrier is predictable, given airlines market shares and route structures from Rapid City. Bookings Leaked to Denver Carrier Share by Destination GCC Passengers Using RAC Rank Destination UA+CO AA DL OTHER 1 MCO 53% 12% 35% 0% 2 DFW 40% 60% 0% 0% 3 DEN 77% 9% 0% 15% 4 ORD 66% 31% 0% 3% 5 MSP 0% 0% 100% 0% 6 DTW 30% 0% 70% 0% 7 LAS 62% 0% 38% 0% 8 ATL 7% 0% 93% 0% 9 BOS 38% 0% 62% 0% 10 MKE 46% 0% 54% 0% 11 YYC 77% 0% 0% 23% 12 BDL 100% 0% 0% 0% 13 SAN 70% 0% 0% 30% 14 AUS 11% 67% 0% 22% 15 DCA 22% 0% 78% 0% 16 GRR 44% 0% 56% 0% 17 RSW 0% 0% 89% 11% 18 OGG 100% 0% 0% 0% 19 ANC 71% 0% 29% 0% 20 IAH 57% 43% 0% 0% 21 ROC 43% 0% 57% 0% 22 TVC 57% 0% 43% 0% 23 AMS 0% 0% 67% 33% 24 CAE 100% 0% 0% 0% 25 CMH 17% 0% 83% 0% OTHER 38% 8% 44% 11% When passengers from Gillette drive to Denver, nearly six hours away, they are most likely flying carriers that don t serve Gillette in other words, carriers other than United and Delta. Indeed, they re likely choosing a low cost carrier, such as Frontier or Southwest. ARC data captures information from online booking engines (Travelocity, etc.); however, it does not

22 capture data from bookings on airlines web sites, meaning Southwest is not included in the data. Top 25 Destinations Leaked to DEN and Carrier Share The following chart details the top 25 destinations of Gillette catchment area passengers who used Denver International Airport. There are substantially more international, long-haul and sun (Mexico and Caribbean) destinations in the top 25 Denver cities. Similarly, there are a large number of warm weather U.S. leisure destinations in the top 25, specifically, Phoenix (#1), Orlando (#2), Los Angeles (#3) and Honolulu (#13). As previously noted, a substantial number of passengers in the Gillette catchment area are using Denver for service to the L.A. area. Los Angeles ranks third among GCC-area leaked passengers from Denver, while it s the eighth among the top 25 destinations of passengers who use GCC. Likewise, Orange County is ranked sixth from Denver; while it s 17th from Gillette. Fares are likely causing the leakage. Carrier Share by Destination GCC Passengers Using DEN Rank Destination Airport F9 UA+CO US DL AA OTHER 1 PHX 25% 25% 51% 0% 0% 0% 2 MCO 13% 64% 20% 0% 0% 3% 3 LAX 49% 26% 0% 0% 13% 12% 4 LAS 62% 34% 4% 0% 0% 0% 5 CUN 57% 27% 0% 0% 16% 0%
23 6 SNA 89% 0% 2% 0% 0% 9% 7 MIA 0% 25% 10% 0% 58% 8% 8 SAN 82% 18% 0% 0% 0% 0% 9 MCI 57% 20% 10% 13% 0% 0% 10 IAH 0% 93% 0% 0% 7% 0% 11 PDX 48% 34% 3% 0% 0% 14% 12 ATL 21% 0% 7% 61% 4% 7% 13 HNL 0% 69% 15% 15% 0% 0% 14 OKC 31% 58% 0% 0% 12% 0% 15 FLL 76% 16% 0% 0% 8% 0% 16 SJU 0% 0% 4% 48% 17% 30% 17 STL 38% 57% 0% 0% 5% 0% 18 SJD 80% 0% 20% 0% 0% 0% 19 PVR 68% 26% 0% 0% 5% 0% 20 SEA 42% 0% 16% 0% 0% 42% 21 IND 29% 24% 12% 0% 0% 35% 22 BOS 13% 40% 7% 0% 0% 40% 23 CZM 13% 27% 47% 0% 13% 0% 24 STT 0% 0% 0% 0% 100% 0% 25 HOU 100% 0% 0% 0% 0% 0% OTHER 17% 26% 15% 17% 10% 15% Total 30% 28% 12% 10% 9% 10%
24 True Market Estimate This section of this analysis will estimate total the number of passengers in the Gillette Campbell County Airport catchment area. The Gillette catchment area incorporates Campbell County, WY. The DOT does not include leaked passengers; rather, it simply counts passengers originating or terminating at any airport. The ARC data used for this analysis can document the airport used by a subset of passengers within the catchment area, in this case, passengers who booked through online booking engines (Expedia, etc.), or through Gillette-area travel agencies. This report combined ARC data with DOT data to estimate the total size of the Gillette Campbell County Airport origin and destination market. Gillette s total market size is estimated to be 72,894 annual enplanements. GCC True Market Estimate Destination ARC Pax ARC Leakage DOT PAX Leaked Pax Leaked % Total Pax 1 DEN % 6, % 6,881 2 LAS % % 1,589 3 MCO % 594 1, % 1,922 4 PHX % 1, % 1,959 5 SLC % 2, % 2,705 6 DFW % 1,410 1, % 2,510 7 SEA % 841 1, % 1,976 8 LAX % % 1,202 9 SAN % % 1, PDX % % 1, ORD % % 1, IAH % 1, % 1, SNA % % 1, ATL % % CUN % % MSP % % ANC % % MCI % % 1, MIA % % HNL % % OKC % % FLL % % STL % % 1, SFO % % LGA % % 304 OTHERS % 21,067 21, % 42,151 TOTAL % 43,044 29, % 72,
25 Conclusions This report has documented several trends of note: Leakage: Leakage from Gillette Campbell County Airport is decreasing overall. Leakage from Gillette to Rapid City is decreasing substantially. Leakage from Gillette to Denver is unchanged, with a large number of passengers who use Denver bound for: a) leisure destinations b) international destinations GCC sees high leakage to the West Coast, specifically to the L.A. Basin and the Pacific Northwest. Traffic/Load Factors: Fares: Traffic gains have exceeded population growth. GCC produces lower than ideal load factors, particularly on Delta s service to Salt Lake City. Average fares in Gillette are falling and the price gap between Gillette and nearby airports is shrinking, though it still remains an issue, particularly for leisure passengers. Recent trends (in 2010) resulted in decreased capacity and increased fares. Recommendations 1. Retention of existing service is more important than attracting additional service. 2. Since Delta Connection s load factors are weakest of the three airlines at GCC, initial focus should be on Delta Connection. 3. Gillette and Delta/SkyWest should work together to increase GCC load factors to levels similar to Gillette s peer group
TravelWise Travel wisely. Travel safely.
 TravelWise Travel wisely. Travel safely. The (CATSR), at George Mason University (GMU), conducts analysis of the performance of the air transportation system for the DOT, FAA, NASA, airlines, and aviation
Passengers Boarded At The Top 50 U. S. Airports ( Updated April 2
 (Ranked By Passenger Enplanements in 2006) Airport Table 1-41: Passengers Boarded at the Top 50 U.S. Airportsa Atlanta, GA (Hartsfield-Jackson Atlanta International) Chicago, IL (Chicago O'Hare International)
World Class Airport For A World Class City
 World Class Airport For A World Class City Air Service Update April 2018 2018 Air Service Updates February 2018 Seattle new departure, seasonal, 2x weekly Boston new departure, seasonal, 2x weekly March
2016 Air Service Updates
 Air Service Update May 2016 2016 Air Service Updates February 2016 Pittsburgh new destination, 2x weekly April 2016 Los Angeles new departure, 1x daily Atlanta new departure, 1x daily Jacksonville new
2016 Air Service Updates
 Air Service Update June 2016 2016 Air Service Updates February 2016 Pittsburgh new destination, 2x weekly April 2016 Los Angeles new departure, 1x daily Atlanta new departure, 1x daily Jacksonville new
World Class Airport For A World Class City
 World Class Airport For A World Class City Air Service Update December 2018 2018 Air Service Updates February 2018 Delta Air Lines Seattle new departure, seasonal, 2x weekly Delta Air Lines Boston new
World Class Airport For A World Class City
 World Class Airport For A World Class City Air Service Update April 2017 2017 Air Service Updates February 2017 Cleveland new destination, 2x weekly Raleigh-Durham new destination, 2x weekly March 2017
World Class Airport For A World Class City
 World Class Airport For A World Class City Air Service Update October 2017 2017 Air Service Updates February 2017 Cleveland new destination, 2x weekly Raleigh-Durham new destination, 2x weekly March 2017
2016 Air Service Updates
 Air Service Update September 2016 2016 Air Service Updates February 2016 Pittsburgh new destination, 2x weekly April 2016 Los Angeles new departure, 1x daily Atlanta new departure, 1x daily Jacksonville
2016 Air Service Updates
 2016 Air Service Updates February 2016 Pittsburgh new destination, 2x weekly April 2016 Los Angeles new departure, 1x daily Atlanta new departure, 1x daily Jacksonville new destination, 2x weekly Philadelphia
Megahubs United States Index 2018
 Published: Sep 2018 Megahubs United States Index 2018 The Most Connected Airports in the US 2018 OAG Aviation Worldwide Limited. All rights reserved About OAG Megahubs US Index 2018 Published alongside
Questions regarding the Incentive Program should be directed to Sara Meess at or by phone at
 Ogden-Hinckley New Entrant Incentive Program Request for Letters of Interest Amendment No. 1 The City of Ogden, Utah (the City ) is seeking Letters of Interest from air carriers not currently serving the
SEPTEMBER 2014 BOARD INFORMATION PACKAGE
 SEPTEMBER 2014 BOARD INFORMATION PACKAGE MEMORANDUM TO: Members of the Airport Authority FROM: Lew Bleiweis, Executive Director DATE: September 19, 2014 Informational Reports: A. July, 2014 Traffic Report
Chico Municipal Airport. Catchment Area Analysis Results
 Chico Municipal Airport Catchment Area Analysis Results Table of Contents Chico market overview 4 Comparative market analysis 9 Regional airport discussion 14 CIC catchment area results 19 2 Executive
2012 Airfares CA Out-of-State City Pairs -
 2012 Airfares Out-of-State City Pairs - Contracted rates are from July 1, 2012 through June 30, 2013. Please note all fares are designated as () and ( ) in airline computer reservation systems. fares are
RENO-TAHOE INTERNATIONAL AIRPORT APRIL 2008 PASSENGER STATISTICS
 Inter-Office Memo Reno-Tahoe Airport Authority Date: June 5, 2008 To: Statistics Recipients From: Tom Medland, Director Air Service Business Development Subject: RENO-TAHOE INTERNATIONAL AIRPORT PASSENGER
Data Session U.S.: T-100 and O&D Survey Data. Presented by: Tom Reich
 Data Session U.S.: T-100 and O&D Survey Data Presented by: Tom Reich 1 What are Doing Here? Learn how to use T100 & O&D (DB1A/DB1B) to: Enhance your air service presentations Identify opportunities for
WYSASP AIR SERVICE EVALUATION
 2016 Mead & Hunt, Inc. WYSASP AIR SERVICE EVALUATION Presented by: Joseph Pickering Mead & Hunt 2 TOPICS Air Service Market Research Overview of U.S. Airline Industry State of Wyoming Air Service ASEP
The Airport Credit Outlook
 The Airport Credit Outlook Peter Stettler Ricondo & Associates, Inc. National Federation of Municipal Analysts National Conference April 19, 2012 Las Vegas, Nevada The Outlook for Airports Recent Trends
Air Service Assessment & Benchmarking Study Marquette, MI
 Air Service Assessment & Benchmarking Study Marquette, MI September 2015 Historical Airline Industry Overview 1978-2009: Massive financial losses during a period of excess capacity Yields (Price): Fell
OAG s Top 25 US underserved routes. connecting the world of travel
 OAG s Top 25 US underserved routes connecting the world of travel Underserved Uncovered: OAG s Top 50 underserved international routes Contents About OAG s underserved uncovered 3 About the data 3 OAG
Airport Profile Pensacola International
 Airport Profile Pensacola International 2015 BY THE NUMBERS Enplanements 808,170 Airport Pensacola International Airport (PNS) is located approximately three nautical miles northeast of the central business
May 2011 Passenger and Cargo Traffic Statistics Reno-Tahoe International Airport
 May 2011 Passenger and Cargo Traffic Statistics Reno-Tahoe International Airport July 5, 2011 U.S. DOMESTIC INDUSTRY OVERVIEW FOR MAY 2011 All RNO Carriers Systemwide year over year comparison Average
Air Service and Airline Economics in 2018 Growing, Competing and Reinvesting
 Air Service and Airline Economics in 2018 Growing, Competing and Reinvesting John P. Heimlich, VP & Chief Economist Presentation to the CAAFI Biennial General Meeting December 5, 2018 The ~720,000 Employees*
2012 Air Service Data & Planning Seminar
 Advanced Schedule Data Eric Ford James Lundy Vice President Vice President Campbell-Hill Aviation Group, LLC Agenda Data Components and Sources What Can You Do with the Data line Profiling Building Schedule
Aspen / Pitkin County Airport (ASE) Update on Key Trends & Opportunities
 Update on Key Trends & Opportunities") Aspen / Pitkin County Airport (ASE) Update on Key Trends & Opportunities Bill Tomcich President, Stay Aspen Snowmass Air Service Development Consultant, Fly Aspen Snowmass Winter 16/17 Review Operational
Aspen / Pitkin County Airport (ASE) Update on Key Trends & Opportunities Bill Tomcich President, Stay Aspen Snowmass Air Service Development Consultant, Fly Aspen Snowmass Winter 16/17 Review Operational
Kansas City Aviation Department. Update to Airport Committee January 26, 2017
 Kansas City Aviation Department Update to Airport Committee January 26, 2017 1 Status of Customer Service Improvements Additional electric outlets in public areas Review Wi-Fi speed / coverage / study
Trends Shaping Houston Airports
 Trends Shaping Houston Airports Ian Wadsworth Chief Commercial Officer April 2014 Our mission is to connect Houston with the world Connect the people, businesses, cultures and economies of the world to
PFC Collection Analysis
 PFC Collection Analysis 8:40 9:30am June 11, 2018 2018 BUSINESS OF AIRPORTS Airport/Airline Business Working Group Analysis of declining trend in PFC-paying passengers Background U.S. Airport Infrastructure
A Decade of Consolidation in Retrospect
 A Decade of Consolidation in Retrospect MARCH 7, 2017 CONSOLIDATION TIMELINE Airlines Announced Closed SOC US Airways- America West Delta- Northwest Frontier- Midwest United- Continental Southwest- AirTran
Inter-Office Memo Reno-Tahoe Airport Authority
 Inter-Office Memo Reno-Tahoe Airport Authority Date: November 30, 2009 To: Statistics Recipients From: Krys T. Bart, A.A.E., President/CEO Subject: RENO-TAHOE INTERNATIONAL AIRPORT PASSENGER STATISTICS
Impact of Advance Purchase and Length-of-Stay on Average Ticket Prices in Top Business Destinations
 Impact of Advance Purchase and Length-of-Stay on Average Ticket Prices in Top Business Destinations Research Summary Average ticket prices continue to trend downward in 2016, but since 2014 there have
Puget Sound Trends. Executive Board January 24, 2019
 Puget Sound Trends Executive Board January 24, 2019 Overview Topics covered in today s presentation: How many jobs are there? Housing Trends Where do people work? How long does it take to get to work?
PITTSBURGH INTERNATIONAL AIRPORT ANALYSIS OF SCHEDULED AIRLINE TRAFFIC. October 2016
 ANALYSIS OF SCHEDULED AIRLINE TRAFFIC October 2016 Passenger volume Pittsburgh International Airport enplaned passengers totaled 379,979 for the month of October 2016, a 7.0% increase from the previous
Aviation Gridlock: Airport Capacity Infrastructure How Do We Expand Airfields?
 Aviation Gridlock: Airport Capacity Infrastructure How Do We Expand Airfields? By John Boatright Vice President - Delta Air Lines Properties and Facilities Issue What can be done to expand airfield capacity?
AGENCY: U.S. Customs and Border Protection; Department of Homeland Security.
 This document is scheduled to be published in the Federal Register on 06/25/2013 and available online at http://federalregister.gov/a/2013-15087, and on FDsys.gov 9111-14 DEPARTMENT OF HOMELAND SECURITY
Passenger and Cargo Statistics Report
 Passenger and Cargo Statistics Report Reno-Tahoe International Airport October 2018 U.S. DOMESTIC INDUSTRY OVERVIEW FOR OCTOBER 2018 Systemwide RNO Carriers Domestic Flights year over year comparison Average
MIT ICAT. Price Competition in the Top US Domestic Markets: Revenues and Yield Premium. Nikolas Pyrgiotis Dr P. Belobaba
 Price Competition in the Top US Domestic Markets: Revenues and Yield Premium Nikolas Pyrgiotis Dr P. Belobaba Objectives Perform an analysis of US Domestic markets from years 2000 to 2006 in order to:
December 2011 Passenger and Cargo Traffic Statistics Reno-Tahoe International Airport
 December 2011 Passenger and Cargo Traffic Statistics Reno-Tahoe International Airport January 27, 2012 U.S. DOMESTIC INDUSTRY OVERVIEW FOR DECEMBER 2011 All RNO Carriers Systemwide year over year comparison
Emerging US Airport Traffic Trends & Preview To The 2018
 1 Research Summary Emerging US Airport Traffic Trends & Preview To The 2018 August 2018 Prepared & Researched By 78 Beaver Brook Canyon Road, Evergreen, Colorado USA 80439 (303) 674-2000 www.aviationplanning.com
DEPARTMENT OF HOMELAND SECURITY U.S. CUSTOMS AND BORDER PROTECTION. CBP Dec. No EXPANSION OF GLOBAL ENTRY TO NINE ADDITIONAL AIRPORTS
 This document is scheduled to be published in the Federal Register on 10/04/2016 and available online at https://federalregister.gov/d/2016-23966, and on FDsys.gov 9111-14 DEPARTMENT OF HOMELAND SECURITY
Airport Profile Orlando-Sanford International Airport
 Airport Profile Orlando-Sanford International Airport 2015 BY THE NUMBERS 1,227,803 Enplanements 1,093,195 Passengers Orlando-Sanford International Airport (SFB) is an airport located in Sanford, Florida
North America s Fastest Growing Airports 2018
 connecting the world of travel North America s Fastest Growing Airports 2018 2018 OAG Aviation Worldwide Limited. 1 THE HUBS Over 20m departing seats Data for the 12-months from May 2017 to April 2018
79006 AIR TRAVEL SERVICES 2001 AWARD
 Group 79006 AIR TRAVEL SERVICES 2001 AWARD Page 6 Office of General Services - Procurement Services Group Delta Air Lines Albany, NY - Albuquerque, NM ALB - ABQ 901.00 313.00 293.00 420 Delta Air Lines
Air France is proud to be the first European airline to fly the A380
 InFocus n e w l e t t e r Continental will join Star Alliance This fall, Continental will join Star Alliance and also begin to cooperate closely with United Airlines, linking our networks and services
Smaller Hubs, Large Hubs and the Interdependencies. Prepared by: David Dague InterVISTAS Senior Vice President
 Smaller Hubs, Large Hubs and the Interdependencies Prepared by: David Dague InterVISTAS Senior Vice President JANUARY 26, 2017 Why should we care about large hub airports 90 million reasons why large hub
Ticketing and Booking Data
 Ticketing and Booking Data Jim Ogden January 9, 2018 Agenda The booking and ticketing process What s available in the booking and ticketing data How to use booking and ticketing data? Summary The booking
Air Service at GMIA. ASQ Milwaukee. January 21, 2013
 Air Service at GMIA ASQ Milwaukee January 21, 2013 Airlines that have served MKE GMIA Airlines 2002 to 2013 GMIA Total Passengers - Enplaned & Deplaned 10,000,000 9,000,000 8,000,000 7,000,000
May Commission Presentation Director s Report
 May Commission Presentation Director s Report Rebecca Hupp A.A.E. Boise Airport Director MAY 3, 2018 April Runway Closures April 5: 10R/28L, 10:00 a.m. 11:00 a.m. Lighting maintenance April 11: 10L/28R,
Fundamentals of Airline Markets and Demand Dr. Peter Belobaba
 Fundamentals of Airline Markets and Demand Dr. Peter Belobaba Istanbul Technical University Air Transportation Management M.Sc. Program Network, Fleet and Schedule Strategic Planning Module 10: 30 March
Uncertainty in Airport Planning Prof. Richard de Neufville
 Uncertainty in Airport Planning Prof. Richard de Neufville Istanbul Technical University Air Transportation Management M.Sc. Program Airport Planning and Airport Planning and Management Module 06 January
November 2013 Passenger and Cargo Traffic Statistics Reno-Tahoe International Airport
 November 2013 Passenger and Cargo Traffic Statistics Reno-Tahoe International Airport December 26, 2013 U.S. DOMESTIC INDUSTRY OVERVIEW FOR NOVEMBER 2013 All RNO Carriers Domestic Systemwide year over
Description of the National Airspace System
 Description of the National Airspace System Dr. Antonio Trani and Julio Roa Department of Civil and Environmental Engineering Virginia Tech What is the National Airspace System (NAS)? A very complex system
J.D. Power and Associates Reports: Customer Satisfaction with Airports Declines Sharply Amid an Industry Fraught with Flight Delays
 J.D. Power and Associates Reports: Customer Satisfaction with Airports Declines Sharply Amid an Industry Fraught with Flight Delays Philadelphia International, Chicago Midway International and Dallas Love
3 Aviation Demand Forecast
 3 Aviation Demand 17 s of aviation demand were prepared in support of the Master Plan for Harrisburg International Airport (the Airport or HIA), including forecasts of enplaned passengers, air cargo, based
Passenger and Cargo Statistics Report
 Passenger and Cargo Statistics Report RenoTahoe International Airport November 2017 U.S. DOMESTIC INDUSTRY OVERVIEW FOR NOVEMBER 2017 Systemwide RNO Carriers Domestic Flights year over year comparison
Presentation Outline. We will leave with:
 Presentation Outline We will leave with: Knowledge of work done to-date Awareness of the methodology and preliminary findings of the aviation demand forecasting Understanding of public outreach efforts
Outlook for Air Travel
 University of Massachusetts Amherst ScholarWorks@UMass Amherst Tourism Travel and Research Association: Advancing Tourism Research Globally 2014 Marketing Outlook Forum - Outlook for 2015 Outlook for Air
What Does the Future Hold for Regional Aviation?
 What Does the Future Hold for Regional Aviation? FAA Aviation Forecast Conference March 10, 2010 HCH T C George W. Hamlin Hamlin Transportation Consulting Fairfax, Virginia www.georgehamlin.com Taxonomy
Salt Lake City Int'l Airport Airport Schedule Reports
 Salt Lake City Int'l Airport Airport Schedule Reports Airport: Salt Lake City Int'l Airport (SLC) Week of: 02/13/2017-02/19/2017 Source: OAG Database As of January 11, 2017 (Updated Weekly) Table of Contents
September 2013 Passenger and Cargo Traffic Statistics Reno-Tahoe International Airport
 September 2013 Passenger and Cargo Traffic Statistics Reno-Tahoe International Airport October 31, 2013 U.S. DOMESTIC INDUSTRY OVERVIEW FOR SEPTEMBER 2013 All RNO Carriers Systemwide year over year comparison
The Big 4 Airline Era, New Ultra Low Cost Carriers, and Implications for Airports
 The Big 4 Airline Era, New Ultra Low Cost Carriers, and Implications for Airports Linda Perry, Director AAAE Rates and Charges Workshop November 4, 2016 Outline The Big 4 American Delta Southwest United
December 2012 Passenger and Cargo Traffic Statistics Reno-Tahoe International Airport
 December 2012 Passenger and Cargo Traffic Statistics Reno-Tahoe International Airport January 29, 2013 U.S. DOMESTIC INDUSTRY OVERVIEW FOR DECEMBER 2012 All RNO Carriers Systemwide year over year comparison
Wyoming Air Service Market Research. Prepared by Mead & Hunt, Inc. For more information, please contact:
 Wyoming Air Service Market Research Prepared by Mead & Hunt, Inc. For more information, please contact: airservice@meadhunt.com 678.364.9738 TABLE OF CONTENTS Disclaimer: The User agrees to limitations
December Commission Presentation Director s Report
 December Commission Presentation Director s Report Rebecca Hupp Boise Airport Director DECEMBER 7, 2017 Airport Operations Update Annual SMGCS inspection 300 1200 RVR approved 2018 FAA inspection scheduled
Associates 2009 Rental Car Satisfaction Study SM (Page 1 of 2)
") Reports: Although Technology May Help Improve the Airport Experience, the Basics Have the Greatest Impact on Passenger Satisfaction Detroit Metropolitan Wayne County, Indianapolis International and Kansas
Reports: Although Technology May Help Improve the Airport Experience, the Basics Have the Greatest Impact on Passenger Satisfaction Detroit Metropolitan Wayne County, Indianapolis International and Kansas
Delta and Minnesota. January 29, 2015
 Delta and Minnesota January 29, 2015 Delta & Minnesota: By The Numbers 456 Delta peak-day departures from Minneapolis/St. Paul 2 MSP is Delta s 2 nd largest hub (Seat departures July 2014) 145 Total nonstop
Bridget Rief, Vice President Planning and Development Metropolitan Airports Commission
 Bridget Rief, Vice President Planning and Development Metropolitan Airports Commission Topics Operations and Air Service Trends Economic Impact Striving for Excellence Planning for the Future Prep for
Passenger and Cargo Statistics Report
 Passenger and Cargo Statistics Report RenoTahoe International Airport June 2017 U.S. DOMESTIC INDUSTRY OVERVIEW FOR JUNE 2017 All RNO Carriers Domestic Systemwide year over year comparison Average Load
Frequent Fliers Rank New York - Los Angeles as the Top Market for Reward Travel in the United States
 Issued: April 4, 2007 Contact: Jay Sorensen, 414-961-1939 IdeaWorksCompany.com Frequent Fliers Rank New York - Los Angeles as the Top Market for Reward Travel in the United States IdeaWorks releases report
March Commission Presentation Director s Report
 March Commission Presentation Director s Report Rebecca Hupp A.A.E. Boise Airport Director MARCH 1, 2018 Airport Operations Update FAA certification inspection revealed zero discrepancies We commend you
Naples Municipal Airport Master Plan. Joint NAA / NCC Workshop April 30, 2018
 Naples Municipal Airport Master Plan Joint NAA / NCC Workshop April 30, 2018 Airport Master Planning Process Project Initiation Stakeholder and Public Outreach Airport Mapping and AGIS Existing Conditions
Airport Profile. St. Pete Clearwater International BY THE NUMBERS 818, ,754 $ Enplanements. Passengers. Average Fare. U.S.
 Airport Profile St. Pete Clearwater International St. Pete-Clearwater International Airport (PIE) is located in Pinellas County, Florida about nine miles north of downwn St. Petersburg, seven miles southeast
PROPOSAL UNDER THE SMALL COMMUNITY AIR SERVICE DEVELOPMENT PROGRAM
 PROPOSAL UNDER THE SMALL COMMUNITY AIR SERVICE DEVELOPMENT PROGRAM DOCKET #: OST-2007-27370 APPLICANT: SOUTHEAST IOWA REGIONAL AIRPORT LEGAL SPONSOR: SOUTHEAST IOWA REGIONAL AIRPORT AUTHORITY DUNS #: 948908306
Vanderbilt Travel January 2019 Airfare Price Testing Testing Session, January 14, 9:30am 10:30am
 Feb 28 Feb 13, 4:50pm Feb 7, 12:05pm Feb 26, 1:18pm Date / Time 2:35pm/5:35pm/10:55pm Feb 8, 10:40pm / 1:20pm City Pair New York (LGA) Denver (DEN) Washington (DCA) Abuja (ABV) Abu Dhabi (AUH) Southwest
Federal Perspectives on Public-Private Partnerships (P3) in the United States
 in the United States") Federal Perspectives on Public-Private Partnerships (P3) in the United States Prepared for: ACI-World Bank Symposium London, United Kingdom Presented by: Elliott Black Director Office of Airport Planning
Federal Perspectives on Public-Private Partnerships (P3) in the United States Prepared for: ACI-World Bank Symposium London, United Kingdom Presented by: Elliott Black Director Office of Airport Planning
Update to Airline Competition Plan Philadelphia International Airport
 Final Report Update to Airline Competition Plan Philadelphia International Airport Prepared for Federal Aviation Administration in compliance with requirements of AIR21 Prepared by City of Philadelphia
The Airline Quality Rating 2002
 The Airline Quality Rating 2002 Brent D. Bowen University of Nebraska at Omaha Aviation Institute Dean E. Headley Wichita State University W. Frank Barton School of Business April, 2002 What the Airline
Passenger and Cargo Statistics Report
 Passenger and Cargo Statistics Report RenoTahoe International Airport September 2018 U.S. DOMESTIC INDUSTRY OVERVIEW FOR SEPTEMBER 2018 Systemwide RNO Carriers Domestic Flights year over year comparison
March 2014 Passenger and Cargo Traffic Statistics Reno-Tahoe International Airport
 March 2014 Passenger and Cargo Traffic Statistics Reno-Tahoe International Airport April 25, 2014 U.S. DOMESTIC INDUSTRY OVERVIEW FOR MARCH 2014 All RNO Carriers Domestic Systemwide year over year comparison
Table of Contents PAGE
 DECEMBER 2018 EL PASO INTERNATIONAL AIRPORT MONTHLY ACTIVITY REPORT December 2018 Table of Contents PAGE AIRPORT ACTIVITY OVERVIEW 1 NONSTOP DESTINATION ANALYSIS 2 MAP OF NONSTOP DESTINATIONS 3 FLIGHT
CONCESSIONS FUTURE OPPORTUNITIES
 CONCESSIONS FUTURE OPPORTUNITIES MARCH 14 & 15, 2019 COLORADO S STRONG ECONOMY 2 ABOVE AVERAGE GROWTH 3 19 FORTUNE 1000 COMPANIES Fortune 1000 Companies & Major Relocations and Expansions into Metropolitan
The Airline Quality Rating 2002
 University of Nebraska Omaha DigitalCommons@UNO Faculty Books and Monographs 4-2002 The Airline Quality Rating 2002 Brent D. Bowen University of Nebraska at Omaha Dean Headley Wichita State University
Table of Contents PAGE
 OCTOBER 2018 EL PASO INTERNATIONAL AIRPORT MONTHLY ACTIVITY REPORT October 2018 Table of Contents PAGE AIRPORT ACTIVITY OVERVIEW 1 NONSTOP DESTINATION ANALYSIS 2 MAP OF NONSTOP DESTINATIONS 3 FLIGHT SCHEDULE
Table of Contents PAGE
 NOVEMBER 2018 EL PASO INTERNATIONAL AIRPORT MONTHLY ACTIVITY REPORT November 2018 Table of Contents PAGE AIRPORT ACTIVITY OVERVIEW 1 NONSTOP DESTINATION ANALYSIS 2 MAP OF NONSTOP DESTINATIONS 3 FLIGHT
2nd Annual MIT Airline Industry Conference No Ordinary Time: The Airline Industry in 2003
 2nd Annual MIT Airline Industry Conference No Ordinary Time: The Airline Industry in 2003 Growth of Low Fare Carriers William Swelbar Managing Director April 8, 2003 William Swelbar Managing Director Low
Passenger and Cargo Statistics Report
 Passenger and Cargo Statistics Report RenoTahoe International Airport September 2017 U.S. DOMESTIC INDUSTRY OVERVIEW FOR SEPTEMBER 2017 Systemwide RNO Carriers Domestic Flights year over year comparison
Passenger and Cargo Statistics Report
 Passenger and Cargo Statistics Report RenoTahoe International Airport July 2017 U.S. DOMESTIC INDUSTRY OVERVIEW FOR JULY 2017 Systemwide RNO Carriers Domestic Flights year over year comparison Average
air traffic statistics
 October 213 air traffic statistics Prepared by the Office of Finance Department of Internal Controls, Compliance and Financial Strategy Metropolitan Washington Airports Authority Air Traffic Statistics
Sioux Falls Regional Airport Sioux Falls, SD
 Sioux Falls Regional Airport Sioux Falls, SD Volume 16-4 T1 Data Through April 216 July 216 Sioux Falls Onboard Ticker YE Apr 16 YoY Apr-16 YoY Passengers 989,223 -.4% 79,34 1.8% Airport Traffic Monthly
AUGUST 2018 MONTHLY STATISTICAL REPORT
 AUGUST 2018 MONTHLY STATISTICAL REPORT Monthly Statistical Report To: Russell J. Handy, Aviation Director From: Brian Pratte, Air Service Administrator Copies: San Antonio Regional Stakeholders Subject:
The O Hare Effect on the System
 The O Hare Effect on the System Diane Boone and Joseph Hollenberg The MITRE Corporation s Center for Advanced Aviation System Development with the Federal Aviation Administration s Managers of Tactical
June Commission Presentation Director s Report
 June Commission Presentation Director s Report Rebecca Hupp Boise Airport Director JUNE 1, 2017 Airport Operations Update May 9 Airport Operations attended and presented at the 2017 National Weather Service
U.S. DOMESTIC INDUSTRY OVERVIEW FOR MARCH
 Inter-Office Memo Reno-Tahoe Airport Authority Date: April 30, 2009 To: Statistics Recipients From: Krys T. Bart, A.A.E., President/CEO Subject: RENO-TAHOE INTERNATIONAL AIRPORT PASSENGER STATISTICS U.S.
December 2013 Passenger and Cargo Traffic Statistics Reno-Tahoe International Airport
 December 2013 Passenger and Cargo Traffic Statistics Reno-Tahoe International Airport January 24, 2014 U.S. DOMESTIC INDUSTRY OVERVIEW FOR DECEMBER 2013 All RNO Carriers Domestic Systemwide year over year
Airline Mergers and Consumers. Before the US DOT Advisory Committee for Aviation Consumer Protection
 Airline and Consumers Before the US DOT Advisory Committee for Aviation Consumer Protection Daniel M. Kasper October 29th, 2014 Presentation Overview 1. Key drivers of airline consolidation a) Relentless
Investigating the Effect of Flight Delays and Cancellations on Travel from Small Communities
 University of Massachusetts Amherst ScholarWorks@UMass Amherst Tourism Travel and Research Association: Advancing Tourism Research Globally 2015 ttra International Conference Investigating the Effect of
Passenger and Cargo Statistics Report
 Passenger and Cargo Statistics Report RenoTahoe International Airport July 2018 U.S. DOMESTIC INDUSTRY OVERVIEW FOR JULY 2018 Systemwide RNO Carriers Domestic Flights year over year comparison Average
Passenger and Cargo Statistics Report
 Passenger and Cargo Statistics Report RenoTahoe International Airport June 2018 U.S. DOMESTIC INDUSTRY OVERVIEW FOR JUNE 2018 Systemwide RNO Carriers Domestic Flights year over year comparison Average
Alliances: Past, Present, And Future JumpStart Roundtable. Montreal June 2, 2009 Frederick Thome Director Alliances
 Alliances: Past, Present, And Future ACI-NA's JumpStart Roundtable Montreal June 2, 2009 Frederick Thome Director Alliances Agenda The Peculiar Nature Of Airlines The Alliance Solution The Future Of The