FREEDOM TICKET. Southeast Queens Proof of Concept. December 2015
|
|
|
- Meagan Carter
- 6 years ago
- Views:
Transcription
1 F M FREEDOM TICKET Southeast Queens Proof of Concept December 2015
2
3 NEW YORK CITY TRANSIT RIDERS COUNCIL 2 Broadway, 16th Floor, New York, NY (212) mail@pcac.org AUTHORS BRADLEY BRASHEARS ELLYN SHANNON ANGELA BELLISIO ANDREW ALBERT CHAIR MICHAEL SINANSKY VICE CHAIR COUNCIL MEMBERS STUART GOLDSTEIN CHRISTOPHER GREIF WILLIAM K. GUILD MARISOL HALPERN SHARON KING HOGE TRUDY L. MASON SCOTT R. NICOLLS EDITH M. PRENTISS BURTON M. STRAUSS, JR
4
5 Executive Summary In its latest research report, The Freedom Ticket: A Southeast Queens Proof of Concept, the New York City Transit Riders Council (NYCTRC)seeks to find a solution to the lack of affordable and efficient transit access in outer boroughs as well as help the commuter railroads maximize their productivity. Currently the MTA offers a City Ticket, which allows Long Island Rail Road (LIRR) and Metro-North Railroad (MNR) riders to travel in the city zone for a lower fare on the weekends. Freedom Ticket would expand that premise and allow customers to use any MTA mode that meets their needs, be it bus, subway, or commuter rail, within a given zone, for a reduced rate. It would reduce city commuter rail fares at all times and provide a transfer between modes. The NYCTRC identified Southeast Queens as an ideal location for the Proof of Concept because of the community s commuting difficulties and economic profile. There are many neighborhoods in SE Queens that can access Manhattan easily via LIRR, but the cost of the commuter ticket makes this option unaffordable to the working and service-providing residents. Because affordable transportation is a tennet of the di Blasio administration s agenda, the NYCTRC would like to see the City of New York and the MTA work together to fund and implement a Freedom Ticket Proof of Concept for these SE Queens neighborhoods. The Council examined the number of empty seats on LIRR trains traveling through SE Queens neighborhoods during the AM and PM peaks in order to determine available capacity. The study identified thousands of empty seats during these time periods, which could provide affordable transit options for SE Queens residents as well as produce additional revenue for LIRR. The NYCTRC has long been concerned with transit access in the neighborhoods of SE Queens as well as in other outer borough neighborhoods. This concern has been echoed recently by several other groups in New York, including the Regional Plan Association, Move New York, and the NYC Comptroller s Office. The NYCTRC therefore envisions this Proof of Concept as a starting point to improve outer borough mobility, and foresees the expansion of the program to the Bronx and Brooklyn once the East Side Access (ESA) project comes on line, increasing the capacity opportunities for both Metro-North Railroad and Long Island Rail Road. City Ticket to Freedom Ticket Timeline 2003 The Permanent Citizens Advisory Committee to the MTA (PCAC), the parent organization of the NYCTRC, proposes City Ticket concept to the MTA, calling for reduced weekend fares on the commuter railroads within city limits MTA implements the City Ticket pilot program that operates today PCAC produces a report called A Long Day s Journey into Work, in which PCAC recommends Freedom Ticket to improve mobility for transit underserved neighborhoods such as SE Queens NYCTRC proposes Freedom Ticket Proof of Concept i
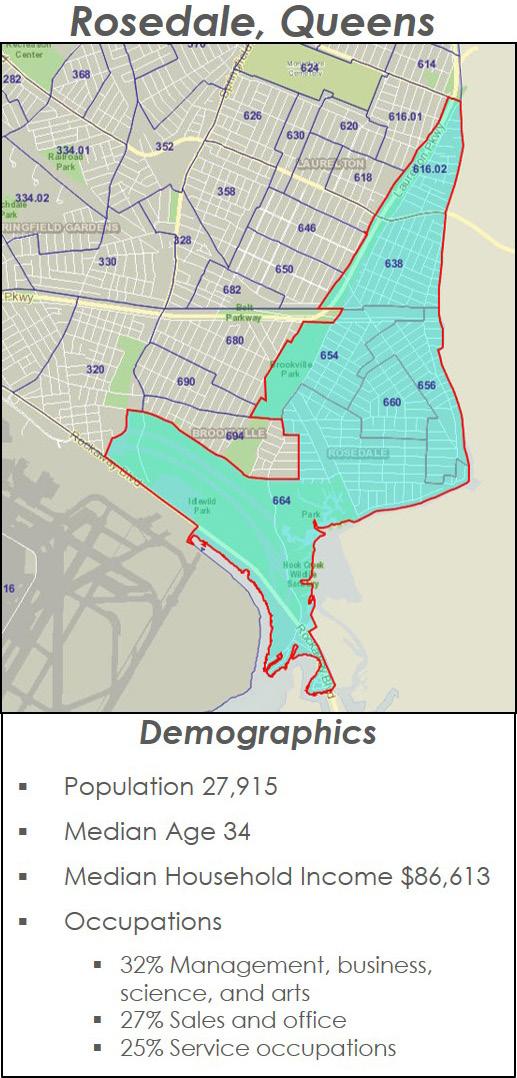
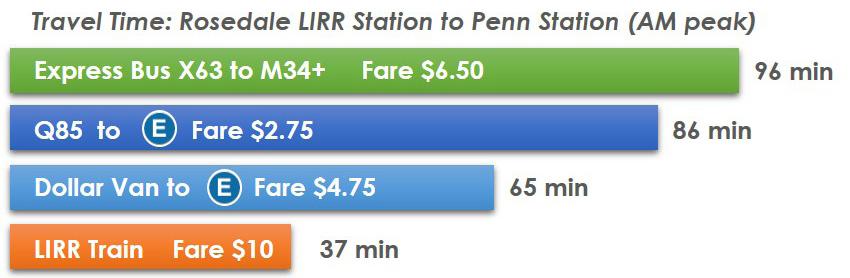
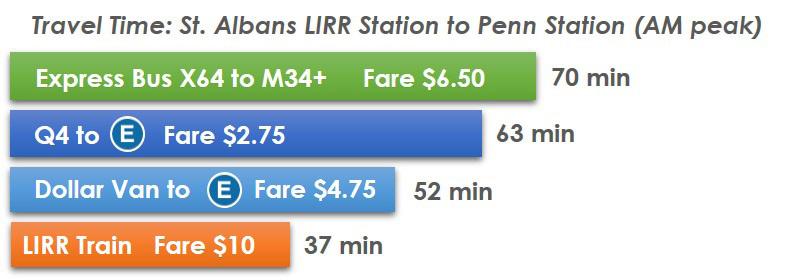
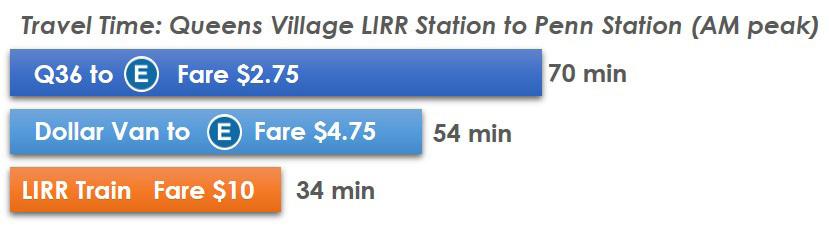
6 Southeast Queens SE Queens commuters endure some of the longest and most difficult commutes in New York City. Thirty-nine percent of SE Queens commuters travel 60 minutes or more to work each day. The most affordable commuting option requires commuters to travel via city buses or commuter (dollar) vans to Jamaica subway lines. The bus to the subway option is $2.75, the dollar van to the subway option is $4.75. Comparatively, the cost of a peak hour LIRR ticket is $10. The LIRR fares, prohibitively expensive for most, create a financial barrier causing commuters to primarily use subways and buses, which take much longer. As an example, from the Rosedale neighborhood of SE Queens to Penn Station, a trip on NYCT can take 86 minutes, whereas a trip on LIRR can be less than 40. Another slightly more affordable option than LIRR is an express bus into Manhattan for $6.50; however, travel times can be up to an hour and a half each way. LIRR Capacity Findings Freedom Ticket Proof of Concept implementation requires that there be capacity on LIRR during peak hours to accommodate additional riders. Therefore, LIRR peak hour 2014 ridership data was analyzed between SE Queens stations and Jamaica, Penn Station and Jamaica, and Atlantic Terminal and Jamaica. Trains between SE Queens and Jamaica AM Peak: 34% of seats are empty (21,984 out of 65,084 seats) PM Peak: 39% of seats are empty (23,136 out of 59,996 seats) Trains between Jamaica and Penn Station AM Peak: 23% of seats are empty (19,892 out of 87,224 seats) PM Peak: 26% of seats are empty (20,014 out of 76,564 seats) Trains between Jamaica and Atlantic Terminal AM Peak: 49% of seats are empty (9,372 out of 19,292 seats) PM Peak: 60% of seats are empty (11,104 out of 18,444 seats) ii
7 The Benefits of Freedom Ticket By expanding and improving City Ticket through this Proof of Concept, benefits can be realized immediately by riders, the City, and the MTA. Riders: Reduces travel times for thousands of SE Queens riders by up to 45% City: Provides fast, affordable access to outer borough neighborhoods MTA: Converts thousands of non-income producing seats into revenue-producing seats Recommendations By funding Freedom Ticket in their localities, local governments have the opportunity to provide reduced fares and travel times for their commuters traveling from MTA railroad stations. 1. Establish a financial partnership between the MTA and the City of New York for the Implementation of the Freedom Ticket Proof of Concept in SE Queens by 2017 Offer reduced monthly fare of no more than $215, and adjust the weekly and per ride fares accordingly from Long Island Rail Road SE Queens stations Provide free transfers from LIRR to NYC Transit subways and buses Establish metrics to measure the success of the Proof of Concept 2. Implement Freedom Ticket Phase 2 by 2019 to all MTA railroad stations that are.8 miles or more from a subway 3. Integrate Freedom Ticket into the East Side Access operational plan for an MTA-wide fare system iii
8
9 Table of Contents Executive Summary i Introduction 1 Findings 5 Fare Options 9 Conclusion 10 Recommendations 13 Appendix A: Peak Hour Empty Seats 17 Appendix B: LIRR Empty Seats by Branch 21 Appendix C: Understanding Train Capacity 25 Appendix D: Methodology 29 Appendix E: Existing Discounted Ticket Options 30 Appendix F: Southeast Queens Neighborhood Profiles 31 References 40
10
11 Introduction Public transit is a key component of the economic and social fabric of metropolitan areas The effectiveness of transit depends upon its reach, frequency, and where it goes. 1 Many New York City commutes are difficult. While the City s core is serviced by numerous subway lines and buses, outer boroughs are less accessible. Multiple studies have shown that residents in the outer boroughs have some of the longest commutes in the nation. Most recently a brief produced by New York City Comptroller Scott M. Stringer found that of the 30 largest metropolitan areas in the United States, New York City is the only city where average weekly commutes exceed five hours; New Yorkers have an average weekly commute of 6 hours and 18 minutes. Combined with the average workday this means that New York City full-time workers spend over 49 hours per week either working or commuting, giving them the longest combined workweeks in the nation. 2 The difficulties faced by the average commuter are amplified in the outer reaches of the boroughs, especially during peak hours. More hours spent commuting means these residents have even fewer hours to spend at home than residents in other parts of the city, and far fewer than in any other city. 3 Riders from Southeast Queens endure some of the longest commutes in New York City. In light of today s constrained budget and limited resources, to best serve areas like SE Queens, the MTA needs to get as much service as possible from existing assets and provide choices that enable commuters to match service to travel needs. Looking to optimize the use of existing resources to combat harrowing commutes, the New York City Transit Riders Council (NYCTRC) proposes that the MTA undertake a Proof of Concept, a new fare category, called Freedom Ticket. Freedom Ticket would allow customers to travel within New York City on commuter rail at a lower cost than current intra-city fares. Freedom Ticket expands the concept of the MTA s City Ticket, which was introduced by the Permanent Citizens Advisory Committee to the MTA (PCAC) in 2003 and offers a lower cost weekend fare for Long Island Rail Road (LIRR) and Metro-North Railroad (MNR) riders within the city boundaries. Subsequently, the MTA launched the City Ticket pilot program in 2004 and it continues to operate and perform successfully today. Freedom Ticket In 2007, the PCAC, the umbrella organization for the Long Island Rail Road Commuter Council (LIRRCC), Metro-North Railroad Commuter Council (MNRCC), and NYCTRC, wrote a report entitled, A Long Day s Journey into Work, where the PCAC first called for the MTA and the City of New York to work together to improve fare affordability by creating the Freedom Ticket. Freedom Ticket as the name implies, gives customers the freedom to use any MTA mode that meets their needs, be it bus, subway, or commuter rail, within a given zone for one universal price. 1 Martha Ross and Nicole Prchal Svajlenka, Connecting to Opportunity: Access to Jobs via Transit in the Washington D.C. Region, Brookings Institute, (November 2012), 2, Date accessed: January 27, 2015, papers/2012/11/~/media/d eec94c09b895ab17d126dc1f.ashx. 2 Scott M. Stringer, NYC Economic Brief, Office of the New York City Comptroller, (March 2015), 2, Date accessed: March 19, 2015, 3 Scott M. Stringer, NYC Economic Brief, Office of the New York City Comptroller, (March 2015), 6, Date accessed: March 19, 2015, 1
12 Freedom Ticket expands the concept of the MTA s City Ticket to include the following: Figure 1: City Ticket vs. Freedom Ticket Hours Accepted Transfers Multi-directional Travel City Ticket Weekends only No free transfers Not allowed Freedom Ticket All times Free transfers Allowed The NYCTRC is proposing a Proof of Concept of Freedom Ticket by implementing it in the neighborhoods of SE Queens. SE Queens is an ideal starting place for the Freedom Ticket because it is served by both LIRR and NYC Transit buses but the high cost of LIRR, three and a half times that of NYC Transit, forces many to choose the more affordable yet time consuming transit option. Freedom Ticket would offer SE Queens commuters a faster and more affordable ride on LIRR, reducing commuting hours and improving their quality of life. Freedom Ticket can counter many current issues facing the MTA. Subway ridership has reached record proportions, and large projects that will ease congestion like East Side Access (ESA), Second Avenue Subway (SAS), and Comunication Based Train Control (CBTC) are not yet complete. Freedom Ticket will provide more affordable fares, relieve crowded subway lines, require minimal capital expenditures, and fill empty seats. Additionally, it is feasible to implement the Proof of Concept by the fourth quarter of 2016, well before ESA is finished. Fortunately, the MTA has multiple transit and commuter rail resources to address areas lacking convenient service. The Freedom Ticket Proof of Concept will demonstrate the MTA s ability to partner financially with the City of New York to make commuter rail travel more affordable within City limits. 2

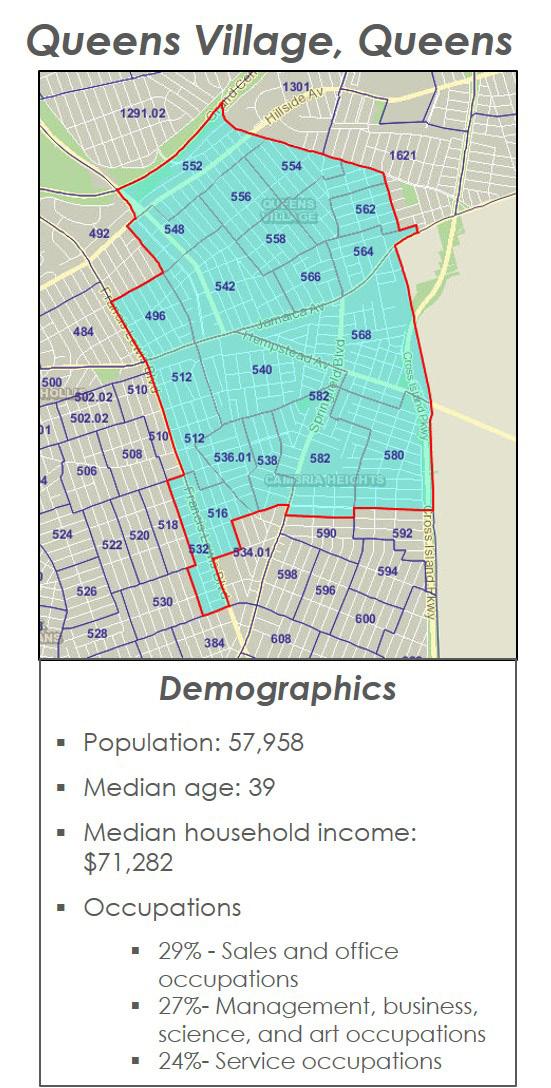
13 Southeast Queens Background The communities of SE Queens, sandwiched between Jamaica, JFK International Airport and Nassau County, Long Island, are representative of the transportation issues that face the outer-boroughs. They are characterized by a suburban landscape and density - modest single family homes with postage stamp lawns, small gardens and attached garages. Unlike the outer-reaches of the Bronx and Brooklyn, which have readily available subway access, the outer-reaches of SE Queens lack these connections. In SE Queens the median household income is $72,592, and nearly a third of the work force is employed in service occupations. 4 These kinds of jobs frequently require off-peak travel when less transit is available. The New York City Comptroller s recent economic brief summarizes the dilemma saying that New Yorkers in service occupations such as waiters, security guards, housekeepers, and care providers typically have the longest commutes. 5 SE Queens has six LIRR stations (Hollis, Queens Village, St. Albans, Locust Manor, Laurelton, and Rosedale), yet many commuters travel up to five miles to Jamaica (E,J,Z) subway lines. The cost of a peak hour LIRR monthly ticket is $218, compared to $ for subway or local bus, making it prohibitively expensive for most. 6 Most travelers take a bus to Jamaica (36 minutes from Laurelton for example) to ride the overburdened E subway line. A second option more affordable than LIRR is the $6.50 express bus to Manhattan. 4 American Fact Finder: American Community Survey 5 Year Estimates, Commuting Characteristics by sex, United States Census Bureau, Date accessed: November 18, 2014, 5 Scott M. Stringer, NYC Economic Brief, Office of the New York City Comptroller, (March 2015), 4, Date accessed: March19, 2015, 6 SE Queens LIRR stations are within city limits, however pay Zone 3 fare of $10 rather than the City Zone fare of $
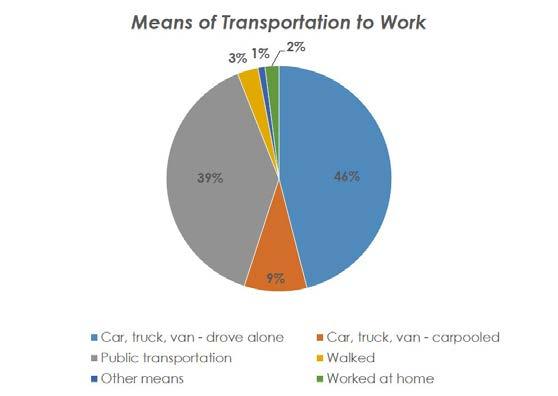
14 Commuters living in SE Queens have very different travel patterns than commuters in the rest of the city. Fifty-three percent of SE Queens commuters drive to work, compared with 27 percent of commuters in New York City overall, as can be seen in Figure 2. Only 40 percent use public transit compared with 56 percent in the city. As a result, the mean commute time in SE Queens is almost 50 minutes, ten minutes longer than the mean commute time of New York City. Over 38 percent of SE Queens commuters travel 60 minutes or more to work each day. The high rate of car use and the lower rate of public transit use, in spite of having six LIRR stations, indicates people in this community are choosing longer commutes over higher transit costs. 7 Figure 2: New York City vs. Southeast Queens Commuter Comparisons Mean Commute Time Percentage Drive Percentage Public Transit New York City 39 min. 27% 56% Southeast Queens 49 min. 53% 40% An additional alternative for connecting to Jamaica is privately owned commuter vans, frequently called dollar vans. 8,9 Depending on local traffic conditions, these commuter vans typically take minutes to travel between Jamaica and SE Queens LIRR stations. 10 Advantages of commuter vans are they can use many different routes to reduce travel time, unlike fixed route buses, and their two-dollar fare is less than a transit ride. On the down side, regulation of the commuter van industry is difficult and hundreds of vans operate illegally without permits or insurance, subjecting riders to severe risks in the event of an accident. 11 Also, there is no transfer to the MTA subways or buses so commuters still need to pay the $2.75 transit fare to complete their trips. Figure 3: Travel Mode Comparisons from Rosedale, Queens Required departure times from Rosedale, Queens to arrive at Grand Central Terminal by 9:00 AM 7:12 7:24 7:45 8:06 8: Local bus + subway $ Express Bus $229 Commuter van + subway $ LIRR + subway $ LIRR + subway Freedom Ticket $215 7 American Fact Finder: American Community Survey 5 Year Estimates, Commuting Characteristics by sex, United States Census Bureau, Date accessed: November 18, 2014, 8 Between July 2013 and June 2014, NYPD seized over 637 unauthorized dollar vans (Elizabeth Hagen and Rebecca Harshbarger, New city program aims to expose illegal van operators, NY Post, August 7, 2014, Date accessed: March 30, 2015, 9 On August 7, 2014 the NYC Taxi & Limousine Commission (TLC) began a pilot program, licensing qualified commuter vans (NYC Taxi and Limousine Commission, Date accessed: March 30, 2015, vans.shtml). 10 Google Maps, Date accessed: March 27, 2015, 11 Santos, Fernanda, Licensed and Illegal Van Fight It Out, NY Times, (June 2010), Date accessed: May 26, 2015, 4
15 Findings NYCTRC studied LIRR ridership data to better understand commuting conditions from SE Queens. We analyzed primary direction peak hour ridership between SE Queens LIRR stations and Jamaica, Penn Station and Jamaica, and Atlantic Terminal and Jamaica. All ridership data for the following sections were obtained from the MTA Long Island Rail Road 2014 Ridership Book. For additional and supporting data see Appendices A, B, and C. We looked at the branches that serve and pass through SE Queens. The Montauk, Ronkonkoma, Port Jefferson, Oyster Bay, and Huntington branches were excluded between SE Queens and Jamaica because these branches travel the farthest on Long Island. Riders who take these branches already endure longer travel times, and we did not want to prolong their travel times by increasing the number of stops at city stations. Also, the Port Washington branch does not make connections at Jamaica and does not serve riders from SE Queens, therefore in this report Port Washington branch data are not included. Peak Hours Peak hours are defined as the periods of time that trains arrive at Penn Station and Atlantic Terminal in the morning: between 6-10 AM, and leave from Penn Station and Atlantic Terminal in the evening: between 4-8 PM. 5
 Finding 2: 65% of trains can accommodate additional")
16 Trains between Southeast Queens and Jamaica Babylon, Long Beach, Far Rockaway, Hempstead, and West Hempstead trains serve and run through SE Queens and can accommodate additional riders. AM Peak: SE Queens to Jamaica Figure 4: AM Peak, SE Queens to Jamaica Area Map Finding 1: 34% of seats are empty (21,984 out of 65,084 seats) Finding 2: 65% of trains can accommodate additional riders (44 out of 67 trains) Finding 3: 24 trains that have capacity run past SE Queens stations without stopping PM Peak: Jamaica to SE Queens Finding 4: 39% of seats are empty (23,136 out of 59,996 seats) Figure 5: PM Peak, Jamaica to SE Queens Area Map Finding 5: 78% of trains can accommodate additional riders (49 out of 63 trains) Finding 6: 27 trains that have capacity run past SE Queens stations without stopping 6

17 In the AM peak, SE Queens riders may transfer at Jamaica to other LIRR branches serving Penn Station or Atlantic Terminal. In the PM peak, SE Queens riders may board any LIRR train to Jamaica and transfer to a branch that serves SE Queens. Trains between Jamaica and Penn Station Data for trains traveling between Jamaica and Penn Station were analyzed to determine the number of empty seats during peak hours. The peak of the rush hour was also examined to better understand Penn Station train capacity issues. AM Peak: Jamaica to Penn Station Figure 6: AM Peak, Jamaica to Penn Station Area Map Finding 7: 23% of seats are empty (19,892 out of 87,224 seats) Finding 8: In the peak of the rush hour (8-9 AM) only 19% of trains can accommodate additional riders, despite more trains operating during this time PM Peak: Penn Station to Jamaica Figure 7: PM Peak, Penn Station to Jamaica Area Map Finding 9: 26% of seats are empty (20,014 out of 76,564 seats) Finding 10: In the peak of the rush hour (6-7 PM) only 24% of trains can accommodate additional riders 7

18 Trains between Jamaica and Atlantic Terminal Trains have considerable capacity in both AM and PM peaks between Atlantic Terminal and Jamaica. Implementing Freedom Ticket would increase access and travel options for riders in Brooklyn and SE Queens and increase ridership in this corridor. The Regional Plan Association (RPA), recently released a report entitled Overlooked Boroughs, advocating for better use of LIRR branches to Atlantic Terminal when ESA is finished by stating, It could be operated as a subway, with more frequent service and a transit fare level, making the line much more useful for residents of Jamaica and central Brooklyn. 12 AM Peak: Jamaica to Atlantic Terminal Figure 8: AM Peak, Jamaica to Atlantic Terminal Area Map Finding 11: 49% of seats are empty (9,372 out of 19,292 seats) Finding 12: 10 of the 26 trains are operating 50% or more empty Figure 9: PM Peak, Atlantic Terminal to Jamaica Area Map PM Peak: Atlantic Terminal to Jamaica Finding 13: 60% of seats are empty (11,104 out of 18,444 seats) Finding 14: 21 of the 26 trains are operating 50% or more empty 12 Regional Plan Association (RPA), Overlooked Boroughs: Where New York City s Transit Falls Short and How to Fix It, (February 2015),47, Date accessed: May 27, 2015, 8
19 Fare Options Because the MTA system does not offer free transfers between its commuter rail lines (LIRR or MNR) and its buses and subways (NYC Transit), many commuters must buy two separate sets of tickets. If a commuter is traveling from SE Queens to lower Manhattan, for example, and they want to use a monthly pass to minimize costs, they would have to purchase both a LIRR monthly pass for $ and a monthly Metrocard for $116.50, bringing their monthly commuting costs to $ With Freedom Ticket, though, a free transfer between these modes is offered, significantly reducing monthly costs. As can be seen in Figure 10, a commuter would save 36% in their commuting expenses if they used Freedom Ticket instead of both a monthly commuter rail pass and a monthly Metrocard. 13 Figure 10: Fare Comparisons One-Way Weekly Express Bus with transfer Local Bus + Subway Dollar Van + Subway LIRR + NYCT Freedom Ticket with transfer Amount saved using F.T. vs. LIRR + NYCT $6.50 $2.75 $4.75 $12.75 $ % $57.25 $31.00 $51.00 $ $ % Monthly $ $ $ $ $ % 13 Metropolitan Transportation Authority (MTA), New fares in effect as of March 22, 2015, Date accessed: March 16, 2015, 9
20 Conclusion New York City, a critical economic center of the country, is growing quickly and now must contend with how to move its increasing population around. Average weekly commutes are now over an hour longer than any other major US city. Innovative solutions are crucial during this time of recordbreaking ridership and capacity constraints. Freedom Ticket is one of those solutions. It requires minimal expenditures, substantially reduces travel times and creates a more equitable railroad fare for riders from many NYC neighborhoods that are isolated from the subway system. It also allows the MTA to maximize the use of all its assets by making the railroads a more affordable option within New York City. SE Queens has a ridership that would greatly benefit from increased transit options and is therefore the ideal place to start. The model for Freedom Ticket already exists in City Ticket. By enhancing the concept of City Ticket through this Proof of Concept, benefits can be realized immediately for both riders and the MTA, and important lessons can be learned for its expansion to other neighborhoods. The Benefits of the Proof of Concept Provides needed affordable transit where subway access is non-existant Reduces travel times for thousands of SE Queens riders by up to 45% Improves the quality of life for SE Queens riders, by freeing up an hour or more of noncommuting time each day Expands network capacity as subways become increasingly crowded Increases system revenue by filling empty seats Requires minimal MTA capital expenditures Takes cars off the roads 10
21 Beyond the Proof of Concept In addition to SE Queens, Freedom Ticket can address substantive travel issues in the boroughs that the LIRR and MNR travel through. Following the Proof of Concept, a Phase 2 should expand the Freedom Ticket program to the NYC commuter rail stations that are isolated from the NYC Transit subway system, and where travel times can be well over an hour. Like SE Queens, there are parts of the Bronx where riders have extremely long commutes due to distant subway service, but are served by commuter rail. Like the residents of SE Queens, commuters in these parts of the Bronx must choose between an expensive yet shorter ride on commuter rail and a more affordable, longer trip on NYC Transit and would benefit greatly from the implementation of Freedom Ticket. Morris Heights and Riverdale, for example, are isolated from the subway system. In order to get to Grand Central Terminal in mid-town, these riders must choose between a 30 minute ride costing a hefty $8.75 on Metro-North Railroad and the substantially longer 90 minute ride on NYC Transit costing only $2.75. Likewise, as can be seen in the chart below, riders from Co-op City have an 85 minute ride via Express bus to mid-town Manhattan. Right now the best commuting option for Co-op City residents is the 85 minute Express bus traveling to mid-town Manhattan. Offering Freedom Ticket from the MTA s planned Co-op City Metro-North station supports the goals of this 15,000 unit, Mitchell Lama development. Figure 11: Bronx Underserved Neighborhoods Travel Times & Fare Comparisons Morris Heights MNR Bus + Subway $8.75 $2.75 Grand Central Terminal Riverdale MNR Bus + Subway $8.75 $2.75 Grand Central Terminal Co-op City MNR Express Bus $8.75 $6.50 Grand Central Terminal Travel Time Minutes 11


22 In Brooklyn, Freedom Ticket presents another opportunity to support neighborhood growth and development in East New York, a community previously identified by the City of New York as an area with economic development potential because of its rich transit access. The Urban Land Institute also recommended subsidizing LIRR fares from East New York to Atlantic Terminal in its 2014 Technical Assistance Panel (TAP) for the East New York Broadway Junction area. 14 It takes only ten minutes on LIRR to travel from the East New York station to Atlantic Terminal, however a peak hour ticket is $8.25. On the other hand, it takes 26 minutes via subway from Broadway Junction to Atlantic Termianl, but the ticket is only $ In its most recent study of the East New York station, the LIRR found that merely ten riders get on in the AM peak-westbound and eight riders get off in the PM peakeastbound, an indication that riders are choosing the more affordable subway option even though it takes more than twice as long. 16 Freedom Ticket would help the LIRR better utilize its East New York station. Source: Staff Photos 14 Urban Land Institute (ULI), Technical Assistance Panels (TAPS): Broadway Junction, (June 25-26, 2014), 20, Date accessed: March 5, 2015, 15 Metropolitan Transportation Authority (MTA), TripPlanner, Date accessed: March 17, 2015, 16 MTA, Long Island Rail Road Origin & Destination Study Station-Based Passenger Counts, (Spring 2006),
23 Recommendations By funding Freedom Ticket in their localities, local governments have the opportunity to provide reduced fares and travel times for their commuters traveling from MTA railroad stations. 1. Establish a financial partnership between the MTA and the City of New York for the Implementation of the Freedom Ticket Proof of Concept in SE Queens by 2017 Offer reduced monthly fare of no more than $215, and adjust the weekly and per ride fares accordingly from Long Island Rail Road SE Queens stations Provide free transfers from LIRR to NYC Transit subways and buses Establish metrics to measure the success of the Proof of Concept 2. Implement Freedom Ticket Phase 2 by 2019 to all MTA railroad stations that are.8 miles or more from a subway 3. Integrate Freedom Ticket into the East Side Access operational plan for an MTA-wide fare system 13
24
25 Appendices Additional and Supporting Data
26
 PM Peak: Jamaica to SE Queens Empty Seats The most available seats are between 5-6 PM (8,542 empty seats) The fewest available seats are between 7-8 PM")
27 Appendix A: Peak Hour Empty Seats Trains between SE Queens and Jamaica AM Peak: SE Queens to Jamaica Empty Seats The most available seats are between 9-10 AM (7,020 empty seats) The fewest available seats are between 6-7 AM (3,140 empty seats) PM Peak: Jamaica to SE Queens Empty Seats The most available seats are between 5-6 PM (8,542 empty seats) The fewest available seats are between 7-8 PM (4,024 empty seats) 17
 PM Peak: Penn Station to Jamaica Empty Seats The most available seats are between 5-6 PM (8,108 empty seats) The fewest available seats are between 7-8 PM (2,504 empty seats)")
28 Trains between Jamaica and Penn Station AM Peak: Jamaica to Penn Station Empty Seats The most available seats are between 8-9 AM (6,888 empty seats) The fewest available seats are between 9-10 AM (3,752 empty seats) PM Peak: Penn Station to Jamaica Empty Seats The most available seats are between 5-6 PM (8,108 empty seats) The fewest available seats are between 7-8 PM (2,504 empty seats) 18
 PM Peak: Atlantic Terminal to Jamaica Empty Seats The most available seats are between 5-6 PM (3,530 empty seats) The fewest available seats are between 7-8 PM (2,278 empty")
29 Trains between Jamaica and Atlantic Terminal AM Peak: Jamaica to Atlantic Terminal Empty Seats The most available seats are between 9-10 AM (3,428 empty seats) The fewest available seats are between 6-7 AM (1,160 empty seats) PM Peak: Atlantic Terminal to Jamaica Empty Seats The most available seats are between 5-6 PM (3,530 empty seats) The fewest available seats are between 7-8 PM (2,278 empty seats) 19
30


31 Appendix B: LIRR Empty Seats by Branch Trains between SE Queens and Jamaica AM Peak: SE Queens to Jamaica Empty Seats The Babylon branch has 9,416 empty seats On the other branches empty seats range from 1,396 to 4,300 PM Peak: Jamaica to SE Queens Empty Seats The Babylon branch has 9,482 empty seats On the other branches empty seats range from 2,588 to 4,442 21

32 Trains between Jamaica and Penn Station AM Peak: Jamaica to Penn Station Empty Seats The Babylon branch has 7,566 empty seats On the other branches empty seats range from 38 to 3,734 PM Peak: Penn Station to Jamaica Empty Seats The Babylon branch has 7,370 empty seats On the other branches empty seats range from 120 to 2,942 22


33 Trains between Jamaica and Atlantic Terminal AM Peak: Jamaica to Atlantic Terminal Empty Seats The Hempstead branch has 2,310 empty seats On the other branches empty seats range from 734 to 1,890 PM Peak: Atlantic Terminal to Jamaica Empty Seats The Far Rockaway branch has 2,660 empty seats On the other branches empty seats range from 438 to 2,230 23
34
35 Appendix C: Understanding Train Capacity Currently, 51 trains that have capacity run past SE Queens without stopping during the AM and PM peaks In the AM and PM peaks many trains between Penn Station and Jamaica are at capacity compared to low capacity conditions for trains between Atlantic Terminal and Jamaica AM peak: 51 Penn Station trains are at capacity PM Peak: 37 Penn Station trains are at capacity Currently for Penn Station trains, Freedom Ticket can be readily implemented in the shoulder of the peaks. Also, in the shoulder of the peak it could be possible to add more trains. Trains between SE Queens and Jamaica AM Peak: SE Queens to Jamaica Number of Trains with Capacity 44 out of 67 trains (65%) can accommodate additional riders 25
36 PM Peak: Jamiaca Center to SE Queens Number of Trains with Capacity 49 out of 63 trains (78%) can accommodate additional riders 26


37 Trains between Jamaica Center and Penn Station AM Peak: Jamaica Center to Penn Station Number of Trains with Capacity Between 8-9 AM only 19% of trains can accommodate additional passengers, despite more trains operating during this time PM Peak: Penn Station to Jamaica Center Number of Trains with Capacity Between 6-7 PM only 24% of trains can accommodate additional passengers 27

38 Trains between Jamaica Center and Atlantic Terminal AM Peak: Jamaica Center to Atlantic Terminal Number of Trains with Capacity 10 of the 26 trains are operating 50% or more empty PM Peak: Atlantic Terminal to Jamaica Center Number of Trains with Capacity 21 of the 26 trains are operating 50% or more empty 28
39 Appendix D: Methodology Implementation of Freedom Ticket is only practical where there is excess capacity on the commuter railroads. To determine current capacity conditions for LIRR, PCAC used the MTA s Long Island Rail Road 2014 Ridership Book. In addition, the MTA s TripPlanner, Google Maps, and the U.S. Census Bureau s Year Estimates were used to develop neighborhood profiles. Collected data was divided geographically in order to understand the current ridership trends for specific corridors and locations: 1. Total AM and PM peak empty seats between SE Queens stations and Jamaica 2. Total AM and PM peak empty seats between Penn Station and Jamaica 3. Total AM and PM peak empty seats between Atlantic Terminal and Jamaica SE Queens demographic research included: Population Median age Median household income Occupations Percentage of commuting mode choices Travel times to work via different transit modes Supporting financial research included: Fares on: NYC Transit (subways and buses) Express bus LIRR / MNR Mail & Ride: Riders can purchase an unlimited MetroCard and receive two percent off their commuter rail fare Uniticket: Combination LIRR ticket and bus fares for certain LIRR stations and city bus routes City Ticket: Reduced weekend commuter rail fare within New York City boundaries The report includes data for both AM and PM peak periods. Of particular interest is the PM peak when both Freedom Ticket and Long Island commuters will be originating at Penn Station or Atlantic Terminal. Because these two sets of commuters will now be competing for seats, it is important that capacity exists during the PM peak to accommodate all commuters. It is important that LIRR commuters, who are paying more and traveling farther than Freedom Ticket riders, are not required to give up their seats. 29
40 Appendix E: Existing Discounted Ticket Options Mail & Ride In order to save money, riders can purchase an unlimited MetroCard and receive 2% off their LIRR fare by using Mail & Ride on the MTA s website. For SE Queens riders, this savings amounts to $ Uniticket Unitickets can only be purchased with LIRR and MNR monthly or weekly tickets. This ticket option reduces the weekly bus fare from $31.00 to $11.00 and the monthly from $ to $ SE Queens commuters can only use Uniticket at the Rosedale station when connecting to the Q5 or Q85 bus 18, 19 routes. City Ticket Currently, City Ticket is available for weekends on LIRR and MNR within city boundaries. Riders can purchase City Ticket for $4.25 when traveling from one city commuter station to another on the same line. Tickets can be purchased per ride at ticket windows and machines, for one-directional travel within New York City, and with no transfers to other LIRR and MNR branches, city subways or buses. 20 Other advocates have expressed the need to expand City Ticket to weekday and peak travel times. Sam Schwartz Engineering s MoveNY Plan advocates for filling transit gaps and suggests, extending City Ticket to 7 days per week and dropping the price to $6: Metro North and the Long Island Rail Road would thus become an affordable 24/7 express service for riders picking up commuter rail at intracity stations. 21 RPA also advocates for the expansion of City Ticket into weekday travel explaining that All trips in the city on the two rail systems for trips at all times wholly within New York City would be set at the City Ticket half price level. 22 Fare Options Abroad In 2014, London introduced flexible fares benefiting the part-time work force and counteracting fare increases. Riders traveling between zones one and five save 4.90 ($7.29) per day due to a reduced daily cap of ($16.22). This savings benefits the part-time work force who do not purchase weekly passes. 23 Riders use the Oyster card or a contactless payment card to pay for transit fares, permitting transfers between transit modes. Unlike on the MTA system, passengers have the ability to transfer from their subway system (The Underground) to the suburban commuter railroad (The Overground), with one fare based on a zone structure. 17 MTA, Mail & Ride on the Web, Date accessed: November 6, 2014, 18 MTA, Fares & Ticket Information, Date accessed: February 2, 2015, 19 MTA, Fare and Toll Change Materials, (January 22, 2015), MTA, City Ticket, Date accessed: November 6, 2014, 21 Sam Schwartz Engineering, MoveNY, Date accessed: February 2, 2015, 22 Regional Plan Association (RPA), Overlooked Boroughs: Where New York City s Transit Falls Short and How to Fix It, (February 2015),49, Date accessed: May 27, 2015, 23 Matthew Beard, London Evening Standard, London Underground fares shake-up: part-time workers to save hundreds of pounds under new Tube and bus fares system, (November 2014), Date accessed: 03/27/2015, 30

41 Appendix F: Southeast Queens Neighborhood Profiles The following neighborhood profiles were complied using New York City Census FactFinder, American FactFinder, MTA TripPlanner, MTA fare information, and Google Maps. Southeast Queens Bronx Manhattan Queens Brooklyn SE Queens 31
42 32
43 33
44 34
45 35
46 36
47 37
48 38
49 39
50 References American Fact Finder: American Community Survey 5 Year Estimates. Commuting Characteristics by sex. United States Census Bureau. Date accessed: December 29, factfinder.census.gov. Beard, Matthew. London Underground fares shake-up: part-time workers to save hundreds of pounds under new Tube and bus fares system. London Evening Standard. (November 2014). Date accessed: March 27, Google Maps, Date accessed: March 27, 2015, Hagen, Elizabeth and Rebecca Harshbarger. New city program aims to expose illegal van operators. NY Post. (August 7, 2014). Date accessed: March 30, Metropolitan Transportation Authority. City Ticket. Date accessed: November 6, mta.info/mta/cityticket.htm. MTA. Fares & Ticket Information. Date accessed: February 2, TicketInfo/#Multiple. MTA. Fare and Toll Increase Book. (January 22, 2015). MTA. Long Island Rail Road Origin & Destination Study Station-Based Passenger Counts. (Spring 2006). MTA. Long Island Rail Road 2014 Ridership Book. (February 9, 2015). Date accessed: February 9, MTA. Mail & Ride on the Web. Date accessed: November 6, mrcust/faces/home.jspx. MTA. New fares in effect as of March 22, Date accessed: March 16, mta/news/hearings/2015faretolls/. MTA. TripPlanner. New York City Census FactFinder. Date accessed: March 27, NYC Taxi and Limousine Commission. Date accessed: March 30, html/industry/vans.shtml). Permanent Citizens Advisory Committee to the MTA. A Long Day s Journey into Work: An Analysis of Public Transportation Options into Manhattan from Selected Neighborhoods. (October 2007). Regional Plan Association. Overlooked Boroughs: Where New York City s Transit Falls Short and How to Fix It. (February 2015). Date accessed: March 6, 2015, Boroughs-Technical-Report.pdf. 40
51 Ross, Martha, and Nicole Prchal Svajlenka. Connecting to Opportunity: Access to Jobs via Transit in the Washington D.C. Region. Brookings Institute. (November 2012). Date accessed: January 27, D EEC94C09B895AB17D126DC1F.ashx. Sam Schwartz Engineering. MoveNY. Date accessed: February 2, pages/filling-transit-gaps. Santos, Fernanda. Licensed and Illegal Vans Fight It Out. NY Times. (June 2010). Date accessed: May 26, Stringer, Scott M.. NYC Economic Brief. Office of the New York City Comptroller. (March 2015). Date accessed: March 19, Longest_Work_Weeks_March_2015.pdf. Urban Land Institute. Technical Assistance Panels: Broadway Junction. (June ). Date accessed: March 5, Broadway-Junction-TAP_FINAL.pdf. 41
52
53
54 Freedom Ticket would allow customers to use any MTA mode that meets their needs, be it bus, subway, or commuter rail, within a given zone for a reduced rate. NEW YORK CITY TRANSIT RIDERS COUNCIL
Member Attendance Andrew Albert (Chair) Burton M. Strauss Jr. (Vice Chair) Christopher Greif. Marisol Halpern. Scott R. Nicolls
 Burton M. Strauss Jr. (Vice Chair) Christopher Greif. Marisol Halpern. Scott R. Nicolls") A meeting of the New York City Transit Riders Council (NYCTRC) was convened at 12:00 noon on June 28, 2018 in the MTA, Second Floor Conference Room D 2.10, 2 Broadway, New York, New York 10004. Member
A meeting of the New York City Transit Riders Council (NYCTRC) was convened at 12:00 noon on June 28, 2018 in the MTA, Second Floor Conference Room D 2.10, 2 Broadway, New York, New York 10004. Member
APPENDIX B COMMUTER BUS FAREBOX POLICY PEER REVIEW
 APPENDIX B COMMUTER BUS FAREBOX POLICY PEER REVIEW APPENDIX B COMMUTER BUS FAREBOX POLICY PEER REVIEW The following pages are excerpts from a DRAFT-version Fare Analysis report conducted by Nelson\Nygaard
SAMTRANS TITLE VI STANDARDS AND POLICIES
 SAMTRANS TITLE VI STANDARDS AND POLICIES Adopted March 13, 2013 Federal Title VI requirements of the Civil Rights Act of 1964 were recently updated by the Federal Transit Administration (FTA) and now require
2010 MTA Financial Plan & Proposed LIRR Service Reductions Supplemental Information. MTA Long Island Rail Road
 2010 MTA Financial Plan & Proposed LIRR Service s Supplemental Information 2010 MTA Financial Plan Declining Tax Revenues Since July, there has been a $750 million shortfall in tax revenues. $669 million
For far too long, the transit needs of Brooklynites have gone unanswered. 152 of 170 BK subway stations are NOT wheelchair accessible
 For far too long, the transit needs of Brooklynites have gone unanswered. I am 77 years old and need more accessible subways, particularly at the cultural center of Brooklyn, the Brooklyn Museum, which
Transit Fare Review Phase 2 Discussion Guide
 Transit Fare Review Phase 2 Discussion Guide January 2017 translink.ca Table of Contents How should we determine transit fares in Metro Vancouver? 1 Varying fares by distance travelled 2 Varying fares
Mount Pleasant (42, 43) and Connecticut Avenue (L1, L2) Lines Service Evaluation Study Open House Welcome! wmata.com/bus
 and Connecticut Avenue (L1, L2) Lines Service Evaluation Study Open House Welcome! wmata.com/bus") Mount Pleasant (42, 43) and Connecticut Avenue (L1, L2) Lines Service Evaluation Study Open House Welcome! Study Overview and Timeline Phase 1: Collect and Analyze Data Project Kickoff, September 2017
Mount Pleasant (42, 43) and Connecticut Avenue (L1, L2) Lines Service Evaluation Study Open House Welcome! Study Overview and Timeline Phase 1: Collect and Analyze Data Project Kickoff, September 2017
Like many transit service providers, the Port Authority of Allegheny County (Port Authority) uses a set of service level guidelines to determine
 uses a set of service level guidelines to determine") Transit service consists of two fundamental elements: frequency (how often service operates) and service span (how long service runs during the day). Combined, these two factors measure how much service
Transit service consists of two fundamental elements: frequency (how often service operates) and service span (how long service runs during the day). Combined, these two factors measure how much service
Establishes a fare structure for Tacoma Link light rail, to be implemented in September 2014.
 RESOLUTION NO. R2013-24 Establish a Fare Structure and Fare Level for Tacoma Link MEETING: DATE: TYPE OF ACTION: STAFF CONTACT: PHONE: Board 09/26/2013 Final Action Ric Ilgenfritz, Executive Director,
Why we re here: For educational purposes only
 Transportation 2050 Why we re here: For educational purposes only Transportation 2050 Bus Elements PUBLIC TRANSIT DEPARTMENT City of Phoenix Citizens Committee on the Future of Phoenix Transportation (CCFPT)
DEMOGRAPHICS AND EXISTING SERVICE
 EXECUTIVE SUMMARY The Central Corridor light-rail transit (LRT) project will open in 2014 and operate between downtown Minneapolis and downtown St. Paul, serving the University of Minnesota and University
MUSKEGON AREA TRANSIT SYSTEM PROPOSAL FOR FARE AND SERVICE ADJUSTMENTS TO BE PHASED IN BEGINNING JANUARY 1, 2018
 MUSKEGON AREA TRANSIT SYSTEM PROPOSAL FOR FARE AND SERVICE ADJUSTMENTS TO BE PHASED IN BEGINNING JANUARY 1, 2018 The Muskegon Area Transit System is proposing a series of System Adjustments to be implemented
FALLS FLAT: COMPARING THE TTC`S FARE POLICY TO OTHER LEADING TRANSIT AGENCIES
 FALLS FLAT: COMPARING THE TTC`S FARE POLICY TO OTHER LEADING TRANSIT AGENCIES Brady Yauch Executive Director and Economist of Consumer Policy Institute (416) 964-9223 ext 236 bradyyauch@consumerpolicyinstitute.org
Ridership Projection: Direct Ferry to Midtown W 39th St.
 file Modes 500 Pier Sites Excursions Parking Sustainability Ridership Projections Feasibility Conclusion Ridership Projection: Direct Ferry to Midtown th St. 7,000 Total Catchment Area Direct Ferry to
Word Count: 3,565 Number of Tables: 4 Number of Figures: 6 Number of Photographs: 0. Word Limit: 7,500 Tables/Figures Word Count = 2,250
 Katherine F. Turnbull, Ken Buckeye, Nick Thompson 1 Corresponding Author Katherine F. Turnbull Executive Associate Director Texas Transportation Institute Texas A&M University System 3135 TAMU College
Watts St westbound thru
 Executive Summary At the request of the Hudson Square Business Improvement District, Sam Schwartz Engineering, DPC (Sam Schwartz) has completed a technical analysis of various congestion pricing and/or
SRTA Year End Fixed Route Ridership Analysis: FY 2018
 SRTA Year End Fixed Route Ridership Analysis: FY 2018 2018 Contents Introduction... 1 A. Key Terms Used in this Report... 1 Key Findings... 2 A. Ridership... 2 B. Fare Payment... 4 Performance Analysis
Att. A, AI 46, 11/9/17
 Total s San Diego Metropolitan Transit System POLICY 42 PERFORMANCE MONITORING REPORT Page 1 of 6 Date: 11/8/17 OBJECTIVE Develop a Customer-Focused and Competitive System The following measures of productivity
PREFACE. Service frequency; Hours of service; Service coverage; Passenger loading; Reliability, and Transit vs. auto travel time.
 PREFACE The Florida Department of Transportation (FDOT) has embarked upon a statewide evaluation of transit system performance. The outcome of this evaluation is a benchmark of transit performance that
LA Metro Rapid - Considerations in Identifying BRT Corridors. Martha Butler LACMTA, Transportation Planning Manager Los Angeles, California
 LA Metro Rapid - Considerations in Identifying BRT Corridors Martha Butler LACMTA, Transportation Planning Manager Los Angeles, California LA Metro Transportation planner/coordinator, designer, builder
Living on the edge: The impact of travel costs on low paid workers living in outer London executive summary. living on the edge 1
 Living on the edge: The impact travel costs on low paid workers living in outer London executive summary living on the edge 1 introduction key findings London has a world-class public transport system
THE AIRTRAIN AIRPORT ACCESS SYSTEM JOHN F. KENNEDY INTERNATIONAL AIRPORT AIRPORT ACCESS SERVICE
 THE AIRTRAIN AIRPORT ACCESS SYSTEM JOHN F. KENNEDY INTERNATIONAL AIRPORT AIRPORT ACCESS SERVICE The JFK AirTrain airport access system interfaces with two existing regional transit systems; the Long Island
A. CONCLUSIONS OF THE FGEIS
 Chapter 11: Traffic and Parking A. CONCLUSIONS OF THE FGEIS The FGEIS found that the Approved Plan will generate a substantial volume of vehicular and pedestrian activity, including an estimated 1,300
Date: 11/6/15. Total Passengers
 Total San Diego Metropolitan Transit System POLICY 42 PERFORMANCE MONITORING REPORT Page 1 of 6 OBJECTIVE Develop a Customer-Focused and Competitive System The following measures of productivity and service
CURRENT SHORT-RANGE TRANSIT PLANNING PRACTICE. 1. SRTP -- Definition & Introduction 2. Measures and Standards
 CURRENT SHORT-RANGE TRANSIT PLANNING PRACTICE Outline 1. SRTP -- Definition & Introduction 2. Measures and Standards 3. Current Practice in SRTP & Critique 1 Public Transport Planning A. Long Range (>
Title VI Service Equity Analysis
 Pierce Transit Title VI Service Equity Analysis Pursuant to FTA Circular 4702.1B NE Tacoma Service May 2016 Pierce Transit Transit Development Dept. PIERCE TRANSIT TITLE VI SERVICE EQUITY ANALYSIS TABLE
Interstate 90 and Mercer Island Mobility Study APRIL Commissioned by. Prepared by
 Interstate 90 and Mercer Island Mobility Study APRIL 2017 Commissioned by Prepared by Interstate 90 and Mercer Island Mobility Study Commissioned by: Sound Transit Prepared by: April 2017 Contents Section
PUBLIC TRANSIT IN KENOSHA, RACINE, AND MILWAUKEE COUNTIES
 PUBLIC TRANSIT IN KENOSHA, RACINE, AND MILWAUKEE COUNTIES #118404v1 Regional Transit Authority June 19, 2006 1 Presentation Overview Existing Public Transit Transit System Peer Comparison Recent Transit
WESTERN EL DORADO COUNTY SHORT AND LONG-RANGE TRANSIT PLAN Executive Summary
 WESTERN EL DORADO COUNTY SHORT AND LONG-RANGE TRANSIT PLAN Executive Summary Prepared for the El Dorado County Transportation Commission Prepared by The El Dorado County Transportation Commission (EDCTC)
METROBUS SERVICE GUIDELINES
 METROBUS SERVICE GUIDELINES In the late 1990's when stabilization of bus service was accomplished between WMATA and the local jurisdictional bus systems, the need for service planning processes and procedures
Memorandum. DATE: May 9, Board of Directors. Jim Derwinski, CEO/Executive Director. Fare Structure Study Fare Pilot Program
 Memorandum DATE: May 9, 2018 TO: FROM: SUBJECT: Board of Directors Jim Derwinski, CEO/Executive Director Fare Structure Study Fare Pilot Program RECOMMENDATION Board action is requested to approve an ordinance
APPENDIX B. Arlington Transit Peer Review Technical Memorandum
 APPENDIX B Arlington Transit Peer Review Technical Memorandum Arlington County Appendix B December 2010 Table of Contents 1.0 OVERVIEW OF PEER ANALYSIS PROCESS... 2 1.1 National Transit Database...2 1.2
Fare Policy Discussion Background and History
 Fare Policy Discussion Background and History Transportation Committee Nick Eull Senior Manager of Revenue Operations February 27 th, 2017 2013 Fare Policy Analysis Report Cross-functional group comprised
CENTRAL OREGON REGIONAL TRANSIT MASTER PLAN
 Central Oregon Regional Transit Master Plan Volume II: Surveys and Market Research CENTRAL OREGON REGIONAL TRANSIT MASTER PLAN Volume IV: Service Plan Appendices A-B July 213 Nelson\Nygaard Consulting
Peer Performance Measurement February 2019 Prepared by the Division of Planning & Market Development
 2017 Regional Peer Review Peer Performance Measurement February 2019 Prepared by the Division of Planning & Market Development CONTENTS EXECUTIVE SUMMARY... 3 SNAPSHOT... 5 PEER SELECTION... 6 NOTES/METHODOLOGY...
Airport Planning Area
 PLANNING AREA POLICIES l AIRPORT Airport Planning Area LOCATION AND CONTEXT The Airport Planning Area ( Airport area ) is a key part of Boise s economy and transportation network; it features a multi-purpose
Getting to The Juilliard School
 Getting to The Juilliard School TRANSPORTATION FROM AREA AIRPORTS Airport Shuttles Super Shuttle (800) BLUE-VAN (800-258-3826) https://www.supershuttle.com/ NYC Airporter (718) 777-5111 http://www.nycairporter.com/
ROUTE EBA EAST BUSWAY ALL STOPS ROUTE EBS EAST BUSWAY SHORT
 ROUTE EBA EAST BUSWAY ALL STOPS ROUTE EBS EAST BUSWAY SHORT The EBA East Busway All Stops and EBS East Busway Short routes provide the core Martin Luther King Jr. East Busway services. Route EBA operates
DRAFT Service Implementation Plan
 2017 Service Implementation Plan October 2016 SECTION NAME 2017 Service Implementation Plan October 2016 2017 SERVICE IMPLEMENTATION PLAN TABLE OF CONTENTS Table of Contents... I List of Tables... III
The Boulder (and Boulder County) Experience. June 6 th, 2017 RTD s Pass Program Working Group 2 nd Meeting
 Experience. June 6 th, 2017 RTD s Pass Program Working Group 2 nd Meeting") The Boulder (and Boulder County) Experience June 6 th, 2017 RTD s Pass Program Working Group 2 nd Meeting The Boulder (and Boulder County) Experience This will cover: 1) Eco Pass Revenues to RTD 2) Public
The Boulder (and Boulder County) Experience June 6 th, 2017 RTD s Pass Program Working Group 2 nd Meeting The Boulder (and Boulder County) Experience This will cover: 1) Eco Pass Revenues to RTD 2) Public
PERFORMANCE REPORT NOVEMBER 2017
 PERFORMANCE REPORT NOVEMBER 2017 Note: New FY2018 Goal/Target/Min or Max incorporated in the Fixed Route and Connection Dashboards. Keith A. Clinkscale Performance Manager INTRODUCTION/BACKGROUND In June
TRANSPORT AFFORDABILITY INDEX
 TRANSPORT AFFORDABILITY INDEX Report - December 2016 AAA 1 AAA 2 Table of contents Foreword 4 Section One Overview 6 Section Two Summary of Results 7 Section Three Detailed Results 9 Section Four City
TORONTO TRANSIT COMMISSION REPORT NO.
 Revised: March/13 TORONTO TRANSIT COMMISSION REPORT NO. MEETING DATE: SUBJECT: Resubmitted: November 18, 2013 October 23, 2013 TTC Fare Policy - Requests for Fare Discounts ACTION ITEM RECOMMENDATION It
5 Rail demand in Western Sydney
 5 Rail demand in Western Sydney About this chapter To better understand where new or enhanced rail services are needed, this chapter presents an overview of the existing and future demand on the rail network
Appendix 4.1 J. May 17, 2010 Memorandum from CTPS to the Inter Agency Coordinating Group
 Appendix 4.1 J May 17, 2010 Memorandum from CTPS to the Inter Agency Coordinating Group CTPS CENTRAL TRANSPORTATION PLANNING STAFF Staff to the Boston Region Metropolitan Planning Organization MEMORANDUM
Transit System Performance Update
 Clause 5 in Report No. 4 of Committee of the Whole was adopted, without amendment, by the Council of The Regional Municipality of York at its meeting held on March 29, 2018. 5 2017 Transit System Performance
EL PASO COUNTY REGIONAL TRANSIT INSTITUTIONAL OPTIONS ASSESSMENT STUDY
 EL PASO COUNTY REGIONAL TRANSIT INSTITUTIONAL OPTIONS ASSESSMENT STUDY Sponsored by: El Paso County Funding Support: Texas Department of Transportation Technical Assistance to the County: Texas A&M Transportation
STAFF REPORT ACTION REQUIRED
 STAFF REPORT ACTION REQUIRED TTC Fare Policy Principles Date: September 28, 2015 To: From: TTC Board Chief Executive Officer Summary This report will take the form of a presentation recommending the high
FY Year End Performance Report
 Overall Ridership Big Blue Bus carried 18,748,869 passengers in FY2014-2015, a 0.3% reduction from the year prior. This negligible reduction in ridership represents the beginnings of a reversal from a
RACINE COUNTY PUBLIC TRANSIT PLAN:
 RACINE COUNTY PUBLIC TRANSIT PLAN: 2013-2017 Recommended Transit Service Improvement Plan NEWSLETTER 3 SEPTEMBER 2013 This newsletter describes the final recommended public transit plan for the City of
Assessment of Travel Trends
 I - 2 0 E A S T T R A N S I T I N I T I A T I V E Assessment of Travel Trends Prepared for: Metropolitan Atlanta Rapid Transit Authority Prepared by: AECOM/JJG Joint Venture Atlanta, GA October 2011 General
BOSTON REGION METROPOLITAN PLANNING ORGANIZATION
 PLANNING ORGANIZATIO BOSTON REGION MPO NMETROPOLITAN BOSTON REGION METROPOLITAN PLANNING ORGANIZATION Stephanie Pollack, MassDOT Secretary and CEO and MPO Chair Karl H. Quackenbush, Executive Director,
Community Transit Solutions for the Suburbs CTAA Expo June 2014
 Community Transit Solutions for the Suburbs CTAA Expo June 2014 New Suburban Challenges Lower density development patterns Where is the funding to compete with urban and suburban commuter needs? Increased
Memorandum. Roger Millar, Secretary of Transportation. Date: April 5, Interstate 90 Operations and Mercer Island Mobility
 Memorandum To: From: The Honorable Dow Constantine, King County Executive; The Honorable Ed Murray, City of Seattle Mayor; The Honorable Bruce Bassett, City of Mercer Island Mayor; The Honorable John Stokes,
2018 Service Implementation Plan Executive Summary
 2018 Service Implementation Plan Executive Summary March 2018 2018 SERVICE IMPLEMENTATION PLAN Executive Summary 2018 Service Implementation Plan Each year, Sound Transit prepares a Service Implementation
Sample enumeration model for airport ground access
 Sample enumeration model for airport ground access Surabhi Gupta, Peter Vovsha (WSP) Session 6B Cool model applications Sample enumeration model as example of data-driven approach Use model to predict
BaltimoreLink Implementation Status Report
 BaltimoreLink Implementation Status Report February 218 Joint Chairmen s Report JH1 Executive Summary BaltimoreLink, implemented on June 18, 217, is the complete overhaul and rebranding of the core transit
Airport Profile. St. Pete Clearwater International BY THE NUMBERS 818, ,754 $ Enplanements. Passengers. Average Fare. U.S.
 Airport Profile St. Pete Clearwater International St. Pete-Clearwater International Airport (PIE) is located in Pinellas County, Florida about nine miles north of downwn St. Petersburg, seven miles southeast
Business Growth (as of mid 2002)
") Page 1 of 6 Planning FHWA > HEP > Planning > Econ Dev < Previous Contents Next > Business Growth (as of mid 2002) Data from two business directories was used to analyze the change in the number of businesses
Page 1 of 6 Planning FHWA > HEP > Planning > Econ Dev < Previous Contents Next > Business Growth (as of mid 2002) Data from two business directories was used to analyze the change in the number of businesses
KING STREET TRANSIT PILOT
 KING STREET TRANSIT PILOT Update toronto.ca/kingstreetpilot #kingstreetpilot HIGHLIGHTS TRANSIT RIDERSHIP TRANSIT CAPACITY To respond to this growth in ridership, the TTC has increased the capacity of
2015 Independence Day Travel Overview U.S. Intercity Bus Industry
 2015 Independence Day Travel Overview U.S. Intercity Bus Industry Chaddick Institute for Metropolitan Development, DePaul University June 25, 2015 This Intercity Bus Briefing summarizes the Chaddick Institute
East Farmingdale Fire Department 930 Conklin Street. Source: Parsons Brinckerhoff
 Route 110 Alternatives Analysis Public Meeting #2 April 27, 2015 East Farmingdale Fire Department 930 Conklin Street Source: Parsons Brinckerhoff Agenda Welcome/Project Background Jonathan Keyes Director,
8 CROSS-BOUNDARY AGREEMENT WITH BRAMPTON TRANSIT
 8 CROSS-BOUNDARY AGREEMENT WITH BRAMPTON TRANSIT The Transportation Services Committee recommends the adoption of the recommendations contained in the following report dated May 27, 2010, from the Commissioner
AGENDA GUEMES ISLAND FERRY OPERATIONS PUBLIC FORUM
 AGENDA GUEMES ISLAND FERRY OPERATIONS PUBLIC FORUM Wednesday, August 17, 211 6: p.m. Guemes Island Community Hall ~ 7549 Guemes Island Road Thank you for attending the second Annual Public Forum in 211.
Existing Services, Ridership, and Standards Report. June 2018
 Existing Services, Ridership, and Standards Report June 2018 Prepared for: Prepared by: Contents Overview of Existing Conditions... 1 Fixed Route Service... 1 Mobility Bus... 34 Market Analysis... 41 Identification/Description
Capital Program 2011 Commitments and Completions Year End Review
 Year End Major Commitments Year End Major Completions Change from Prior Month Green = Commitments made w ithin 2 months of Goal 38 42% 2 Red (Hatched) = Commitments delayed beyond 2 4 6% 2 months of Goal,
LOS ALAMOS COUNTY 1000 Central Avenue, Suite Los Alamos, NM Phone (505) Fax (505) Website:
 Fax (505) Website:") 1111 1111 LOS ALAMOS COUNTY 1000 Central Avenue, Suite 350 - Los Alamos, NM 87544 Phone (505) 663-1750 Fax (505) 662-8079 Website: www.losalamosnm.us COUNTY COUNCIL Council Chair Geoff Rodgers Council
1111 1111 LOS ALAMOS COUNTY 1000 Central Avenue, Suite 350 - Los Alamos, NM 87544 Phone (505) 663-1750 Fax (505) 662-8079 Website: www.losalamosnm.us COUNTY COUNCIL Council Chair Geoff Rodgers Council
All Door Boarding Title VI Service Fare Analysis. Appendix P.3
 All Door Boarding Title VI Service Fare Analysis Appendix P.3 Metro Board Report Los Angeles County Metropolitan Transportation Authority One Gateway Plaza 3rd Floor Board Room Los Angeles,
TORONTO TRANSIT COMMISSION REPORT NO.
 Form Revised: February 2005 TORONTO TRANSIT COMMISSION REPORT NO. MEETING DATE: May 6, 2010 SUBJECT: LAKE SHORE BOULEVARD STREETCAR SERVICE ACTION ITEM RECOMMENDATION It is recommended that the Commission
State of the Shared Vacation Ownership Industry. ARDA International Foundation (AIF)
") State of the Shared Vacation Ownership Industry ARDA International Foundation (AIF) This paper includes a high-level overview of the timeshare industry with a core focus on financial growth, owner demographics
State of the Shared Vacation Ownership Industry ARDA International Foundation (AIF) This paper includes a high-level overview of the timeshare industry with a core focus on financial growth, owner demographics
Silver Line Operating Plan
 Customer Service and Operations Committee Information Item IV-A December 6, 2012 Silver Line Operating Plan Washington Metropolitan Area Transit Authority Board Action/Information Summary Action Information
MAKING PERFORMANCE MEASURES MATTER
 www.rtachicago.org 5 TH International Transportation Systems Performance Measurement and Data Conference June 1-2, 2015 Denver, CO MAKING PERFORMANCE MEASURES MATTER Transparency, Accountability, and Advocacy
Ridership Growth Strategy (RGS) Status Update
 Status Update") For Information Ridership Growth Strategy (RGS) Status Update Date: July 10, 2018 To: TTC Board From: Deputy Chief Executive Officer Summary The TTC s Ridership Growth Strategy (RGS), with all its components,
For Information Ridership Growth Strategy (RGS) Status Update Date: July 10, 2018 To: TTC Board From: Deputy Chief Executive Officer Summary The TTC s Ridership Growth Strategy (RGS), with all its components,
3. Proposed Midwest Regional Rail System
 3. Proposed Midwest Regional Rail System 3.1 Introduction The proposed Midwest Regional Rail System (MWRRS) will operate in nine states, encompass approximately 3,000 route miles and operate on eight corridors.
Peer Performance Measurement February 2019 Prepared by the Division of Planning & Market Development
 2017 Sub-Regional Peer Review Peer Performance Measurement February 2019 Prepared by the Division of Planning & Market Development CONTENTS EXECUTIVE SUMMARY... 3 NOTES/METHODOLOGY... 6 AGENCIES... 7
Chapel Hill Transit: Short Range Transit Plan. Preferred Alternative DRAFT
 : Short Range Transit Plan Preferred Alternative August 2018 Table of Contents Executive Summary... 1 Preferred Alternative... 3 Best Practices for Route Design... 3 Project Goals... 4 Preferred Alternative...
Omni New Haven Hotel 155 Temple Street, New Haven, Connecticut 06510
 North American Drama Therapy Association (NADTA) 33rd Annual Conference November 2-5, 2012 New Haven, Connecticut Witnesses to the Dark: the Absence, Emergence and Performance of Trauma Omni New Haven
This report recommends two new TTC transit services in southwest Toronto.
 Report for Action New TTC Services - Southwest Toronto Date: March 20, 2018 To: TTC Board From: Chief Customer Officer Summary This report recommends two new TTC transit services in southwest Toronto.
Our Panelists SPEAKERS MODERATOR
 SPEAKERS Our Panelists Jennifer Aument, Transurban Gary Garczynski, Commonwealth Transportation Board Russ Gestl, Buchanan Partners, LLC Robert Shue, JLL MODERATOR David Birtwistle, Northern Virginia Transportation
MAPPING UNSHELTERED HOMELESSNESS IN INDIANAPOLIS ISSUE C17-20 NOVEMBER 2017
 MAPPING UNSHELTERED HOMELESSNESS IN INDIANAPOLIS ISSUE C17-20 NOVEMBER 2017 AUTHOR Chris Holcomb, Graduate Student, School of Public and Environmental Affairs, IUPUI 334 N. Senate Avenue, Suite 300 Indianapolis,
ALL ABOARD LABOR S LONG TERM PASSENGER TRANSPORT STRATEGY
 ALL ABOARD LABOR S LONG TERM PASSENGER TRANSPORT STRATEGY Revitalising Passenger Transport Increasing traffic congestion in our cities and a lack of transport services in our regional towns is frustrating
Follow-up to Proposed Fare Changes for FY2013
 Finance & Administration Committee Information Item I-A January 19, 2012 Follow-up to Proposed Fare Changes for FY2013 1 of 22 Washington Metropolitan Area Transit Authority Board Action/Information Summary
FY Transit Needs Assessment. Ventura County Transportation Commission
 FY 18-19 Transit Needs Assessment Ventura County Transportation Commission Contents List of Figures and Appendices.. 2 Appendices... 1 Chapter 1: Introduction What is the Ventura County Transportation
A COMPARISON OF THE MILWAUKEE METROPOLITAN AREA TO ITS PEERS
 KRY/WJS/EDL #222377 (PDF: #223479) 1/30/15 PRELIMINARY DRAFT Memorandum Report A COMPARISON OF THE MILWAUKEE METROPOLITAN AREA TO ITS PEERS EXECUTIVE SUMMARY This memorandum report provides a statistical
South Ozone Park and Jamaica via Sutphin Blvd/ Jamaica Av. Between. Local Service. Bus Timetable. Effective Spring 2018.
 Bus Timetable Effective Spring 2018 MTA Bus Company Q9 Local Service a Between South Ozone Park and Jamaica via Sutphin Blvd/ Jamaica Av If you think your bus operator deserves an Apple Award our special
2009 Muskoka Airport Economic Impact Study
 2009 Muskoka Airport Economic Impact Study November 4, 2009 Prepared by The District of Muskoka Planning and Economic Development Department BACKGROUND The Muskoka Airport is situated at the north end
Appendix B Ultimate Airport Capacity and Delay Simulation Modeling Analysis
 Appendix B ULTIMATE AIRPORT CAPACITY & DELAY SIMULATION MODELING ANALYSIS B TABLE OF CONTENTS EXHIBITS TABLES B.1 Introduction... 1 B.2 Simulation Modeling Assumption and Methodology... 4 B.2.1 Runway
This quarterly brochure is compiled by the New York Metropolitan Transportation Council. Data Monitoring and Analysis Unit
 Travel Patterns in the New York Metropolitan Area for 2017 s Second Quarter provides an overview of regional travel patterns. On an average weekday in the Second Quarter, there were 10,326,385 total bus,
2017/ Q1 Performance Measures Report
 2017/2018 - Q1 Performance Measures Report Contents Ridership & Revenue... 1 Historical Revenue & Ridership... 1 Revenue Actual vs. Planned... 3 Mean Distance Between Failures... 5 Maintenance Cost Quarter
Chapter 4. Ridecheck and Passenger Survey
 Chapter 4. Ridecheck and Passenger Survey YOLOBUS operates a mix of local, intercity, commute and rural routes. Because there are limited roadways that intercity and rural routes can operate on, stop by
QM21. Between Rochdale Village, Queens, and Midtown, Manhattan. Express Service Weekdays Only. Bus Timetable. Effective Winter 2017.
 Bus Timetable Effective Winter 2017 MTA Bus Company QM21 Express Service Weekdays Only Between Rochdale Village, Queens, and Midtown, Manhattan If you think your bus operator deserves an Apple Award our
The Importance of Service Frequency to Attracting Ridership: The Cases of Brampton and York
 The Importance of Service Frequency to Attracting Ridership: The Cases of Brampton and York Jonathan English Columbia University CUTA Conference May 2016 Introduction Is density the most important determinant
Title VI Service Equity Analysis
 Pierce Transit Title VI Service Equity Analysis Pursuant to FTA Circular 4702.1B September 2013 Service Change February 2013 Page intentionally left blank PIERCE TRANSIT TITLE VI SERVICE EQUITY ANALYSIS
PERFORMANCE REPORT DECEMBER 2017
 PERFORMANCE REPORT DECEMBER 2017 Note: New FY2018 Goal/Target/Min or Max incorporated in the Fixed Route and Connection Dashboards. Keith A. Clinkscale Performance Manager INTRODUCTION/BACKGROUND Keith
Directions to Nassau Inn from JFK airport using Public Transportation
 Directions to Nassau Inn from JFK airport using Public Transportation Upon arrival to the United States John F. Kennedy airport (JFK) in New York City, you should clear customs and immigration, and then
CHAPTER 1 TRANSIT MARKET AREAS AND EXISTING SERVICE
 CHAPTER 1 TRANSIT MARKET AREAS AND EXISTING SERVICE Transit Market Areas While several factors influence the propensity to use transit, the primary predictors of transit productivity are the density of
TRANSPORT AFFORDABILITY INDEX
 TRANSPORT AFFORDABILITY INDEX Report - March 2018 AAA 1 AAA 2 Table of contents Foreword 4 Section One Overview 6 Section Two Summary of Results 8 Section Three Detailed Results 14 Section Four State by
Other Ways to Get Here Getting Around New York City
 Getting Here For those traveling by air, the City is served by seven area airports. Of these, three are major hubs: John F. Kennedy International Airport (JFK) and LaGuardia Airport (LGA) are both in Queens,
REVISED DRAFT Integrated Hurricane Sandy General Reevaluation Report and Environmental Impact Statement. Atlantic Coast of New York
 REVISED DRAFT Integrated Hurricane Sandy General Reevaluation Report and Environmental Impact Statement Atlantic Coast of New York East Rockaway Inlet to Rockaway Inlet and Jamaica Bay Appendix F Public
TORONTO TRANSIT COMMISSION REPORT NO.
 Revised: March/13 TORONTO TRANSIT COMMISSION REPORT NO. MEETING DATE: March 26, 2014 SUBJECT: KENNEDY INTERCHANGE STATION: METROLINX EGLINTON CROSSTOWN LIGHT RAIL TRANSIT PROJECT - PRELIMINARY CONCEPT