Disclaimer. General securities warning
|
|
|
- Annabel Dixon
- 6 years ago
- Views:
Transcription

1
2 Disclaimer General securities warning This presentation has been prepared by Sydney Airport Limited (ACN ) ( SAL ) in respect of ASXlisted Sydney Airport ( SYD ). SYD is comprised of the stapled entities SAL and Sydney Airport Trust 1 (ARSN ) ( SAT1 ). The Trust Company (Sydney Airport) Limited (ACN /AFSL ) ( TTCSAL ) is the responsible entity of SAT1. This presentation is not an offer or invitation for subscription or purchase of or a recommendation of securities. It does not take into account the investment objectives, financial situation and particular needs of the investor. Before making an investment in SYD, the investor or prospective investor should consider whether such an investment is appropriate to their particular investment needs, objectives and financial circumstances and consult an investment adviser if necessary. Information, including forecast financial information, in this presentation should not be considered as a recommendation in relation to holding, purchasing or selling shares, securities or other instruments in SYD or any other entity. Due care and attention has been used in the preparation of forecast information. However, actual results may vary from forecasts and any variation may be materially positive or negative. Forecasts by their very nature are subject to uncertainty and contingencies, many of which are outside the control of SAL and TTCSAL. Past performance is not a reliable indication of future performance. Sydney Airport advises that on 18 January 2018 foreign ownership was 28.4%.
3 Highlights Results at a glance * Excluding WSA and business acquisition costs. 3
4 Strong growth across the business Our strategy is delivering sustainable results across all businesses 4

5 Initial thoughts after first five weeks Initial observations 5

6 Strong passenger growth Sydney Airport has successfully competed internationally to attract airlines and grow inbound tourism, driving significant economic growth for NSW and Australia PASSENGERS BY GEOGRAPHY 6
7 Monthly passenger growth Incremental monthly capacity Significant capacity additions sustaining international traffic growth Substantial additional capacity and high load factors delivering sustained growth 2017 international passenger growth and capacity additions Load factors across domestic and international have increased over the past 5 years 14.0% 150, % 10.0% 100, % 6.0% 50, % 2.0% 0.0% 0 Jan Feb Mar Apr May Jun Jul Aug Sep Oct Nov Dec 79.1% 78.3% 77.7% 76.5% 76.2% 75.5% 2017 monthly international passenger growth 2017 monthly international passenger growth Fastest growing nationalities in 2017* Germany 5% Thailand 5% Australia 6% USA 6% Indonesia 10% South Korea 12% India 16% China 17% Philippines 19% Vietnam 37% 0% 5% 10% 15% 20% 25% 30% 35% 40% Largest nationality growth in 2017 by absolute passenger numbers ( 000)* Indonesia New Zealand United Kingdom Vietnam Philippines South Korea USA India China Australia Thousand passengers * Includes the period 1 January 2017 to 22 December 2017 as PCP data not available 7
8 60% of our growth in 2017 was off-peak* Increasingly our shoulder periods are filling out and airlines are filling the off-peak slots Off-peak growth Seats commenced in 2017 Peak growth Beijing, Qantas Hanoi, Vietnam Airlines Dubai, Emirates Taipei, China Airlines Auckland, Qantas Apia, Samoa Airways Doha, Qatar Airways (Departure) Ho Chi Minh, Jetstar (Departure) Abu Dhabi, Etihad (Departure) Denpasar Bali, Qantas (Arrival) 60% Off peak growth 40% Peak growth Wuhan, China Eastern Hong Kong, Cathay Pacific Qingdao, Beijing Capital Seoul, Asiana Doha, Qatar Airways (Arrival) Ho Chi Minh, Jetstar (Arrival) Abu Dhabi, Etihad (Arrival) Denpasar Bali, Qantas (Departure) Jakarta, Garuda Manila, Cebu Pacific Seoul, Korean Air Osaka, Qantas *International peak is defined as 6am to 12pm Peak growth Off peak growth 8


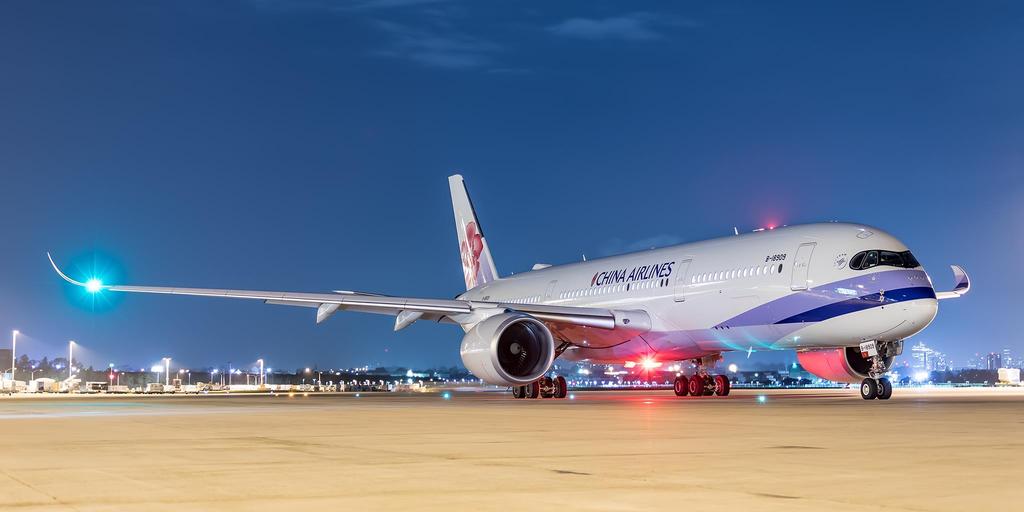
9 Airlines % of International movements on next generation aircraft Next generation aircraft at Sydney Airport In 2017, SYD was the 11th busiest airport in the world for next generation aircraft movements, and 9th in terms of seats International next generation operations at Sydney Airport Currently, 21 airlines are operating next generation aircraft 25% of all scheduled international movements 452 next generation movements per week average seat configuration of 383 seats 33% higher than the overall international average Since 2010, legacy four engine aircraft (B747/A340) numbers have reduced 68%, from an average 38 movements per day to under 15 movements per day In 2017, SYD was the 11 th busiest airport in the world for next generation aircraft movements, and 9 th in terms of seats* Sydney Airport next generation aircraft operations 25 25% 20 19% 21 15% 15 11% % 14 7% 7% 5% Noise profile of legacy and new generation aircraft 25% 20% 15% 10% 5% 0% Source:OAG * Includes Airbus A380, Boeing 787 and Airbus A350 (including variants) 9
10 Distribution 2018 distribution guidance provided of 37.5 cents, an 8.7% increase on 2017 Distributions Consistent distribution growth 2017 distribution of 34.5 cents per stapled security Final distribution of 18.0 cents paid 14 February 2018 Distribution per stapled security % covered by Net Operating Receipts guidance of 37.5 cents per stapled security 8.7% growth on the 2017 distribution Expected to be fully covered by Net Operating Receipts Guidance subject to aviation industry shocks and material forecast changes First half Second half Guidance 10

11 Financial results
12 Operational growth All business units delivering strong performance. Total revenue up 8.7% year on year BUSINESS 2017 HIGHLIGHTS REVENUE $M REVENUE CONTRIBUTION REVENUE GROWTH 3.6% total passenger growth and 7.2% international Aeronautical services Opening new and underserved markets Strong international capacity and load factor growth continuing Significant capital investment program supporting passenger experience, airline operating efficiencies and capacity expansion to meet demand % 8.6% Duty free delivering strong growth with standout performance in core categories liquor, perfume and cosmetics Retail All three terminals fully leased with continued strong retailer demand for space Delivering a superior passenger experience with continued focus on value, range and choice, proven via strong retail sales, passenger satisfaction scores and positive sentiment Completion of The T1 Marketplace precinct and Pier C food offering % 12.7% Property, hotels and car rental Approximately 220 leasing transactions completed in 2017; Property portfolio has over 650 leases and continues to grow providing increasing facilities for our passengers and airline customers Mantra Hotel opened, Ibis Budget acquired in July 2017 with both performing strongly Property portfolio occupancy 99% % 8.4% Five year ground transport works very close to completion, nine months ahead of schedule, delivering reduced congestion and improved circulation Parking and ground transport New car parking products performing well; Priority pick-up and ride sharing areas delivering improved circulation and revenue growth 1000 new international car park spaces delivered in Q % 2.2% 1. Includes aeronautical security recovery 12
13 Statutory income statement Strong EBITDA growth and finance cost management driving statutory income $ MILLIONS Total revenue and other income 1, ,364.6 Total operating expenses (284.5) (257.8) WSA project costs expensed and business acquisition costs (2.5) (21.1) EBITDA 1, ,085.7 Depreciation and amortisation (385.7) (356.5) Profit before net finance costs and income tax (EBIT) Net finance costs (421.6) (409.0) Profit before income tax expense Income tax expense (40.5) (0.6) Profit after income tax expense Add back: Profit attributable to non-controlling interests Net profit attributable to security holders
14 Profit to net operating receipts reconciliation Distribution is fully covered by Net Operating Receipts $ MILLIONS Profit before income tax expense Add back: depreciation and amortisation Profit before tax, depreciation and amortisation Add/(subtract) non-cash expenses - Capital indexed bonds capitalised Amortisation of debt establishment costs WSA costs expensed and business acquisition costs Borrowing costs capitalised (9.3) (9.6) - Change in fair value of swaps 0.2 (22.0) Total non-cash expenses Add/(subtract) other cash movements - Movement in cash balance with restricted use Other (32.0) (20.3) Total other cash movements (18.4) (8.0) Net operating receipts Net operating receipts (excluding WSA and business acquisition costs) Average stapled securities on issue (m) 2, ,237.4 Net operating receipts per stapled security (cents) Net operating receipts per stapled security (excluding WSA) (cents) Distributions declared per stapled security (cents)
15 Capital management update Strong interest coverage and credit metrics improving 31 December 2017 Metrics 1 CFCR 1,3,4 and Net debt / EBITDA 1,3,4 Temporary increase due to T3 drawdown Net debt 2 $8.0b CFCR 3 3.0x Net debt / EBITDA 3 6.7x Credit rating BBB (positive) / Baa1 (stable) Next drawn maturity Mid-2018 Average maturity Early-2024 Average cash interest rate 5 4.9% Spot interest rate hedge position 93% (incl. bank debt) CFCR 4.0x 3.6x 3.2x 2.8x 2.4x 2.0x Net debt / EBITDA 7.6x 7.2x 6.7x 6.8x 6.4x 3.0x 6.0x 5.6x Debt Maturity Profile $m 1,500 1,250 1, ,297 1,199 1,200 Average Maturity 1, Drawn Bank Undrawn Bank Domestic Wrapped Bonds Domestic Unwrapped Bonds Offshore Bonds 1, Debt metrics and ratios calculated for SCACH in line with finance documents 2. Includes SAL bilateral debt facility and Sydney Airport Group cash 3. Excludes EBITDA in relation to the Ibis Budget hotel for 3Q 2017 given transitional treatment as an Excluded Subsidiary under finance documents (2017) 4. Excludes WSA project costs expensed (2016) 5. Excludes capitalised interest, fair value of swaps and amortisation of debt establishment and other costs 15
16 Interest rate and currency risk management Proactive approach in managing interest rate and currency risk Interest rate and currency risk management Proactive approach in managing interest rate and currency risk Interest rate hedging profile right-sized with $3.3b of swap executions over % of interest rate risk on all debt hedged as at 31 December % of interest rate risk on all capital markets debt hedged on average to 31 December % of currency risk on all debt hedged Capital market interest rate hedging 1 100% 80% 100% 100% 100% 100% 100% 100% 100% 100% 100% 100% 79% 100% 100% 60% 40% 20% 0% Existing capital markets debt hedged at the end of each calendar year 16

17 Investing for growth, $428.5m invested in 2017 Invested more than $1 million per day on aviation infrastructure and customer facilities 17
18 Capex outlook Investing for future growth and expected strong international passenger numbers. Capex guidance for $ b Capex Capex guidance expected to be $ billion over four years Capex guidance for 2018 expected to be between $ million Capex guidance includes the additional $500 million, contemplated for additional international aeronautical growth projects Continued strong international passenger growth requires additional aeronautical facilities to accommodate new and existing services Capex projects included in 2018 Resurfacing runways Apron expansion New airfield lighting Gate expansion commencement T2 Pier B retail stores T1 Pier C expansion Gate lounge improvements Baggage carousel replacement/refurbishment program Check-in counter and auto bag-drop development New flyover entry into International precinct New exit road from International Widening of road from M5 to International New digital wayfinding gantries to improve traffic flow IBIS Budget expansion Expression of interest for new potential 430 room Domestic hotel New solar panels 18

19 Strategic initiatives driving our growth


20 Our partnership approach drives international passenger growth Using an analytical approach to identify and target underserved markets, while collaborating with our tourism partners has been successful in delivering new passenger growth to the Airport, Sydney and NSW Factors considered when analysing potential new markets 1. Current passenger movements 2. Economic conditions in country of origin 3. Existing networks and timing 4. Fleet deliveries 5. Will the Australian market support the destination with tourism, business, visiting friends and relatives and education Identify target markets, carriers, and then prioritise targets by the opportunity Target markets Asia India Vietnam South Korea China The Americas Secondary US cities Canada Brazil Argentina Chile 20

21 Investing in efficient infrastructure, driving cost reduction and improved passenger experience Our biometrics process has the potential to revolutionise the passenger journey through our airport 21
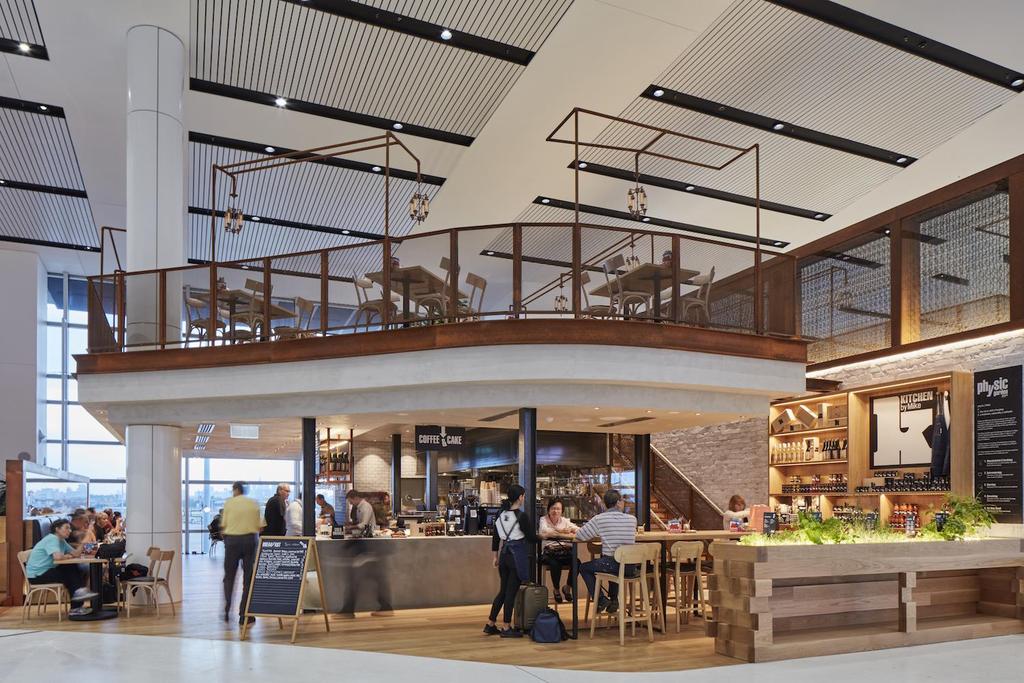
22 Customers responding positively to initiatives and investment On a regular basis, our customers are asked what they thought of their airport experience and how we can improve Customers tell us that some of the key drivers of satisfaction are ambience, cleanliness and wayfinding Expanded terminal areas and facilities Self check-in and auto bag-drop Gate lounge refurbishment Increased retail with focus on value and choice Improved dwell spaces and terminal ambience Improved seating and facilities Increased natural light Digital solutions More personalised flight information to your device Baggage carousel wait times Smart airport - connectivity and real-time reactivity, informing landside and airside operations 22


23 Improving access to the airport is one of our core priorities Access to and from the airport is of paramount importance to the experience of our passengers and stakeholders Enhancing airport access for our customers All projects in five year Ground Transport plan will be delivered in April, 9 months ahead of schedule Five lanes in/out of Domestic New exit and entry roads to/from International Elevated pedestrian and cycle path at International Five lane entry and exit to/from Domestic New state-of-the-art gantry signage at Domestic and International New flyover entry to International will be delivered by Q NSW government works will have a staged completion over Continue to advocate for more public transport choice and value Next five year Ground Transport plan will be delivered in August
24 Hotels represent a potential growth opportunity, we see significant demand for on airport rooms Opportunity for an extra 1,000 rooms today and growing to a potential 1,500 rooms at the point we reach 48 million passengers 5,000 Rooms Hotel room opportunities for each additional million passenger 4,500 4,000 1,043 1,143 1,243 1,343 1,443 1,543 3,500 3, ,500 2,602 2,602 2,602 2,602 2,602 2,602 2,000 Off-airport hotel On-airport hotel Room opportunity Based on forecast modelling of 100 rooms per 1 million passengers, assumes number of rooms in the surrounding area remains constant 24

25 Sustainability leadership Sydney Airport rated a global sustainability leader. Sustainability is driving positive outcomes for the business and our stakeholders 25


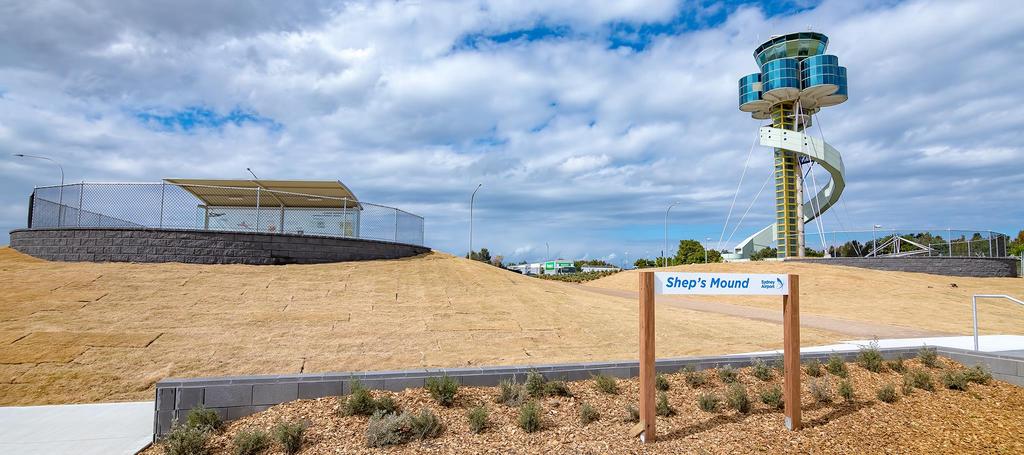
26 Deepened commitment to Sydney and our community A strengthened commitment to and investment in the community, the environment, sport and the arts Keeping local communities connected, healthy, vibrant and thriving Be the best you can be in your field. Supporting the leaders of tomorrow An airport that embraces and showcases Sydney s best. Instilling pride in Sydney's airport 26
27 Outlook

28 Outlook Excellent traffic growth, strong business performance and positive macro tailwinds underpin a positive outlook Key 2018 focus areas Continue to maximise our core business Grow new business opportunities Enhance the culture including strengthening our focus on the customer Guidance 2018 distribution guidance of 37.5c per stapled security Four year investment guidance of $ b supported by aeronautical charges and strong international passenger growth 2018 capex guidance $380-$420m 28
29 Questions
30 Appendix
31 Investment merits Sydney Airport is one of the world s highest quality airport investments 99 year leasehold Lease until 2097 Catchment area Strong passenger growth profile International passengers Commercial opportunities Light handed regulatory framework Outsourced model Consistent growth and downside protections 7.5m Sydney and NSW catchment population Sydney is both a business and tourism hub, in a growing NSW economy Strong visiting friends and relatives, education and tourism market Strong Asian connections increasing urbanisation Account for ~70% of passenger driven revenues Represent 15% of slots Substantial growth opportunities Minimum guarantees offer downside protections Strict hurdle rates of return apply to all investment Commercially negotiated charges agreements with all airlines include investment, price and service levels Light handed regulatory framework supports dual till principle Controllable operating costs contracted and traffic relatively inelastic Long term contracts with airlines and tenants CPI or higher escalation on commercial revenues Growth initiatives across all businesses 31
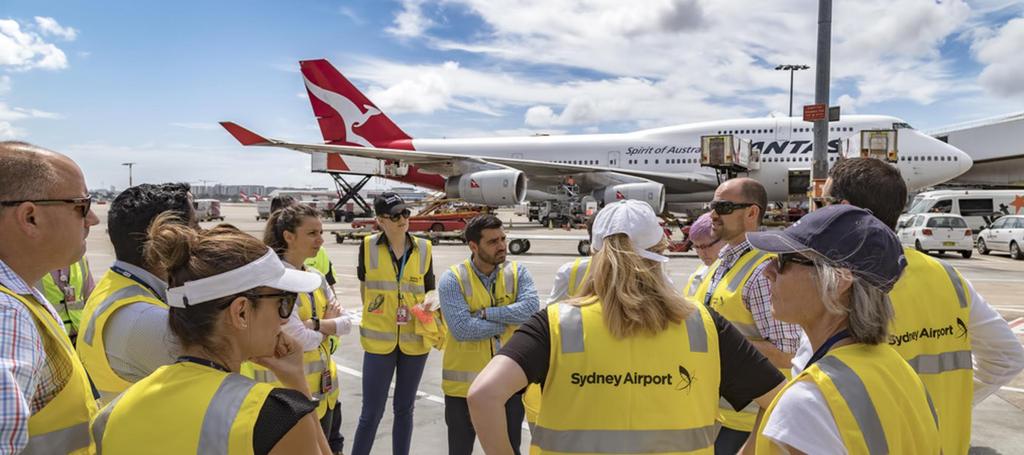
32 Sydney Airport s contribution Sydney Airport is a major generator of economic activity and jobs Economic activity Jobs generated Freight $38.0 billion contributed in economic activity per annum, equivalent to 6.8% of the NSW economy 338,500 jobs generated or facilitated, equivalent to 10% of NSW employment $17.6 billion of freight exports facilitated Visitor nights International visitors arriving in Sydney spent 108 million nights in Australia in 2017 Trip expenditure for average international visitor Household income Average airport wages Typical daily international flight service $2,778 per visitor $19.9 billion contributed to household incomes Average FTE wage of an employee working in the Sydney Airport precinct is 12% higher than NSW average $122 million contributed to the Australian economy from a typical daily international service to Sydney Source: Deloitte Access Economic (2017) 32


33 Traffic growth drivers Positive outlook for all key traffic growth drivers 1 Strong NSW economic growth continuing 2 Rising middle-class across Asia $80b infrastructure program over 4 years driving economic growth Strong forecast budget surplus projections Source: AFFLUENT CAGR 19.6% UPPER MIDDLE CLASS CAGR 22.6% MASS MIDDLE & POOR CAGR -3.3% Source: 3 Aircraft size, range and seat density continues to increase 4 International trade and bilateral agreements delivering growth in key markets % 1 Countries with open aviation agreements with Australia* % Seats Seats PCP gauge growth 1.4% China Japan New Zealand United States Switzerland United Kingdom Singapore 2017 SYD Avg A320 NEO B737 MAX9 Narrowbody Aircraft 2017 SYD Avg Widebody Aircraft B A A Indicative growth rates to midpoint of manufacturers certified seat range. * As at 31 December
34 Annual Pax (Millions) Long term traffic growth Resilient passenger growth across all economic cycles and events International Domestic & Regional Total 34

35 Passenger mix and capacity are the important growth drivers International passenger growth is forecast to continue to outpace domestic growth International now 37% of total passengers; expected to continue to outpace domestic growth; delivering high value to Sydney Airport and the economy High value international aircraft utilise just 15% of slots but international passengers drive 70% of our passenger related revenues (aero and retail) Passengers (m pax) ~60% International growth % domestic growth Master Plan forecasts based on latest views on int l and domestic growth Domestic/ int l pax mix will reflect the two-airport system post Domestic International * Includes General Aviation movements without slot tenure (2-3% of slots). 35
36 Highly diversified passenger and destination mix Significant diversity in airlines, passengers and destinations served by Sydney Airport Diverse purpose of travel of Sydney Airport s international visitors (%) 16% 4% 23% 9% Holiday 48% VFR (visiting friends & relatives) Other Business Education Foreign residency breakdown (%) 48% Australian destination breakdown (%) 52% Other (9) Other (9) China (8) China (8) New Zealand New Zealand (6) (6) USA USA (6) UK (4) UK (4) Korea Korea (3) (3) Japan Japan (2) (2) Singapore (2) Singapore (2) India (2) (2) (1) Hong Kong Hong (2) Kong (1) (1) India Canada (1) (1) Germany Canada(1) (1) Malaysia Germany (1) (1) Indonesia Malaysia (1) (1) France Indonesia (1) (1) Philippines (1) France (1) (6) Other (23) Other USA (15) (23) USA New (15) Zealand New Indonesia Zealand (13) (7) Indonesia (7) China (6) China (6) UK (6) UK (6) Fiji (5) Fiji (5) Thailand (5) Thailand (5) Japan Japan (3) (3) Singapore (3) Singapore (3) India India (3) (3) Hong Hong Kong Kong (3) Philippines Philippines (3) (3) Vietnam Vietnam (2) Canada Canada (2) Italy Italy (2) (13) 1. Source: DIAC, data recorded by residency and final destination 12 Months to May
37 Announced capacity highlights for second half of 2017 New international seat additions contribute to positive growth outlook for 2018 Airline Route Annual seats Emirates Dubai 356,000 Qatar Doha 260,000 China Airlines Taipei 223,000 United Airlines Houston 184,000 Qantas Auckland 175,000 Etihad Abu Dhabi 123,000 Qantas Osaka 92,000 Cathay Pacific Hong Kong 65,000 Beijing Capital Qingdao 58,000 Asiana Seoul 44,000 Samoa Airways Apia 35,000 Hainan Haikou 21,000 Tianjin Zhengzhou 17,000 Cebu Manila 17,000 37
38 Thank you
KERRIE MATHER MANAGING DIRECTOR AND CHIEF EXECUTIVE OFFICER. Macquarie Conference 4 MAY 2016
 KERRIE MATHER MANAGING DIRECTOR AND CHIEF EXECUTIVE OFFICER Macquarie Conference 4 MAY 2016 Disclaimer General securities warning This presentation has been prepared by Sydney Airport Limited (ACN 165
Full Year Results FEBRUARY 2016
 KERRIE MATHER MANAGING DIRECTOR AND CHIEF EXECUTIVE OFFICER HUGH WEHBY CHIEF FINANCIAL OFFICER Full Year Results 2015 18 FEBRUARY 2016 Disclaimer General securities warning This presentation has been prepared
Kerrie Mather Managing Director and Chief Executive Officer. Greg Botham Chief Financial Officer. HALF YEAR RESULTS August 2017
 Kerrie Mather Managing Director and Chief Executive Officer Greg Botham Chief Financial Officer HALF YEAR RESULTS 2017 22 August 2017 Disclaimer General securities warning This presentation has been prepared
Sydney Airport delivers another year of strong performance and is well positioned for growth
 21 February 2018 Sydney Airport delivers another year of strong performance and is well positioned for growth Growth across all businesses with total revenue increasing 8.7% Record passenger numbers of
For personal use only
 Sydney Airport Holdings Limited ABN 85 075 295 760 AFSL 236875 Central Terrace Building 10 Arrivals Court Sydney International Airport New South Wales 2020 T 1800 181 895 or +61 2 9667 9871 F +61 2 9667
For personal use only
 ASX Release 2 May 2012 Sydney Airport Presentation at Key Investment Themes Events Please find attached a presentation to be delivered by Sydney Airport management, as part of the Goldman Sachs Asset Management
Sydney Airport. Investment Highlights
 Sydney Airport Investment Highlights Disclaimer General Securities Warning This presentation has been prepared by Sydney Airport Holdings Limited (ACN 075 295 760 / AFSL 236875). This presentation is not
SYDNEY AIRPORT FULL YEAR RESULTS 2014
 SYDNEY AIRPORT FULL YEAR RESULTS 2014 26 FEBRUARY 2015 KERRIE MATHER MANAGING DIRECTOR AND CHIEF EXECUTIVE OFFICER HUGH WEHBY CHIEF FINANCIAL OFFICER Disclaimer This presentation has been prepared by Sydney
AUSTRALIAN AIRPORTS ASSOCIATION AUSTRALIAN AIRPORTS DRIVING TOURISM GROWTH
 AUSTRALIAN AIRPORTS ASSOCIATION AUSTRALIAN AIRPORTS DRIVING TOURISM GROWTH AUSTRALIAN AIRPORTS DRIVING TOURISM GROWTH DRIVING ECONOMIC GROWTH In 2016-17 Australian airports added: $34.6 billion in economic
For personal use only
 ASX Release 5 December 2011 MAp Sydney Airport Announces New Vision to Integrate International, Domestic and Regional Services Please find attached a presentation providing further information about Sydney
AFTA Travel Trends. July 2017
 AFTA Travel Trends July 2017 AFTA Travel Trends Report 2017 Inbound and Outbound overview Introduction This snapshot provides an overview of the balance of trade between Inbound and Outbound Travel for
AFTA Travel Trends. June 2017
 AFTA Travel Trends June 2017 AFTA Travel Trends Report 2017 Inbound and Outbound overview Introduction This snapshot provides an overview of the balance of trade between Inbound and Outbound Travel for
Aviation Performance in NSW
 Aviation Performance in NSW 2017-18 This report by Tourism Futures International for Destination New South Wales reviews the operating environment and aviation performance of Sydney and NSW over 2017 and
2007/08 Full Year Results Investor Briefing
 2007/08 Full Year Results Investor Briefing Highlights of Result Profit before tax up 46% to $1,408 million Up 36% on the reported result Margin improvement $3 billion of Sustainable Future Benefits achieved
Airport forecasting is used in master planning to guide future development of the Airport.
 Airport Forecasts Airport forecasting is used in master planning to guide future development of the Airport. 4.1 INTRODUCTION Airport forecasting ensures development is appropriate for passengers, ground
GATWICK AIRPORT JOINS VINCI AIRPORTS December 2018
 GATWICK AIRPORT JOINS VINCI AIRPORTS December 2018 Asset presentation Gatwick is the 2 nd largest airport in the UK and the 8 th busiest in Europe with 46 mpax Key features 46 mpaxin FY18, in the wealthiest
Cathay Pacific Airways Interim Results for the six months ended 30 June 2012
 Cathay Pacific Airways Interim Results for the six months ended 30 June 2012 8 August 2012 1 Interim Result 1H2012 1H2011 Change Group attributable (loss) / profit HK$ million (935) 2,808-133.3% Group
Bank of America Merrill Lynch 2018 Emerging Markets Corporate Credit Conference. Miami, May 2018
 Bank of America Merrill Lynch 2018 Emerging Markets Corporate Credit Conference Miami, May 2018 This presentation may include forward-looking comments regarding the Company s business outlook and anticipated
Cathay Pacific Airways Analyst Briefing. 21 November 2014
 Cathay Pacific Airways Analyst Briefing 21 November 2014 Operating Performance Passenger demand remains strong, although growth in North America is significantly short of increase in capacity. Demand for
QANTAS HALF YEAR 2015 FINANCIAL RESULTS 1
 QANTAS HALF YEAR 2015 FINANCIAL RESULTS 1 Key points: Underlying Profit Before Tax: $367 million Statutory Profit After Tax: $206 million Transformation benefits: $374 million Comparable unit cost reduction:
Heathrow (SP) Limited
 Limited") Draft v2.0 10 Feb Heathrow (SP) Limited Results for year ended 31 December 2013 24 February 2014 Strong operational and financial performance in 2013 Passenger satisfaction at record high and over 72 million
Draft v2.0 10 Feb Heathrow (SP) Limited Results for year ended 31 December 2013 24 February 2014 Strong operational and financial performance in 2013 Passenger satisfaction at record high and over 72 million
Santander 22 nd Annual Latin American Conference. Cancun, January 2018
 Santander 22 nd Annual Latin American Conference Cancun, January 2018 This presentation may include forward-looking comments regarding the Company s business outlook and anticipated financial and operating
Cathay Pacific Airways
 Cathay Pacific Airways Interim Results for the six months ended 30 th June 2014 13th August 2014 1 Interim Results 1H2014 1H2013 Change Profit attributable to the shareholders of Cathay Pacific HK$ million
Overview. > Normalised earnings* before taxation of, up 30% > Statutory earnings before taxation of, up 40% > Statutory net profit after taxation of
 1 Overview > Normalised earnings* before taxation of, up 30% > Statutory earnings before taxation of, up 40% > Statutory net profit after taxation of > Operating revenue of > Strong operating cash flow
MACQUARIE AIRPORTS FULL YEAR & FOURTH QUARTER 2008 RESULTS FOR SYDNEY AIRPORT
 Macquarie Airports Management Limited ABN 85 075 295 760 AFS Licence No. 236875 A Member of the Macquarie Group of Companies No. 1 Martin Place SYDNEY NSW 2000 GPO Box 4294 SYDNEY NSW 1164 AUSTRALIA Telephone
2012 Result. Mika Vehviläinen CEO
 2012 Result Mika Vehviläinen CEO 1 Agenda Market environment in Q4 Business performance and strategy execution Outlook Financials 2 Market Environment According to IATA, Global air travel continues to
J.P. Morgan 2019 Global Emerging Markets Corporate Conference. Miami, February 2019
 J.P. Morgan 2019 Global Emerging Markets Corporate Conference Miami, February 2019 This presentation may include forward-looking comments regarding the Company s business outlook and anticipated financial
Analysts Briefing. 18 March Cathay Pacific Airways Limited
 Analysts Briefing 18 March 2015 Cathay Pacific Airways Limited Annual Results 2014 2013 Change Group attributable profit HK$m 3,150 2,620 +20.2% Group turnover HK$m 105,991 100,484 +5.5% Profit margin
Crown Resorts Limited
 Crown Resorts Limited 2015 Full Year Results Presentation 13 August 2015 1 Crown Resorts Limited Results Overview Crown Resorts Limited (Crown) performance: Overall, the results for Crown s portfolio of
INVESTOR PRESENTATION. Imperial Capital Global Opportunities Conference September 2015
 INVESTOR PRESENTATION Imperial Capital Global Opportunities Conference September 2015 Forward-looking Statements This presentation contains forward-looking statements within the meaning of the Private
Air China Limited Annual Results. March Under IFRS
 Air China Limited 21 Annual Results Under IFRS March 211 Agenda Part 1 Highlights Part 2 Business Overview Part 3 Financial Overview Part 4 Outlook 2 Part 1 Highlights Steady Economic Growth; Asia Pacific
For personal use only
 QANTAS GROUP MARKET UPDATE SYDNEY, 5 December 2013: The Qantas Group today announced a market update, accelerated cost reductions and a capital expenditure and structural review, in response to fundamentally
Tiger Airways Holdings Limited FY11 Results
 Tiger Airways Holdings Limited FY11 Results May 2011 Financial Year Ended 31 March 2011 Disclaimer The information contained in this presentation (the "Information") is provided by Tiger Airways Holdings
Performance monitoring report for 2014/15
 Performance monitoring report for 20/15 Date of issue: August 2015 Gatwick Airport Limited Summary Gatwick Airport is performing well for passengers and airlines, and in many aspects is ahead of the performance
INVESTOR RELATIONS Earnings Release
 INVESTOR RELATIONS 2017 2017 Earnings Release 1 Disclaimer This document contains parent results for 2017 based on K-IFRS. These statements involve risks and uncertainties, and actual results may differ.
Management Presentation. March 2016
 Management Presentation March 2016 Forward looking statements This presentation as well as oral statements made by officers or directors of Allegiant Travel Company, its advisors and affiliates (collectively
Media Release QANTAS RESULTS FOR THE HALF YEAR ENDED 31 DECEMBER 2004 HIGHLIGHTS. Fully franked interim dividend of 10 cents per share
 Media Release QANTAS RESULTS FOR THE HALF YEAR ENDED 31 DECEMBER 2004 HIGHLIGHTS Profit before tax of $601.3 million Net profit after tax of $458.4 million Revenue of $6.4 billion Fully franked interim
Qantas Airways Limited Alan Joyce, CEO Qantas Airways. Macquarie Australia Conference 3 May 2013
 Qantas Airways Limited Alan Joyce, CEO Qantas Airways Macquarie Australia Conference 3 May 2013 Qantas Group: April 2013 2 Delivering on the Group s Strategic Priorities Turning around Qantas International
Heathrow (SP) Limited
 Limited") 28 April 2014 Heathrow (SP) Limited Results for three months ended 31 March 2014 Strong operational and financial performance at the outset of the new regulatory period Highest ever passenger satisfaction
28 April 2014 Heathrow (SP) Limited Results for three months ended 31 March 2014 Strong operational and financial performance at the outset of the new regulatory period Highest ever passenger satisfaction
Crown Resorts Limited
 Crown Resorts Limited 2016 Half Year Results Presentation 25 February 2016 1 Crown Resorts Limited Results Overview Crown Resorts Limited (Crown) performance: The 2016 First Half results across Crown s
Forward looking statements
 1 Forward looking statements This presentation contains forward-looking statements. Forward-looking statements often include words such as anticipate", "expect", "intend", "plan", "believe, continue or
Cathay Pacific Airways
 Cathay Pacific Airways Annual Results for the year ended 31 st December 2011 14 March 2012 1 Annual Result 2011 2010 Change Group attributable profit HK$5,501m HK$14,048m -60.8% Group Turnover HK$98,406m
AFTA Travel Trends. April 2018
 AFTA Travel Trends April 2018 AFTA Travel Trends Report 2018 Inbound and Outbound overview Introduction This snapshot provides an overview of the balance of trade between Inbound and Outbound Travel for
AFTA Travel Trends. October 2018
 AFTA Travel Trends October 2018 AFTA Travel Trends Report 2018 Inbound and Outbound overview Introduction This snapshot provides an overview of the balance of trade between Inbound and Outbound Travel
AFTA Travel Trends. May 2018
 AFTA Travel Trends May AFTA Travel Trends Report Inbound and Outbound overview Introduction This snapshot provides an overview of the balance of trade between Inbound and Outbound Travel for Year end of
For personal use only
 Half Year Results Press Conference Remarks by Qantas CEO Alan Joyce 21 February 2013 Good morning. Thanks for joining us for the Qantas Group result for the six months ended 31 December 2012. The Group
For personal use only
 Sydney Airport Annual General Meeting 16 May 2013 Swissotel Sydney Disclaimer General Securities Warning This presentation is not an offer or invitation for subscription or purchase of or a recommendation
AFTA Travel Trends. August 2017
 AFTA Travel Trends August 2017 AFTA Travel Trends Report 2017 Inbound and Outbound overview Introduction This snapshot provides an overview of the balance of trade between Inbound and Outbound Travel for
AFTA Travel Trends. February 2018
 AFTA Travel Trends February 2018 AFTA Travel Trends Report 2018 Inbound and Outbound overview Introduction This snapshot provides an overview of the balance of trade between Inbound and Outbound Travel
Cathay Pacific Airways 2011 Analyst Briefing 23 June 2011
 Cathay Pacific Airways 2011 Analyst Briefing 23 June 2011 1 Airline Strategy Grow our international network, expand frequencies and further develop Hong Kong as one of the world s leading aviation hubs
AFTA Travel Trends. November 2018
 AFTA Travel Trends November AFTA Travel Trends Report Inbound and Outbound overview Introduction This snapshot provides an overview of the balance of trade between Inbound and Outbound Travel for Year
State of the Aviation Industry
 State of the Aviation Industry Presentation to the ACI Airport Economics & Finance 10 th 11 th February London, United Kingdom Laurie N. Price Director of Aviation Strategy Mott MacDonald Aviation Current
Media Release. Qantas Group Full Year 2017 Financial Result 1. Sydney, 25 August 2017
 Media Release Qantas Group Full Year 2017 Financial Result 1 Sydney, 25 August 2017 Underlying Profit Before Tax: $1,401 million (second highest in Qantas history) Statutory Profit Before Tax: $1,181 million
Auckland International Airport FY19 Interim Results: Positive start to year as airport progresses anchor infrastructure projects
 Media Release 22 February 2019 Auckland International Airport FY19 Interim Results: Positive start to year as airport progresses anchor infrastructure projects Auckland Airport today announced its financial
Thank you for participating in the financial results for fiscal 2014.
 Thank you for participating in the financial results for fiscal 2014. ANA HOLDINGS strongly believes that safety is the most important principle of our air transportation business. The expansion of slots
QANTAS DELIVERS STRONG FIRST HALF RESULT DESPITE HIGHER FUEL BILL
 ASX and Media Release Sydney, 21 February 2019 QANTAS DELIVERS STRONG FIRST HALF RESULT DESPITE HIGHER FUEL BILL Underlying Profit Before Tax: $780 million (down $179 million) Statutory Profit Before Tax:
Aviation Performance in NSW
 October 2017 This report by Tourism Futures International (TFI) for Destination New South Wales reviews the operating environment and aviation performance of Sydney and NSW over 2016 and into 2017. Key
Analyst Presentation. 9 th June 2006
 Analyst Presentation 9 th June 2006 1 Existing Principal Shareholding Structure CITIC Pacific 46.30% 25.40% 10.00% 68.36% CNAC(HK) 43.29% 7.71% 17.79% 28.50% Dragonair Source: Announcement on 9 th June
For personal use only
 ASX and Media Release QANTAS DELIVERS RECORD FIRST HALF PROFIT, INVESTS IN AIRCRAFT AND TRAINING Sydney, 22 February 2018 Underlying Profit Before Tax: $976 million (up 15%) Record results for Qantas Domestic,
Understanding the Market
 IATA Seminar: A Successful Airport for a Successful Industry Understanding the Market Ian Thomas Senior Consultant Industry Affairs The Asian Growth Bubble Regional economic expansion + China + Air service
26 October 2017 Icelandair Group Interim Report NET PROFIT USD 101 MILLION IN THIRD QUARTER
 NET PROFIT USD 101 MILLION IN THIRD QUARTER Total income in Q3 up by 10% between years, to USD 536.0 million Passenger revenue higher than expected EBITDA unchanged year on year, at USD 161.1 million Passenger
AFTA Travel Trends. January 2019
 AFTA Travel Trends January 2019 AFTA Travel Trends Report 2019 Inbound and Outbound overview Introduction This snapshot provides an overview of the balance of trade between Inbound and Outbound Travel
QANTAS RESULTS FOR THE YEAR ENDED 30 JUNE 2000 HIGHLIGHTS. Net profit before tax of AUD$762.8 million, up AUD$100.3 million, 15 percent on last year
 QANTAS RESULTS FOR THE YEAR ENDED 30 JUNE 2000 HIGHLIGHTS Net profit before tax of AUD$762.8 million, up AUD$100.3 million, 15 percent on last year Net profit after tax of AUD$517.9 million, up AUD$97
HK GAAP RESULTS RELEASE 25 February 2008 STAR CRUISES GROUP ANNOUNCES FOURTH QUARTER AND FULL YEAR RESULTS FOR 2007
 HK GAAP RESULTS RELEASE 25 February 2008 FOR IMMEDIATE RELEASE INTERNATIONAL STAR CRUISES GROUP ANNOUNCES FOURTH QUARTER AND FULL YEAR RESULTS FOR 2007 Key points for the quarter in comparison with 4Q
Commercial Development Update MetroTex Forecast
 Commercial Development Update 10.5.18 John Terrell Vice President Commercial Development Dallas Fort Worth International Airport 1 Texas: #1 in Economic Climate CNBC Best State For Business 2018 Chief
The Qantas Group A Strong, Sustainable Future Alan Joyce, CEO Qantas Airways. Macquarie Australia Conference 4 May 2012
 The Qantas Group A Strong, Sustainable Future Alan Joyce, CEO Qantas Airways Macquarie Australia Conference 4 May 2012 Overview Fleet renewal now substantially complete FY13 capital expenditure reduced
Air China Limited Interim Results. August Under IFRS
 Air China Limited 21 Interim Results Under IFRS August 21 1 Agenda 21 Interim Results Overview Business Overview Financial Overview Outlook 2 2 2 21 Interim Results 3 21 Interim Results Overview 4 4 4
Queensland Tourism Aviation Blueprint to 2016
 Queensland Tourism Aviation Blueprint to 2016 tq.com.au Blueprint outline The purpose of the Queensland Tourism Aviation Blueprint to 2016 is to develop the strategic framework that will guide aviation
An Overview of SATS. Cho Wee Peng, CFO SIAS Corporate Profile & Investment Seminar 30 November 2013
 An Overview of SATS Cho Wee Peng, CFO SIAS Corporate Profile & Investment Seminar 30 November 2013 Forward Looking Statements This presentation may contain forward-looking statements regarding, among other
AFTA Travel Trends. December 2018
 AFTA Travel Trends December 2018 AFTA Travel Trends Report 2018 Inbound and Outbound overview Introduction This snapshot provides an overview of the balance of trade between Inbound and Outbound Travel
PAN PACIFIC HOTELS GROUP LIMITED 2010 FULL YEAR RESULTS BRIEFING 22 FEB 2011
 PAN PACIFIC HOTELS GROUP LIMITED 2010 FULL YEAR RESULTS BRIEFING 22 FEB 2011 2010 RESULTS OVERVIEW STRATEGIC & OPERATIONS HIGHLIGHTS NEO SOON HUP CHIEF FINANCIAL OFFICER 2 CONTENTS Focus and Highlights
HK GAAP RESULTS RELEASE 18 November 2005
 HK GAAP RESULTS RELEASE 18 November 2005 FOR IMMEDIATE RELEASE INTERNATIONAL STAR CRUISES GROUP ANNOUNCES THIRD QUARTER AND FIRST NINE MONTHS RESULTS FOR 2005 Key points for the quarter in comparison with
Asia-Pacific Aviation: Growth and Challenges
 Asia-Pacific Aviation: Growth and Challenges A presentation to the ACI-NA International Aviation Issues Seminar Steve Martin Page 1 Page 2 Defining the Asia Pacific We ll call it GMT +5 GMT +12, minus
INVESTOR PRESENTATION. May 2015
 INVESTOR PRESENTATION May 2015 Forward-looking Statements This presentation contains forward-looking statements within the meaning of the Private Securities Litigation Reform Act of 1995 that reflect the
Cathay Pacific Airways 2012 Analyst Briefing 28 June 2012
 Cathay Pacific Airways 2012 Analyst Briefing 28 June 2012 1 Airline Strategy Grow our international network, expand frequencies and further develop Hong Kong as one of the world s leading aviation hubs
Qantas Airways Limited
 Qantas Airways Limited Macquarie Australia Conference 8 May 2014 Qantas Guiding Strategic Principles Safety is always our first priority The first choice for customers in every market we serve Maintaining
HK GAAP RESULTS RELEASE 12 August 2008 STAR CRUISES GROUP ANNOUNCES FIRST HALF RESULTS FOR 2008
 HK GAAP RESULTS RELEASE 12 August 2008 FOR IMMEDIATE RELEASE INTERNATIONAL STAR CRUISES GROUP ANNOUNCES FIRST HALF RESULTS FOR 2008 The below commentary is prepared based on the comparison of the results
2003/04 Full Year Results Presentation to Investors
 2003/04 Full Year Results Presentation to Investors 19 August 2004 Geoff Dixon Chief Executive Officer Highlights 12 months to June 2004 12 months to June 2003 Increase/ (decrease) % Sales and operating
Forward looking statements
 Forward looking statements This presentation contains forward-looking statements. Forward-looking statements often include words such as anticipate", "expect", "intend", "plan", "believe, continue or similar
AFTA Travel Trends. October 2017
 AFTA Travel Trends October AFTA Travel Trends Report Inbound and Outbound overview Introduction This snapshot provides an overview of the balance of trade between Inbound and Outbound Travel for Year end
Mr. Adel Al-Banwan Deputy CEO
 The 8th Forum for Listed Companies and Analysts ALAFCO Aviation Lease and Finance Co. Mr. Adel Al-Banwan Deputy CEO (18 th April 2016) ALAFCO Aviation Lease and Finance Company K.S.C.P. ALAFCO Aviation
SAS Group Presentation Carnegie, May 22, 2012 Sture Stölen, Head of IR
 SAS Group Presentation Carnegie, May 22, 2012 Sture Stölen, Head of IR 1 This is the SAS Group 128 destinations 27,2 million passengers 28 new routes to be launched 2012 1,085 daily flights Revenues 2011,
AFTA Travel Trends. September 2018
 AFTA Travel Trends September 2018 AFTA Travel Trends Report 2018 Inbound and Outbound overview Introduction This snapshot provides an overview of the balance of trade between Inbound and Outbound Travel
Management Presentation. November 2018
 Management Presentation November 2018 Forward looking statements This presentation as well as oral statements made by officers or directors of Allegiant Travel Company, its advisors and affiliates (collectively
BAA (SP) Limited Results for six months ended 30 June July 2011
 Limited Results for six months ended 30 June July 2011") BAA (SP) Limited Results for six months ended 30 June 2011 July 2011 Record Q2 Heathrow traffic Good overall service standards Strong financial results Successful dollar and sterling financings H1 2011
BAA (SP) Limited Results for six months ended 30 June 2011 July 2011 Record Q2 Heathrow traffic Good overall service standards Strong financial results Successful dollar and sterling financings H1 2011
Peppers Docklands, Melbourne
 Peppers Docklands, Melbourne Contents Mantra Group Overview State of Market 8 3 Australian Market Mantra Group 18 24 Mantra Salt, Kingscliff Peppers Noosa, Noosa Mantra Group* CBD - RevPAR (A$) Largest
UBS 14 th Global Emerging Markets Conference. New York, November 2016
 UBS 14 th Global Emerging Markets Conference New York, November 2016 This presentation may include forward-looking comments regarding the Company s business outlook and anticipated financial and operating
MARKET REPORT. Auckland Hotel Market Outlook
 MARKET REPORT Auckland Hotel Market Outlook SEPTEMBER 2018 Auckland Hotel Market Outlook Market Report - September 2018 Auckland Hotel Market Outlook With the high (summer) season approaching, it won t
Recovery on track, continued strengthening in most segments. Record Jetstar and Frequent Flyer earnings highlight value of portfolio
 Qantas Full Year 2010 Results Presentation Overview Underlying PBT 1 more than tripled to $377m in line with guidance Delivering against strategic priorities Recovery on track, continued strengthening
MAp today released its monthly report on traffic performance at its airports for December Traffic Performance. 8.
 AFSL 236875 Level 9, 130 Pitt Street, Sydney, New South Wales, 2000, Australia T 1800 181 895 or +61 2 9237 3333 F +61 2 9237 3399 www.mapairports.com.au ASX Release 20 January 2010 MAp TRAFFIC PERFORMANCE
Gatwick Airport Limited. Results for six months ended 30 September 2012
 Gatwick Airport Limited Results for six months ended 30 September 2012 28 November 2012 Operational and financial performance Highlights Traffic growth + 1.2% EBITDA + 4.8% Capital expenditure 119.1m Despite
2004/05 Full Year Results Presentation to Investors
 Geoff Dixon Chief Executive Officer 2004/05 Full Year Results Presentation to Investors 18 August 2005 Group Highlights 12 months to June 2005 12 months to June 2004 Increase/ (decrease) % Sales and operating
Changi Airport registers a record 58.7 million passengers in Strong performance on both the passenger and airfreight fronts
 Media Release Changi Airport registers a record 58.7 million passengers in 2016 Strong performance on both the passenger and airfreight fronts SINGAPORE, 30 January 2017 Singapore Changi Airport recorded
Record Result. 2006/07 Full Year Results Investor Presentation. Moved on successfully following bid. Profit before tax % to $1,032 million
 2006/07 Full Year Results Investor Presentation August 16 2007 Record Result Moved on successfully following bid Profit before tax + 53.8% to $1,032 million Group returning above Cost of Capital 2 Key
USA Acquisition Summary. December 2010
 USA Acquisition Summary December 2010 www.roadbearrv.com Strategic Intent 1. To leverage the existing business capabilities in a significant sized and growing tourism market with a similar customer base.
Christopher Rex Managing Director 15 November 2011
 Christopher Rex Managing Director 15 November 2011 Agenda Overview What is important to us? FY 2011 Highlights - Group - Australia - United Kingdom - France Our Growth Strategy Brownfield Developments
Tourism and Events Queensland s Aviation Framework Executive Summary
 Tourism and Events Queensland s Aviation Framework 2018 2025 Executive Summary Key Stakeholders and their Responsibilities DESTINATION PARTNERS Australian Government Australian Government Department of
For personal use only
 Sydney Airport Annual General Meeting 17 May 2012 Sofitel Sydney Wentworth Hotel Disclaimer General Securities Warning This presentation is not an offer or invitation for subscription or purchase of or
A-HTRUST to deepen presence in Japan with the acquisition of a portfolio of hotels
 Press Release For Immediate Release A-HTRUST to deepen presence in Japan with the acquisition of a portfolio of hotels Deepens presence in Osaka, a gateway city with a strong hospitality market, which
Tourism Snapshot A focus on the markets in which the CTC and its partners are active
 Tourism Snapshot A focus on the markets in which the CTC and its partners are active www.canada.travel/corporate May Volume 1, Issue 5 Key highlights Total arrivals from CTC s international markets improved