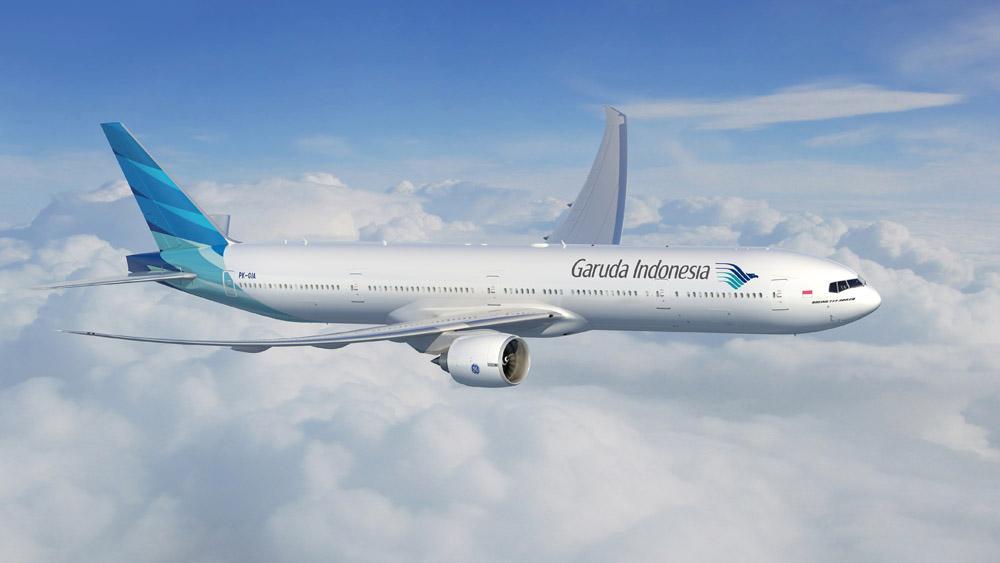
PT GARUDA INDONESIA (PERSERO) Tbk.
|
|
|
- Hugo Powell
- 6 years ago
- Views:
Transcription


1 PT GARUDA INDONESIA (PERSERO) Tbk. Analyst Meeting & Presentation First Half 2013 Result Announcement Jakarta, 2 September 2013 Delivering Indonesia s Best to the World 0
 2,466,965,725 10.90 Other Institutional (less than 2%) 2,501,782,028 11.05 Total Domestic 21,843,190,528 96.")
2 Shareholders & Performance List of Shareholders as of 28 June 2013 Number of Shares % Domestic Government of Indonesia 15,653,128, Retail 1,129,013, Employee 92,300, Institutional (Trans Airways) 2,466,965, Other Institutional (less than 2%) 2,501,782, Total Domestic 21,843,190, Share Performance Price (28 Jun 13, IDR) : 520 Market cap (IDR. mio) : 11,773,318 Number of share : 22,640,996,000 Free Float (%) : week price range : International Retail 4,200, Institutional (less than 2%) 793,605, Total International 797,805, TOTAL 22,640,996, Garuda Indonesia (GIAA) has been only airline listed in IDX since 11 February Member of : Kompas-100 Indeks Saham Syariah IDN ISSI Bisnis-27 SRI-KEHATI GIAA (RHS) - JCI Index (LHS) 1

3 Agenda Page 1. Review of result 1H H Highlights 3-5 Market & Competition 6-8 1H 2013: Operational Results H 2013: Financial Results Subsidiaries Highlights The Remaining 2013 Outlook IMPORTANT DISCLAIMER: Information contained in this document has been prepared from several sources and the Company does not confirm the accuracy and completeness of such data, particularly where the data is sourced from outside the Company. In addition, any forward looking statements are subject to change as a result of market conditions and the final result may be different to that indicated. The Company makes no representation or warranty of any type whatsoever on the accuracy or completion of the information contained herein. 2

4 1H-2013 Highlights Emirsyah Satar, CEO 3
5 1H-2013 Highlights Indicator Passenger Carried Cargo Uplifted Seat Load Factor Passenger Yield Operating Revenue Passenger Revenue Operating Income Income for the Period 1H13 Achievement D% YoY 11.9 million ,262 tons % 0.5 * US$c 9.1 (3.5) USD 1,725.4 million 14.1 USD 1,448.2 million 13.7 USD 14.3 million (0.6) -USD 10.7 million Operating Indicator figures are for Garuda Indonesia and Citilink Financial Indicator figures are for Garuda Indonesia Group * in percentage points n/a DOMESTIC Continued growth in traffic & capacity Impacted by weakening IDR/USD INTERNATIONAL Improved operational performance Welcoming First B ER CITILINK Improved operational performance Improved domestic market share At an early stage of Investment FINANCIAL Fully Repaid USD 55 million Citi Club Deal-1 4
6 Milestones 2Q APR New Boards Members were appointed by the AGM Signing Agreement ALAFCO & Garuda Indonesia for Financing of 2 aircraft B ER with Sharia principles MAY New Destinations: Tanjung Pandan (Belitung) & Bengkulu Introduced Immigration On Board on the Shanghai Jakarta service JUN Garuda Indonesia named The World s Best Economy Class by Skytrax at Paris Airshow Fully repaid the US$ 55 million syndicated commercial loan from Citi Club Deal Welcome the 1 st Delivery of Boeing ER aircraft PSS Cutover Upgrading our reservation system to enhance passenger future experience with Garuda Indonesia 5
7 6 Market & Competition
8 Competition on routes which GA flies per Jun 2013 Garuda Domestic Passengers in/out Selected Airports Garuda International Passengers in/out Selected Airports Total GA Passengers (in million) Market Share 29% 29% 29% 28% 28% 28% 29% 28.6% 27% 26% 26% 25% 22% 24% % 0.5 Total GA Passengers (in million) Market Share 23% 24% 20% 20% 22% 23% 24% 25% 24% 26% 25.5% 24% 21% Q102Q103Q104Q101Q112Q113Q114Q111Q122Q123Q124Q121Q132Q13 GA Domestic Market Share 1H13: 28.0% incr. 0.3 ppts Traffic in million passenger % 11.1% 162.3% % Q102Q103Q104Q101Q112Q113Q114Q111Q122Q123Q124Q121Q132Q13 GA International Market Share 1H13: 25.7% incr. 1.6 ppts Traffic in million passenger % % % 5.34 Jan-Jun 2012 Jan-Jun 2013 Others Citilink GA Dom Source: Airport Authority & GA (traffic in/out CGK, DPS, SUB, UPG airports) Jan-Jun 2012 Jan-Jun 2013 Others GA Int'l 7

9 GA quality has been perceived better from year to year Since embarking on a transformation plan in 2005, GIAA has greatly improved its global and regional rankings and won several international accolades in recognition of its quality performance World Airline Awards Global Airline Rankings Airline Rank Rank Rank 1 Emirates Qatar Airways* Singapore Airlines* ANA All Nippon Airways * Asiana Airlines* Cathay Pacific Airways* Etihad Airways Garuda Indonesia Turkish Airlines Qantas Airways Lufthansa EVA Air Virgin Australia Malaysia Airlines* Thai Airways International Swiss Int l Air Lines Korean Air Air New Zealand Hainan Airlines* Air Canada World Best Economy Class Airline Rank Rank 1 Garuda Indonesia 4 2 Asiana Airlines* 3 3 Singapore Airlines* 1 4 Qatar Airways* 2 5 ANA All Nippon Airways * 5 6 Cathay Pacific Airways* 9 7 Turkish Airlines 7 8 Emirates n/a 9 Oman Air n/a 10 Qantas Airways n/a World s Best Economy Class 2013 Best Economy Class Airline Seat Awards in 1H13: -DOM: 23 awards - INT L: 11 awards * Airlines with 5-star skytrax rating 8

10 1H-2013 Operational Results 9
11 Fleet Expansion and Rejuvenation in 1H-2013 Jun-12 Dec-12 Jun-13 Ops Lease Fin Lease Owned Narrow Body B B B B NG CRJ Total Narrow Body Wide Body B B ER A A Total Wide Body Citilink B B A Total Citilink TOTAL FLEET # of Aircraft Fleet at 31 Dec IN: Delivery of: +20 B NG 4 A CRJ B ER 1 A OUT: - 0 Fleet at 30 June Average Fleet Age (years) Jun'12 Jun' F 10
12 Group Quarterly Performance in the right direction All figures included Garuda Indonesia and Citilink (million) 12 60, , , ,876 38,558 42, , ,334 33,613 35, , Q11 2Q11 3Q11 4Q11 1Q12 2Q12 3Q12 4Q12 1Q13 2Q13 Frequency - RHS ASK (000) - LHS RPK (000) - LHS Pax Carried - LHS 50,000 40,000 30,000 20,000 10,000-11
13 Garuda (Mainbrand) Quarterly Performance (million) , ,231 30,399 30,766 30,779 31,834 32, ,195 35, , ,000 35,000 30,000 25,000 20,000 15,000 10,000 5, Q11 2Q11 3Q11 4Q11 1Q12 2Q12 3Q12 4Q12 1Q13 2Q13 Frequency - RHS ASK (000) - LHS RPK (000) - LHS Pax Carried - LHS - 12
14 Citilink Quarterly Performance (million) ,144 12, ,187 10, ,820 8, ,164 3,103 3,214 4,378 5,038 5,042 6,248 6,000 4, , Q11 2Q11 3Q11 4Q11 1Q12 2Q12 3Q12 4Q12 1Q13 2Q13 Frequency - RHS ASK (000) - LHS RPK (000) - LHS Pax Carried - LHS - in million 1Q11 2Q11 3Q11 4Q11 1Q12 2Q12 3Q12 4Q12 1Q13 2Q13 ASK (000) - LHS RPK (000) - LHS Pax Carried - LHS
 17,775,764 20,881,690 17.5 Average Fuel Price (USD/L) 0.92 0.88 (4.3) Fuel Burn / ATK 0.251 0.250 (0.2) Fuel Burn / Blockhours 4,053 3,481 (14.")
15 Operating Indicators - Group 1H12 1H13 % YoY Operational Efficiency Passenger & Cargo Aircraft Utilization (Hours) 10:47 11:00 0:13 Frequencies 72,693 93, On Time Performance (%) * ASK ( 000) 17,775,764 20,881, Average Fuel Price (USD/L) (4.3) Fuel Burn / ATK (0.2) Fuel Burn / Blockhours 4,053 3,481 (14.1) Passenger Carried 9,617,568 11,869, RPK ( 000) 13,291,314 15,721, Seat Load Factor (%) * Passenger Yield (US ) (3.5) Cargo/Mail Uplifted (Ton) 132, , Financial CASK (US ) (4.4) CASK-excl Fuel (US ) (4.2) Notes: All figures include GA & Citilink, except aircraft Utilization and OTP are for GA Main Brand only * in percentage points 14
16 Operating Indicators 1H13 Mainbrand By Sector DOM INT L 1H12 1H13 % YoY Passenger Carried 6,668,603 7,363, Frequency 50,317 60, ASK ( 000) 7,226,846 8,126, RPK ( 000) 5,768,996 6,238, Seat Load Factor (%) (3.1) Passenger Yield (US ) (2.4) CASK (US ) (2.6) CASK-excl Fuel (US ) (2.2) Passenger Carried 1,764,525 1,914, Frequency 12,296 12, ASK ( 000) 9,259,057 9,991, RPK ( 000) 6,589,402 7,473, Seat Load Factor (%) Passenger Yield (US ) (0.4) CASK (US ) (4.1) CASK-excl Fuel (US ) (3.9) Domestic s SLF & Yield % USc Jan-13 Feb-13 Mar-13 Apr-13 May-13 Jun-13 Seat Load Factor (%) Passenger Yield (US ) Note: * In percentage point 15

17 1H Financial Results Handrito Hardjono, CFO 16
18 Summary of Consolidated Income Statement in USD mio 1H H-2013 % YoY Operating Revenue Operating Expenses Income EBITDAR Scheduled Airline 1, , Non-Scheduled Airline Others Total 1, , Fuel Non Fuel , Total 1, , Income / Loss from Operations (0.6) EBT 12.8 (2.6) n/a Income / Loss Current Period 2.0 (10.7) n/a EBITDAR Margin Nett Margin % % 0.12 % (0.62%) 17
19 Summary of Income Statement Parent Company only in USD mio 1H H-2013 % YoY Operating Revenue Operating Expenses Income Scheduled Airline 1, , Non-Scheduled Airline Others (14.8) Total 1, , Fuel Non Fuel (2.0) Total 1, , Income / Loss from Operations EBT Income / Loss Current Period (4.9)
 Cargo revenue Cargo & Mail Revenue increased by 8.7% to USD 103.")
20 Revenue Trend in 1H-2012 vs 1H-2013 Changes in Operating Revenues (USD mio) +$174.7 (+11.6%) +$8.3 (+0.6%) +$0.7 (+0.05%) +$29.8 (+2.0%) Passenger Revenue 1,725 Strong revenue growth, driven by 23.4% growth on passenger carried (additional 2.25 million passengers as compared to 1H-2012) Cargo revenue Cargo & Mail Revenue increased by 8.7% to USD million 1,512 Non-Scheduled Revenue from Non-Scheduled grew 7% to USD 10.6 million 1H-2012 Operating Revenue Passenger & Excess Baggage Cargo & Mail Non Scheduled Others 1H-2013 Operating Revenue Others Others Revenue increased by 23% to USD million 19
21 1H-2013 Expenses Changes in Operating Expenses (USD mio) $ % $ % Flight Ops $ % Ticketing & Sales $ % User Charges & Station $ % Pax Service $20.3 $6.1 $ % +0.4% +0.4% Others G & A Maintenance 1,711 Expense Item PoT* Fuel 38.3% Flight Ops 20.1% Ticketing & Sales 9.2% Maintenance 8.3% Pax Service 8.2% 1,497 Fuel User Charges & Station 7.5% G & A 6.2% Others 2.3% 1H-2012 Operating Expenses 1H-2013 Operating Expenses *) PoT=Percentage of Total 20
22 Summary of Consolidated Balance Sheet in USD mio 31 Dec Jun 2013 % Asset Liabilities Equities Current Assets Non-Current Assets 1, , Total Assets 2, , Current Liabilities Non-Current Liabilities Total Liabilities 1, , Total Equities 1, ,104.3 (1.0) Total Liabilities & Equities 2, , Lease Adjusted Net Debt/EBITDAR Debt/Equity 4.4 x 0.6 x 4.7 x 0.7 x 21


23 Sustainable Low Net Gearing Cash Position & Net Gearing Total Debt Breakdown 23.2% 51.3% 25.5% Long term loan Lease Liabilities Short term loan Total Debt on June 2013: USD 784 mio - Our Cash Position decreased as per June 2013 due to an increase in Advanced Payment for A/C Purchases and Maintenance Reserve Funds 22
24 Summary of Consolidated Cash Flow in USD mio 30 Jun Jun 2013 % YoY Beginning Cash/Cash Equivalents (21.9) Operating Activities (9.0) Investing Activities (242.2) (314.2) 29.7 Financing Activities (36.9) Net Increase (Decrease) in Cash/Cash Equivalents (156.4) (36.0) 77.0 Effect of Foreign Exchange Rate Changes (9.7) (5.9) 39.5 Ending Cash/Cash Equivalents Operating Activities Increased on interest & financial charges paid and income taxes paid Investing Activities USD million was the payment for PDP & Maintenance Reserve Fund USD 27.4 million was the payment for Security Deposit USD million was the refund of PDP and Maintenance Reserve Fund Financing Activities New Loan: $ million Payment of long-term Loan & Bank Loan: $ million 23

25 24 Subsidiaries
26 Summary of Subsidiaries Performance PT Aerowisata (in USD 000) PT GMF-AA (in USD 000) 1H13 % YoY 1H13 % YoY Operating Revenue 149, Operating Income 3, Net Income 2, EBITDA 8, Operating Revenue 108, Operating Income 5,905 (12.4) Net Income 3,704 (36.3) EBITDA 7,843 (6.2) PT Abacus DS Indonesia (in USD 000) PT Aero System (in USD 000) PT Citilink Indonesia (in USD 000) 1H13 % YoY 1H13 % YoY 1H13 Operating Revenue 1, Operating Income Net Income 169 6,110.9 EBITDA Operating Revenue 10, Operating Income Net Income EBITDA 1, Operating Revenue 128,171 Operating Income (40,850) Net Income (39,125) EBITDA (34,164) 25

27 Outlook for the Remaining 2013 Emirsyah Satar, CEO 26
28 1H-2013 Stay on Track Estimates 2013E Key Drivers 1H # of Fleet 126 Passenger Carried Growth 15% 20% 23.4% 15% - 20% ASK Growth 17.5% $ mio Net PDP $ mio $ mio CAPEX * $ 73.2 mio Note: * GA only, excluding subsidiaries 27


29 Recent Developments Network Operation Funding Garuda s New Destinations: Cengkareng Bengkulu Cengkareng Tanjung Pandan Medan Penang Cengkareng Tanjung Pinang Balikpapan Berau Introduced New Service Concepts 2 July 2013 Fly Liverpool FC for the LFC Tour July 2013 Moved from Polonia Airport to Kuala Namu International Airport - Medan 15 May May June Aug Aug Extra Flights during Eid-ul Fitr 5-16 Aug July 2013 Welcome the 2 nd delivery of B ER 31 July 2013 IDR Bond: Listing in Indonesia Stock Exchange 8 July

30 PT Garuda Indonesia (Persero) Tbk. Investor Relations Department 2nd Floor Management Building Garuda City Soekarno Hatta International Airport Phone : investor@garuda-indonesia.com THANK YOU 29
PT GARUDA INDONESIA (PERSERO) Tbk.
 Tbk.") PT GARUDA INDONESIA (PERSERO) Tbk. Analyst Meeting & Presentation 9Months 2013 Result Announcement Jakarta, 6 November 2013 Delivering Indonesia s Best to the World 0 Shareholders & Performance List of
PT GARUDA INDONESIA (PERSERO) Tbk. Analyst Meeting & Presentation 9Months 2013 Result Announcement Jakarta, 6 November 2013 Delivering Indonesia s Best to the World 0 Shareholders & Performance List of
PT GARUDA INDONESIA (PERSERO) Tbk.
 Tbk.") PT GARUDA INDONESIA (PERSERO) Tbk. Analyst Meeting & Presentation First Quarter 2013 Result Announcement Jakarta, 30 April 2013 Delivering Indonesia s Best to the World 0 Shareholders & Performance List
PT GARUDA INDONESIA (PERSERO) Tbk. Analyst Meeting & Presentation First Quarter 2013 Result Announcement Jakarta, 30 April 2013 Delivering Indonesia s Best to the World 0 Shareholders & Performance List
PT GARUDA INDONESIA (PERSERO) Tbk. Analyst Meeting & Presentation First Quarter 2014 Result Announcement Jakarta, 30 April 2014
 Tbk. Analyst Meeting & Presentation First Quarter 2014 Result Announcement Jakarta, 30 April 2014") PT GARUDA INDONESIA (PERSERO) Tbk. Analyst Meeting & Presentation First Quarter 2014 Result Announcement Jakarta, 30 April 2014 0 Shareholders & Performance List of Shareholders as of 31 March 2014 Number
PT GARUDA INDONESIA (PERSERO) Tbk. Analyst Meeting & Presentation First Quarter 2014 Result Announcement Jakarta, 30 April 2014 0 Shareholders & Performance List of Shareholders as of 31 March 2014 Number
Corporate Presentation PT Garuda Indonesia (Persero) Tbk
 Tbk") Corporate Presentation PT Garuda Indonesia (Persero) Tbk RHB-OSK Hong Kong & ASEAN Corporate Day Hong Kong, 12 September 2013 Delivering Indonesia s Best to the World 0 Agenda 1. Industry Overview 2. Company
Corporate Presentation PT Garuda Indonesia (Persero) Tbk RHB-OSK Hong Kong & ASEAN Corporate Day Hong Kong, 12 September 2013 Delivering Indonesia s Best to the World 0 Agenda 1. Industry Overview 2. Company
ANALYST MEETING PT GARUDA INDONESIA (PERSERO) Tbk. 9M2015 Result Announcement Jakarta, 23 October 2015
 Tbk. 9M2015 Result Announcement Jakarta, 23 October 2015") ANALYST MEETING PT GARUDA INDONESIA (PERSERO) Tbk. 9M2015 Result Announcement Jakarta, 23 October 2015 1 Agenda Hal 1. Company Profile 3 8 2. Operational Performance 9 13 3. Financial Performance 14 20
ANALYST MEETING PT GARUDA INDONESIA (PERSERO) Tbk. 9M2015 Result Announcement Jakarta, 23 October 2015 1 Agenda Hal 1. Company Profile 3 8 2. Operational Performance 9 13 3. Financial Performance 14 20
Analyst Meeting & Presentation 3Q 2012 Result Announcement. Jakarta, 25 October 2012
 Analyst Meeting & Presentation 3Q 2012 Result Announcement Jakarta, 25 October 2012 0 0 Shareholder List as of 30 September 2012 Shareholder List as of 30 September 2012 Number of Shares % Domestic Government
INVESTOR NEWSLETTER. Full Year 2013 Editions. PT Garuda Indonesia (Persero) Tbk. FY 2012 FY 2013 Change. Summary.
 Tbk. FY 2012 FY 2013 Change. Summary.") INVESTOR NEWSLETTER PT Garuda Indonesia (Persero) Tbk. Full Year 2013 Editions FY 2012 FY 2013 Change Financial Summary (USD Mio) OPERATING REVENUES 3,472 3,716 7.02% OPERATING EXPENSES 3,304 3,660 10.75%
INVESTOR NEWSLETTER PT Garuda Indonesia (Persero) Tbk. Full Year 2013 Editions FY 2012 FY 2013 Change Financial Summary (USD Mio) OPERATING REVENUES 3,472 3,716 7.02% OPERATING EXPENSES 3,304 3,660 10.75%
PUBLIC EXPOSE PT Garuda Indonesia (Persero) Tbk Result Announcement. Jakarta, 15 April 2016
 Tbk Result Announcement. Jakarta, 15 April 2016") PUBLIC EXPOSE PT Garuda Indonesia (Persero) Tbk. 2015 Result Announcement Jakarta, 15 April 2016 1 HIGHLIGHTS EBITDAR MARGIN: 32.7% 19% YoY TOTAL REVENUES: US$3.81 billion 3.0% YoY UNSCHEDULED FLIGHT REVENUES
PUBLIC EXPOSE PT Garuda Indonesia (Persero) Tbk. 2015 Result Announcement Jakarta, 15 April 2016 1 HIGHLIGHTS EBITDAR MARGIN: 32.7% 19% YoY TOTAL REVENUES: US$3.81 billion 3.0% YoY UNSCHEDULED FLIGHT REVENUES
ASEAN Conference MACQUARIE Corporate Presentation PT GARUDA INDONESIA (PERSERO) Tbk. 26 August 2015
 Tbk. 26 August 2015") ASEAN Conference MACQUARIE Corporate Presentation PT GARUDA INDONESIA (PERSERO) Tbk. 26 August 2015 1 Agenda Page 1. Company Profile 3 12 2. Operational Performance 13 17 3. Financial Performance 18 24
ASEAN Conference MACQUARIE Corporate Presentation PT GARUDA INDONESIA (PERSERO) Tbk. 26 August 2015 1 Agenda Page 1. Company Profile 3 12 2. Operational Performance 13 17 3. Financial Performance 18 24
Corporate Presentation
 Jakarta, 2 November 2018 Corporate Presentation Q3/2018 - Corporate Performance Shares Information 6,800 GIAA IJ Equity - Last Price (R1) JCI Index - Last Price (L1) 206 5,976.553 450 6,600 6,400 400 6,200
3M 2013 Edition. Share Information : GIAA.IJ / GIAA.JK. Daily Share Price Movements
 3M 2013 Edition 3M 2012 3M 2013 Change Financial Summary (USD Mio) OPERATING REVENUES 717 807 12.51% OPERATING EXPENSES 734 827 12.70% INCOME (LOSS) FROM OPERATIONS (17) (20) 20.68% INCOME (LOSS) BEFORE
Daiwa Investment Conference Corporate Presentation PT GARUDA INDONESIA (PERSERO) Tbk. Hong Kong, 12 November 2015
 Tbk. Hong Kong, 12 November 2015") Daiwa Investment Conference Corporate Presentation PT GARUDA INDONESIA (PERSERO) Tbk. Hong Kong, 12 November 2015 1 Agenda Hal 1. Company Profile 3 12 2. Operational Performance 13 17 3. Financial Performance
Daiwa Investment Conference Corporate Presentation PT GARUDA INDONESIA (PERSERO) Tbk. Hong Kong, 12 November 2015 1 Agenda Hal 1. Company Profile 3 12 2. Operational Performance 13 17 3. Financial Performance
Jakarta, 3 May Analyst Meeting. Q1/ Corporate Performance
 Jakarta, 3 May 2018 Analyst Meeting Q1/2018 - Corporate Performance Shares Information 6,750 GIAA IJ Equity - Last Price (R1) JCI Index - Last Price (L1) 294 6,188.987 600 6,500 6,189 6,250 6,000 550 500
1Q 2014 Edition. Share Information. Daily Share Price Movements
 1Q 2014 Edition 1Q 2013 1Q 2014 Change Financial Summary (USD Mio) OPERATING REVENUES 807 807 0.01% OPERATING EXPENSES 827 1,000 20.86% OTHERS (INCOME) 4 25 460.80% INCOME (LOSS) FROM OPERATIONS -20-193
Passenger: 17.2 Million (+3.9% yoy) OTP: 85.8% SLF: 73.3% Subsidiaries Operating Revenues US$415.2 Million Cargo Carried 219.4K ton (+10.
 OTP: 85.8% SLF: 73.3% Subsidiaries Operating Revenues US$415.2 Million Cargo Carried 219.4K ton (+10.") Value* 14.78 3.36 4.97 Volume** 32.85 9.59 13.43 Last Price 423 342 348 Market Cap.*** 8.74 8.85 9.01 Note: * Average Value in Billion Rupiah ** Average Volume in Million *** Market Capitalization in Trillion
Value* 14.78 3.36 4.97 Volume** 32.85 9.59 13.43 Last Price 423 342 348 Market Cap.*** 8.74 8.85 9.01 Note: * Average Value in Billion Rupiah ** Average Volume in Million *** Market Capitalization in Trillion
Corporate Presentation PT Garuda Indonesia (Persero) Tbk
 Tbk") Corporate Presentation PT Garuda Indonesia (Persero) Tbk Credit Suisse APAC Transportation Corporate Day Hong Kong, 26 June 2013 Delivering Indonesia s Best to the World 0 Agenda 1. Industry Overview 2.
Corporate Presentation PT Garuda Indonesia (Persero) Tbk Credit Suisse APAC Transportation Corporate Day Hong Kong, 26 June 2013 Delivering Indonesia s Best to the World 0 Agenda 1. Industry Overview 2.
Corporate Presentation PT Garuda Indonesia (Persero) Tbk
 Tbk") Corporate Presentation PT Garuda Indonesia (Persero) Tbk JP Morgan s Logistics Ecosystem Forum Singapore, 20-21 May 2013 Delivering Indonesia s Best to the World 0 Agenda 1. Industry Overview 2. Company
Corporate Presentation PT Garuda Indonesia (Persero) Tbk JP Morgan s Logistics Ecosystem Forum Singapore, 20-21 May 2013 Delivering Indonesia s Best to the World 0 Agenda 1. Industry Overview 2. Company
Jakarta, 25 October Analyst Meeting 3Q / 2017
 Jakarta, 25 October 2017 Analyst Meeting 3Q / 2017 Shares Information 6,000 5,901 GIAA IJ Equity - Last Price (R1) JCI Index - Last Price (L1) 334 5,900.854 600 550 5,500 500 5,000 450 4,500 400 350 334
GIAA In Flash YTD September 2015
 GIAA In Flash YTD September 2015 Garuda Indonesia Group (GIAA) Continues its Green Performance in Challenging Market Picture s source: www.google.com The 3rd quater in 2015 is a tough period for GIAA bussines.
CORPORATE PRESENTATION PT Garuda Indonesia (Persero) Tbk. Jakarta, May 2016
 Tbk. Jakarta, May 2016") CORPORATE PRESENTATION PT Garuda Indonesia (Persero) Tbk. Jakarta, May 2016 MANAGEMENT Appointed on AGMS April 15, 2016 SAME AS PREVIOUS NEW MEMBER 2 MANAGEMENT - PROFILE AGUS TONI SOETIRTO PLACE/DATE
CORPORATE PRESENTATION PT Garuda Indonesia (Persero) Tbk. Jakarta, May 2016 MANAGEMENT Appointed on AGMS April 15, 2016 SAME AS PREVIOUS NEW MEMBER 2 MANAGEMENT - PROFILE AGUS TONI SOETIRTO PLACE/DATE
Cebu Air, Inc. 4 th Quarter and Full Year 2017 Results of Operations. cebupacificair.com
 Cebu Air, Inc. 4 th Quarter and Full Year 2017 Results of Operations cebupacificair.com Disclaimer The information provided in this presentation is provided only for your reference. Such information has
Air China Limited Interim Results. August Under IFRS
 Air China Limited 21 Interim Results Under IFRS August 21 1 Agenda 21 Interim Results Overview Business Overview Financial Overview Outlook 2 2 2 21 Interim Results 3 21 Interim Results Overview 4 4 4
Corporate Presentation
 Singapore, 29 January 2018 Corporate Presentation Non-Deal Roadshow with Credit Suisse Shares Information 6,500 6,356 GIAA IJ Equity - Last Price (R1) JCI Index - Last Price (L1) 300 6,355.654 650 6,000
Air China Limited Annual Results. March Under IFRS
 Air China Limited 21 Annual Results Under IFRS March 211 Agenda Part 1 Highlights Part 2 Business Overview Part 3 Financial Overview Part 4 Outlook 2 Part 1 Highlights Steady Economic Growth; Asia Pacific
Jakarta, 26 February Analyst Meeting. FY Corporate Performance
 Jakarta, 26 February 2018 Analyst Meeting FY 2017 - Corporate Performance Shares Information 6,500 6,356 GIAA IJ Equity - Last Price (R1) JCI Index - Last Price (L1) 300 6,355.654 650 6,000 600 550 5,500
PRESS RELEASE. First Half 2017 Financial Results Higher Load Factors and traffic lead to a significant rebound in second quarter profitability
 PRESS RELEASE First Half 2017 Financial Results Higher Load Factors and traffic lead to a significant rebound in second quarter profitability Kifissia, 12 September 2017 AEGEAN announces first half 2017
Part 1 Performance Highlights. Part 2 Business Overview. Part 3 Financial Review
 August 216 1 Part 1 Performance Highlights Part 2 Business Overview Part 3 Financial Review Part 4 Outlook 2 Under IFRS 3 Part 1 Performance Highlights Performance Highlights - Key Operational Metrics
Cebu Air, Inc. 2Q2014 Results of Operation
 Cebu Air, Inc. 2Q2014 Results of Operation 1 Disclaimer This information provided in this presentation is provided only for your reference. Such information has not been independently verified and, as
Cebu Air, Inc. Annual Stockholders Briefing. 24 June cebupacificair.com
 Cebu Air, Inc. Annual Stockholders Briefing 24 June 2015 cebupacificair.com Business Updates Passengers (M) Operating Statistics 2014: Passenger traffic grew 17.5% to 16.9M. Seat capacity grew 14.8% to
J.P. Morgan 2019 Global Emerging Markets Corporate Conference. Miami, February 2019
 J.P. Morgan 2019 Global Emerging Markets Corporate Conference Miami, February 2019 This presentation may include forward-looking comments regarding the Company s business outlook and anticipated financial
PRESS RELEASE Financial Results. Rising passenger traffic at 12.5m Exceeding 1bn in consolidated revenue
 PRESS RELEASE 2016 Financial Results Rising passenger traffic at 12.5m Exceeding 1bn in consolidated revenue Kifissia, 23 March 2017 AEGEAN reports full year 2016 results with consolidated revenue at 1,020m,
Tiger Airways Holdings Limited FY11 Results
 Tiger Airways Holdings Limited FY11 Results May 2011 Financial Year Ended 31 March 2011 Disclaimer The information contained in this presentation (the "Information") is provided by Tiger Airways Holdings
Leaving the Competition Behind. Second Quarter (Apr-Jun) 2009 Results
 2009 Results") Leaving the Competition Behind Second Quarter (Apr-Jun) 2009 Results 12 Aug 2009 1 Disclaimer Information contained in our presentation is intended solely for your reference. Such information is subject
Leaving the Competition Behind Second Quarter (Apr-Jun) 2009 Results 12 Aug 2009 1 Disclaimer Information contained in our presentation is intended solely for your reference. Such information is subject
THAI AIRWAYS INTERNATIONAL PCL
 THAI AIRWAYS INTERNATIONAL PCL 2Q2017 analysts briefing 16-Aug-2017 1 DISCLAIMER The information contained herein is intended to represent the Company s operating and financial position at a given point
Jet Airways (India) Ltd. Presentation on Annual Results FY06. May 2006
 Ltd. Presentation on Annual Results FY06. May 2006") Jet Airways (India) Ltd. Presentation on Annual Results FY06 May 2006 1 Agenda 1. Performance Highlights 2. Sahara Acquisition Update 3. Outlook 2 Performance Highlights 3 Domestic landscape capacity growth
Jet Airways (India) Ltd. Presentation on Annual Results FY06 May 2006 1 Agenda 1. Performance Highlights 2. Sahara Acquisition Update 3. Outlook 2 Performance Highlights 3 Domestic landscape capacity growth
Air China Limited 2014 Annual Results Under IFRS
 Air China Limited 2014 Annual Results Under IFRS March 2015 Agenda Part 1 Results Highlights Part 2 Business Overview Part 3 Financial Overview Part 4 Outlook Part 1 Results Highlights Gradual Global Economic
Finnair Q Result
 17 August 2016 CEO Pekka Vauramo CFO Pekka Vähähyyppä Finnair Q2 2016 Result 1 Highlights of the second quarter The seventh consecutive quarter of profit improvement Fukuoka & Guangzhou route openings
Fourth Quarter and Full Year 2009 Results Presentation January 27, 2010
 Fourth Quarter and Full Year 2009 Results Presentation January 27, 2010 This presentation may include forward-looking comments regarding the Company s business outlook and anticipated financial and operating
JET AIRWAYS (I) LTD. Presentation on Financial Results Q4 FY08
 LTD. Presentation on Financial Results Q4 FY08") JET AIRWAYS (I) LTD Presentation on Financial Results Q4 FY08 June 24, 2008 1 1 1 Agenda Domestic operating environment Jet Airways performance highlights JetLite performance highlights Consolidated Jet
JET AIRWAYS (I) LTD Presentation on Financial Results Q4 FY08 June 24, 2008 1 1 1 Agenda Domestic operating environment Jet Airways performance highlights JetLite performance highlights Consolidated Jet
Analyst and Investor Conference Call Q Ulrik Svensson, CFO and Member of the Executive Board
 Analyst and Investor Conference Call Q2 2017 Ulrik Svensson, CFO and Member of the Executive Board Frankfurt, 2 August 2017 Disclaimer The information herein is based on publicly available information.
Bank of America Merrill Lynch 2018 Emerging Markets Corporate Credit Conference. Miami, May 2018
 Bank of America Merrill Lynch 2018 Emerging Markets Corporate Credit Conference Miami, May 2018 This presentation may include forward-looking comments regarding the Company s business outlook and anticipated
SAS AB Analyst meeting
 SAS AB Analyst meeting London, August 9, 2001 2 2nd Quarter a tough Quarter The Marketplace Continued weak world economy Weaker Swedish economy SAS Weaker traffic growth and reduced passenger load factors
Fourth Quarter and Full Year 2011 Results Presentation. February 1, 2012
 Fourth Quarter and Full Year 2011 Results Presentation February 1, 2012 This presentation may include forward-looking comments regarding the Company s business outlook and anticipated financial and operating
Fourth Quarter 2006 Results Presentation February 15, 2007
 Fourth Quarter 2006 Results Presentation February 15, 2007 This presentation may include forward-looking comments regarding the Company s business outlook and anticipated financial and operating results.
FOURTH QUARTER RESULTS 2017
 FOURTH QUARTER RESULTS 2017 KEY RESULTS In the 4Q17 Interjet total revenues added $5,824.8 million pesos that represented an increase of 10.8% over the revenue generated in the 4Q16. In the 4Q17, operating
JET AIRWAYS (I) LTD. Presentation on Financial Results Q July 24, 2009
 LTD. Presentation on Financial Results Q July 24, 2009") JET AIRWAYS (I) LTD Presentation on Financial Results Q1 2010 July 24, 2009 1 1 1 Agenda Domestic operating environment Jet Airways performance highlights JetLite performance highlights Outlook 2 2 2 Domestic
JET AIRWAYS (I) LTD Presentation on Financial Results Q1 2010 July 24, 2009 1 1 1 Agenda Domestic operating environment Jet Airways performance highlights JetLite performance highlights Outlook 2 2 2 Domestic
2012 Result. Mika Vehviläinen CEO
 2012 Result Mika Vehviläinen CEO 1 Agenda Market environment in Q4 Business performance and strategy execution Outlook Financials 2 Market Environment According to IATA, Global air travel continues to
Jet Airways (India) Ltd. Presentation on Financial Results Q3 FY th January 2008
 Ltd. Presentation on Financial Results Q3 FY th January 2008") Jet Airways (India) Ltd. Presentation on Financial Results Q3 FY08 28 th January 2008 1 1 1 Agenda Performance highlights Q3 FY08 Apr - Dec FY08 Outlook JetLite performance highlights 2 2 2 Performance
Jet Airways (India) Ltd. Presentation on Financial Results Q3 FY08 28 th January 2008 1 1 1 Agenda Performance highlights Q3 FY08 Apr - Dec FY08 Outlook JetLite performance highlights 2 2 2 Performance
JAPAN AIRLINES Co., Ltd. Financial Results 1 st Quarter Mar/2018(FY2017)
") JAPAN AIRLINES Co., Ltd. Financial Results Mar/2018(FY2017) July 31, 2017 Today s Topics P.1 P.2 P.3 P.4 P.6 P.15 Overview of Financial Results for (FY2017) 1 st quarter resulted in an increase in both
JAPAN AIRLINES Co., Ltd. Financial Results Mar/2018(FY2017) July 31, 2017 Today s Topics P.1 P.2 P.3 P.4 P.6 P.15 Overview of Financial Results for (FY2017) 1 st quarter resulted in an increase in both
SAS Group Presentation Carnegie, May 22, 2012 Sture Stölen, Head of IR
 SAS Group Presentation Carnegie, May 22, 2012 Sture Stölen, Head of IR 1 This is the SAS Group 128 destinations 27,2 million passengers 28 new routes to be launched 2012 1,085 daily flights Revenues 2011,
FIRST QUARTER RESULTS 2016
 FIRST QUARTER RESULTS 2016 KEY RESULTS In 1Q16 Interjet total revenues added $3,850.8 million pesos that represented an increase of 21.9% over the income generated in the 1Q15. In 1Q16 total passengers
Financial Results Q3 FY16
 Financial Results Q3 FY16 6 February 2016 Agenda Key performance highlights Jet Airways performance highlights JetLite performance highlights 2 Key highlights Highest ever quarterly and period profit Jet
UBS 14 th Global Emerging Markets Conference. New York, November 2016
 UBS 14 th Global Emerging Markets Conference New York, November 2016 This presentation may include forward-looking comments regarding the Company s business outlook and anticipated financial and operating
Q Fast growth continued, Comparable operating result at record high levels Pekka Vauramo
 2018 Fast growth continued, Comparable operating result at record high levels 17.7.2018 Pekka Vauramo 2 A good - Comparable operating result increased to new seasonal high Revenue Comparable operating
Financial Results 1 st Quarter Mar/2016 (FY2015) 30 July, 2015
 30 July, 2015") Financial Results Mar/2016 (FY2015) 30 July, 2015 Today s Topics P.2 P.3 P.15 1 Overview of FY Mar/2016 Financial Results Operating Revenue Operating Profit 320 307.0 +4.9Bn (+1.6%) 312.0 50 +17.6Bn (+94.6%)
Financial Results Mar/2016 (FY2015) 30 July, 2015 Today s Topics P.2 P.3 P.15 1 Overview of FY Mar/2016 Financial Results Operating Revenue Operating Profit 320 307.0 +4.9Bn (+1.6%) 312.0 50 +17.6Bn (+94.6%)
THIRD QUARTER RESULTS 2017
 THIRD QUARTER RESULTS 2017 KEY RESULTS In the 3Q17 Interjet total revenues added $5,835.1 million pesos that represented an increase of 22.0% over the revenue generated in the 3Q16. In the 3Q17, operating
Corporate presentation CIBC Whistler Institutional Investor Conference January 21, 2010
 Corporate presentation CIBC Whistler Institutional Investor Conference January 21, 2010 Forwardlooking statement Certain information in this presentation and statements made during this presentation, including
Analyst Briefing Quarter 3/2012
 http://www.thaiairways.com/about-thai/investor-relations/en/investor.html THAI AIRWAYS INTERNATIONAL PCL Analyst Briefing Quarter 3/2012 1 Investor Relations Department DISCLAIMER The information contained
THIRD QUARTER AND NINE MONTHS OF 2014 KEY RESULTS
 THIRD QUARTER AND NINE MONTHS OF 2014 KEY RESULTS In 3Q14 INTERJET total revenues were $ 3,643.4 million, representing an increase of 9.9% on revenues generated in the 3Q13. Accumulated 9M14 INTERJET total
THAI AIRWAYS INTERNATIONAL PCL
 THAI AIRWAYS INTERNATIONAL PCL PHATRA SECURITIES PCL Thai Tourism Day July 4, 2013 1 http://www.thaiairways.com/about-thai/investor-relations/en/investor.html DISCLAIMER The information contained herein
STAYING TRUE. BofAML Global Transportation Conference. May
 STAYING TRUE BofAML Global Transportation Conference May 19 2011 FORWARD-LOOKING STATEMENT Certain information in this presentation and statements made during this presentation, including any question
Financial Results 3 rd Quarter MAR/2016 (FY2015)
") Financial Results MAR/2016 (FY2015) January 29 th, 2016 CONTENTS P.1 P.2 P.3 P.4~ Overview of FY MAR/16 Results Operating Revenue Operating Profit 1,030 1,020 1,010 +1.0Bn 1,022.3 1,023.4 (+0.1%) 180 160
Financial Results MAR/2016 (FY2015) January 29 th, 2016 CONTENTS P.1 P.2 P.3 P.4~ Overview of FY MAR/16 Results Operating Revenue Operating Profit 1,030 1,020 1,010 +1.0Bn 1,022.3 1,023.4 (+0.1%) 180 160
JAPAN AIRLINES Co., Ltd. Financial Results 1 st Quarter Mar/2018(FY2017)
") JAPAN AIRLINES Co., Ltd. Financial Results Mar/2018(FY2017) July 31, 2017 Today s Topics P.1 P.2 P.3 P.4~ P.6~ P.15~ Overview of Financial Results for Mar/18 Mar/18 (FY2017) 1 st quarter resulted in an
JAPAN AIRLINES Co., Ltd. Financial Results Mar/2018(FY2017) July 31, 2017 Today s Topics P.1 P.2 P.3 P.4~ P.6~ P.15~ Overview of Financial Results for Mar/18 Mar/18 (FY2017) 1 st quarter resulted in an
1Q13 R sults esentation
 1Q13 Results Presentation 14 May 2013 Disclaimer The presentation is dated the day it is given. The delivery of this presentation shall not, under any circumstances, create any implication that there has
Korean Air Q Financial Results. Jul 28, 2011
 Korean Air 2011 2Q Financial Results Jul 28, 2011 Disclaimer This presentation is for informational purposes only, contains preliminary financial and other information about Korean Air Lines Co., Ltd.
AIR NEW ZEALAND ANNUAL RESULTS ANNUAL RESULTS
 AIR NEW ZEALAND ANNUAL RESULTS 2008 1 HIGHLIGHTS Record operating revenue, up 9% Normalised earnings* $197m Net cash position of $1.3bn Launched direct service to Vancouver and Beijing Award winning product
VERY GOOD RESULTS IN OUR MOST IMPORTANT QUARTER
 VERY GOOD RESULTS IN OUR MOST IMPORTANT QUARTER Q3 EBITDA USD 161.8 million, as compared to USD 155.6 million in the corresponding quarter last year 19% increase in passenger numbers on international flights
THAI AIRWAYS INTERNATIONAL PCL
 THAI AIRWAYS INTERNATIONAL PCL 1-March-2016 1 DISCLAIMER The information contained herein is intended to represent the Company s operating and financial position at a given point in time and may also contain
FIRST QUARTER RESULTS 2017
 FIRST QUARTER RESULTS 2017 KEY RESULTS In the 1Q17 Interjet total revenues added $4,421.5 million pesos that represented an increase of 14.8% over the income generated in the 1Q16. In the 1Q17, operating
Singapore Airlines Group Analyst/Media Briefing HALF YEAR FY RESULTS. 13 November 2013 THE PARENT AIRLINE 1H FY2013/14 RESULTS
 Singapore Airlines Group Analyst/Media Briefing HALF YEAR FY2013-14 14 RESULTS 13 November 2013 THE PARENT AIRLINE 1H FY2013/14 RESULTS THE PARENT AIRLINE COMPANY RESULTS 2Q & 1H FY13/14 2Q/13 $million
ANALYST MEETING 3Q2015
 ANALYST MEETING 3Q2015 November 12, 2015 DISCLAIMER The presentation is dated the day it is given. The delivery of this presentation shall not, under any circumstances, create any implication that there
Copa Holdings Reports Net Income of $49.9 million and EPS of $1.18 for the Second Quarter of 2018
 Copa Holdings Reports Net Income of $49.9 million and EPS of $1.18 for the Second Quarter of 2018 Panama City, Panama --- Aug 8, 2018. Copa Holdings, S.A. (NYSE: CPA), today announced financial results
AirAsia X Berhad First Quarter 2014 Results - Investor and Analyst Briefing -
 AirAsia X Berhad First Quarter 2014 Results - Investor and Analyst Briefing - Disclaimer Information contained in our presentation is intended solely for your reference. Such information is subject to
Cathay Pacific Airways 2011 Analyst Briefing 23 June 2011
 Cathay Pacific Airways 2011 Analyst Briefing 23 June 2011 1 Airline Strategy Grow our international network, expand frequencies and further develop Hong Kong as one of the world s leading aviation hubs
JAPAN AIRLINES Financial Results 2 nd Quarter Mar / 2014 (FY2013)
") JAPAN AIRLINES Financial Results 2 nd Quarter Mar / 2014 (FY2013) Yoshiharu Ueki, President Norikazu Saito, Managing Executive Officer 31 October, 2013 Contents P.2 P.3 P.4 P.6 1 Overview of 2 nd Quarter
JAPAN AIRLINES Financial Results 2 nd Quarter Mar / 2014 (FY2013) Yoshiharu Ueki, President Norikazu Saito, Managing Executive Officer 31 October, 2013 Contents P.2 P.3 P.4 P.6 1 Overview of 2 nd Quarter
Results 2Q17. August 9, 2017
 Results 2Q17 August 9, 2017 2Q17 Highlights Indicators 2Q17 Var. x 2Q16 ASK (BN) 10.4-3.0% Traffic (000) 7,261-1.3% RPK (BN) 8.1 +0.5% Load Factor 77.9% +2.7 p.p. Yield (R$ cents) 23.2 +4.8% Pax Revenue
Cathay Pacific Airways 2012 Analyst Briefing 28 June 2012
 Cathay Pacific Airways 2012 Analyst Briefing 28 June 2012 1 Airline Strategy Grow our international network, expand frequencies and further develop Hong Kong as one of the world s leading aviation hubs
JET AIRWAYS (I) LTD. Presentation on Financial Results Q2 FY10
 LTD. Presentation on Financial Results Q2 FY10") JET AIRWAYS (I) LTD Presentation on Financial Results Q2 FY10 October 27, 2009 1 1 1 Agenda Domestic operating environment Jet Airways performance highlights JetLite performance highlights Outlook 2 2
JET AIRWAYS (I) LTD Presentation on Financial Results Q2 FY10 October 27, 2009 1 1 1 Agenda Domestic operating environment Jet Airways performance highlights JetLite performance highlights Outlook 2 2
Thank you for participating in the financial results for fiscal 2014.
 Thank you for participating in the financial results for fiscal 2014. ANA HOLDINGS strongly believes that safety is the most important principle of our air transportation business. The expansion of slots
NORWEGIAN AIR SHUTTLE ASA QUARTERLY REPORT SECOND QUARTER 2006 [This document is a translation from the original Norwegian version]
![NORWEGIAN AIR SHUTTLE ASA QUARTERLY REPORT SECOND QUARTER 2006 [This document is a translation from the original Norwegian version]](/thumbs/74/71229964.jpg "NORWEGIAN AIR SHUTTLE ASA QUARTERLY REPORT SECOND QUARTER 2006 [This document is a translation from the original Norwegian version]") NORWEGIAN AIR SHUTTLE ASA QUARTERLY REPORT SECOND QUARTER 2006 SECOND QUARTER IN BRIEF had earnings before tax of MNOK 24.8 (20.6) in the second quarter. The operating revenue increased by 44 % this quarter,
NORWEGIAN AIR SHUTTLE ASA QUARTERLY REPORT SECOND QUARTER 2006 SECOND QUARTER IN BRIEF had earnings before tax of MNOK 24.8 (20.6) in the second quarter. The operating revenue increased by 44 % this quarter,
Earnings Report 1 st Quarter 2016 Grupo Viva Aerobus
 Earnings Report 1 st Quarter 2016 Grupo Viva Aerobus Grupo Viva Aerobus announces results for the first quarter of 2016 Mexico City, Mexico, April 29, 2016- Grupo Viva Aerobus S.A. de C.V. ( Grupo Viva
USD thousand Q Q Change % Change 12M 2015
 EBITDA POSITIVE IN FIRST-QUARTER EBITDA positive by USD 1.1 million, as compared to a negative outcome of USD 2.3 million last year Positive impact of low fuel prices on performance 21% increase in passenger
Deutsche Bank 16 th Annual Global Emerging Markets. New York, September 2017
 Deutsche Bank 16 th Annual Global Emerging Markets New York, September 2017 This presentation may include forward-looking comments regarding the Company s business outlook and anticipated financial and
JAPAN AIRLINES Co., Ltd. Financial Results 1 st Quarter Mar/2017(FY2016) July 29, 2016
 July 29, 2016") JAPAN AIRLINES Co., Ltd. Financial Results Mar/2017(FY2016) July 29, 2016 Today s Topics P.1 P.2 P.13 From the first quarter of this fiscal year, figures for Revenue Passengers Carried, ASK, RPK and Load
JAPAN AIRLINES Co., Ltd. Financial Results Mar/2017(FY2016) July 29, 2016 Today s Topics P.1 P.2 P.13 From the first quarter of this fiscal year, figures for Revenue Passengers Carried, ASK, RPK and Load
Gregg Gildemann Market Analysis
 Gregg Gildemann Market Analysis Boeing Commercial Airplanes 20 February 2018 The statements contained herein are based on good faith assumptions are to be used for general information purposes only. These
4Q15 and 2015 Results Presentation. March 30, 2016
 4Q15 and 2015 Results Presentation March 30, 2016 Highlights Paulo Kakinoff CEO Highlights Macro Environment Even more adverse environment for the Brazilian economy, with a GDP drop of 3.8% in 2015 Devaluation
Montie Brewer, President and CEO Joshua Koshy, Executive VP and CFO UBS Transport Conference
 Montie Brewer, President and CEO Joshua Koshy, Executive VP and CFO UBS Transport Conference 1 London, England September 17, 2007 Agenda Strongly positioned international airline Investment proposition
26 October 2017 Icelandair Group Interim Report NET PROFIT USD 101 MILLION IN THIRD QUARTER
 NET PROFIT USD 101 MILLION IN THIRD QUARTER Total income in Q3 up by 10% between years, to USD 536.0 million Passenger revenue higher than expected EBITDA unchanged year on year, at USD 161.1 million Passenger
Investor Relations Department
 THAI AIRWAYS INTERNATIONAL Plc. (Year 2008) 1 Table of Contents 1. The Company 2. Statistical Information 3. Tentative Aircraft Delivery 4. Financial Performance 5. Going Forward 2 1. The Company 3 The
Analyst and Investor Conference Call Q Frankfurt, 25 October 2017
 Analyst and Investor Conference Call Q3 2017 Frankfurt, 25 October 2017 Disclaimer The information herein is based on publicly available information. It has been prepared by the Company solely for use
Finnair Group Interim Report 1 January 30 June 2008
 Finnair Group Interim Report 1 January 30 June 2008 1 08/08/2008 Presentation name / Author Airline industry at a historical turning point Fuel price has a stranglehold on the business Average ticket prices
Analysts and Investors conference call. Q results. 15 May 2013
 Analysts and Investors conference call Q1 2013 results 15 May 2013 Management summary Key messages of Q1 2013 +6% +9% +3.3%p. Q1 2013 operational KPIs are in line with 109.7 116.2 6.5 7.1 82.3 85.6 expectations,
Copa Holdings Reports Net Income of $136.5 million and EPS of $3.22 for the First Quarter of 2018
 Copa Holdings Reports Net Income of $136.5 million and EPS of $3.22 for the First Quarter of 2018 May 9, 2018 PANAMA CITY, May 9, 2018 /PRNewswire/ -- Copa Holdings, S.A. (NYSE: CPA), today announced financial
Part 1 Performance Highlights. Part 2 Business Overview
 August 2017 1 Part 1 Performance Highlights Part 2 Business Overview Part 3 Financial Review Part 4 Outlook 2 Under IFRS 3 Part 1 Performance Highlights Performance Highlights - Key Operational Metrics
ALAFCO Aviation Lease And Finance Co. KSCC
 Information MEMORANDUM ALAFCO Aviation Lease And Finance Co. KSCC Mr. Abulqasim Abdulghaffar Redha Acting Chief Executive Officer The 5th Forum for Listed Companies and Analysts Kuwait 20 May 2013 Why
Analysts Briefing. 18 March Cathay Pacific Airways Limited
 Analysts Briefing 18 March 2015 Cathay Pacific Airways Limited Annual Results 2014 2013 Change Group attributable profit HK$m 3,150 2,620 +20.2% Group turnover HK$m 105,991 100,484 +5.5% Profit margin
H1 RESULTS 2007 Jón Karl Ólafsson, CEO
 H1 RESULTS 2007 Jón Karl Ólafsson, CEO Agenda 01 Highlights 02 Financial results 03 Outlook 04 New organizational chart 05 Q & A H1 Highlights Aggressive fleet growth characterizes H1 results 12 aircraft
Analyst Meeting 1Q/2015
 Analyst Meeting 1Q/2015 DISCLAIMER The presentation is dated the day it is given. The delivery of this presentation shall not, under any circumstances, create any implication that there has been no change
Cathay Pacific Airways Interim Results for the six months ended 30 June 2012
 Cathay Pacific Airways Interim Results for the six months ended 30 June 2012 8 August 2012 1 Interim Result 1H2012 1H2011 Change Group attributable (loss) / profit HK$ million (935) 2,808-133.3% Group
ANA Fact Book All Nippon Airways Co., Ltd. Contents
 All Nippon Airways Co., Ltd. Contents 2 Domestic Passenger Market 4 International Passenger Market 5 Cargo Market 6 Haneda and Narita Airports 7 Global Alliance Statistics 8 Aircraft Specifications 9 Consolidated