US/Europe comparison of ATMrelated operational performance
|
|
|
- Theodore Curtis
- 6 years ago
- Views:
Transcription


1 US/Europe comparison of ATMrelated operational performance Joint study between FAA and PRU January 15, Xavier Fron (Eurocontrol-PRU) Dave Knorr (FAA-ATO)
2 Objective & Scope OBJECTIVES to provide a high-level comparison of operational performance between the US and Europe Air Navigation systems. Initial focus on the development of a set of comparable performance indicators for high level comparisons between countries and world regions. SCOPE Predictability and Efficiency of operations Link to Environment when evaluating additional fuel burn. Continental US airspace (Oceanic and Alaska excluded) States (excluding oceanic areas and the Canary Islands) Focus on data subset (traffic from/to top 34 airports) due to better data quality (OEP airports) and comparability (general aviation). Commercial IFR flights NOT in SCOPE Safety, Cost effectiveness, Capacity Trade-offs and other performance affecting factors (weather, etc.) 2
3 Key characteristics of the two systems Calendar Year 20 Europe[1] USA[2] Difference Geographic Area (million km 2 ) % Number of en-route Air Navigation Service Providers 38 1 Number of Air Traffic Controllers (ATCOs in OPS) % Total staff % Controlled flights (IFR) (million) % Share of General Air Traffic 4% 23% x5.55 Flight hours controlled (million) % Average length of flight (within region) 541 NM 497 NM -8% Nr. of en-route centers % En-route sectors at maximum configuration % Nr. of airports with ATC services [3] -38% Of which are slot controlled > 73 3 Source Eurocontrol FAA/ATO [1] Eurocontrol States plus the Estonia and Latvia, but excluding oceanic areas and Canary Islands. [2] Area, flight hours and center count refers to CONUS only. The term US CONUS refers to the 48 contiguous States located on the North American continent south of the border with Canada, plus the District of Columbia, excluding Alaska, Hawaii and oceanic areas. [3] Total of 503 facilities of which 263 are FAA staffed and 240 contract towers. 3
4 Airspace Density Comparison (CONUS & European Centers) *Note due to Mercator projection, northern areas appear larger Density (flight Hr per Sq.Km) <1 < 2 < 3 < 4 < 5 >= 5 Actual sizes are comparable (USA 10.4 vs Europe 11.5 M km 2 ) Relative density (flight hours per km 2 ) is 1.2 in Europe and 2.4 in US 4
5 Some facts about the main airports in the US and in Europe Main 34 airports in 20 Europe US Difference US vs. Europe Average number of annual movements per airport ( 000) % Average number of annual passengers s per airport (million) % Passengers per movement % Average number of runways per airport % Annual movements per runway ( 000) % Annual passengers per runway (million) % Traffic to/from the main 34 airports represents some 68% of all IFR flights in Europe and 64% in the US. The share of general aviation to/from the main 34 airports is more comparable with 4% in the US and 1.6% in Europe. Average number of runways (+61%) and the number of movements (+59%) are significantly higher in the US; Number of passengers per movement in the US (-19%) are much lower than in Europe. 5
6 Air traffic growth in the US and in Europe (IFR flights) Ind dex (1999 9=100) US Europe Source: / FAA After 2004, number of controlled flights did not increase in the US, and increased approximately +25% in Europe (~4% p.a.). Average values mask contrasted growth rates within the US and Europe 6
7 Average seats per scheduled flight in the US and in Europe 120 IINTRA-European Flights 120 US DOMESTIC Flights (CONUS) ight av vg. seats per fli Scheduled services (Main 34 airports) Scheduled services (OEP 34 airports) Scheduled services (all) Scheduled services (all) Source: FAA/ PRC analysis Average seat size per scheduled flight differs in the two systems with Europe having a higher percentage of flights using Large aircraft than the US. 7
8 On-time performance in the US and in Europe 90% 88% 86% 84% 82% 80% 78% 76% 74% On-time performance compared to schedule (flights to/from the 34 main airports) Europe 90% US 88% 86% 84% 82% 80% 78% 76% 74% Punctuality Arrivals/ departures delayed by less than 15 minutes versus schedule 72% 70% Source: E-CODA 72% 70% Source: ASQP data Departures (<=15min.) Arrivals (<=15min.) Similar il pattern in US and Europe with a comparable level l of arrival on time performance; The gap between departure and arrival punctuality is significant in the US and quasi nil in Europe suggesting differences in flow management strategies 8
9 Airline Scheduling: Evolution of block times Evolution of Scheduled Block Times (flights to/from 34 main airports) 4 Europe 4 US (conus) 3 3 minutes Scheduled block times compared to the long term average at city pair level Jan-0 0 Jan-0 1 Jan-0 2 Jan-0 3 Jan-0 4 Jan-0 5 Jan-0 6 Jan-0 7 Jan-0 8 Jan-0 00 Jan-0 01 Jan-0 02 Jan-0 03 Jan-0 04 Jan-0 05 Jan-0 06 Jan-0 07 Jan-0 Source: FAA/PRU Europe: Block times remain relatively stable (left side) US: In addition to decreasing on time performance (previous slide), there is a clear increase in scheduled block times (right side) Seasonal effects are visible in the US and in Europe (due to wind) 9
10 Predictability: Variability of flight phases Variability of flight phases (flights to/from 34 main airports) US - (80th 20th)/2 EU - (80th 20th)/ minutes Departure time Taxi-out + holding Flight time (cruising Taxi-in + waiting for Arrrival time (compared to + terminal) the gate (compared to schedule) schedule) Gate-to-gate phase Source: FAA/PRC Predictability is measured in from the single flight perspective (i.e. airline view) as the difference between the 80th and the 20th percentile for each flight phase. Arrival predictability is mainly driven by departure predictability. With the exception of taxi-in, variability for all flight phases is higher in the US. 10
11 Efficiency: Trends in the duration of flight phases minutes Trends in the duration of flight phases (flights to/from main 34 airports) 6 DEPARTURE TIMES TX-OUT TIMES 5 AIRBORNE TIMES 4 TX-IN TIMES TOTAL Actual times are compared to the long term average for each city ypair EUROPE -2-3 US Jan-03 Jul-03 Jan-04 Jul-04 Jan-05 Jul-05 Jan-06 Jul-06 Jan-07 Jul-07 Jan- Jul- Jan-03 Jul-03 Jan-04 Jul-04 Jan-05 Jul-05 Jan-06 Jul-06 Jan-07 Jul-07 Jan- Jul- Data Source: CODA/ FAA Europe: performance is driven by departure delays with only very small changes in the gate-to-gate phase. US: in addition to a deterioration of departure times, there is a clear increase in average taxi times and airborne times. 11
12 Schedule Growth Shifts Delays Cha nge in Operations since % 8% 6% 4% 2% 0% -2% -4% -6% -8% -10% -12% Traffic Change OEP Delay ys per Thousand Op perations EWR,JFK,LGA,PHL Delayed Flights Down 9% Compared to 2000 Up 8% Compared to 2000 October-July 12
13 Comparison of operational performance by phase of flight Consistent measures being established in the US and Europe IFR flights To/from Main 34 airports DEPARTURE ANS-related Holding at the Gate (ATFM/ EDCT) Taxi-out GATE-to-GATE En-route Flight Efficiency i In last 100NM Taxi-in IFR flights To/from Main 34 airports Feb 15th 20 0h01-23h nm 40 nm 13
14 Efficiency: ANS-related departure delays DEPARTURE ANS-related Holding at the Gate (ATFM/ EDCT) Taxi-out GATE-to-GATE En-route Flight Efficiency In last 100NM ATFM/EDCT delays are delays taken on the ground at the departure airports (mostly at the gate) Both systems use ground delays programs to manage traffic but to a various extent Mainly used in US in case of severe capacity constraints at the arrival airports Extensively used in Europe to manage both En-route and airport capacity limitation 14
15 Efficiency: ANS-related departure delays DEPARTURE ANS-related Holding at the Gate (ATFM/ EDCT) Taxi-out GATE-to-GATE En-route Flight Efficiency In last 100NM 20 En-route related delays >15 min. (EDCT/ATFM) Airport related delays >15 min. (EDCT/ATFM) delay per delayed flight (min.) delay per flight (min.) % of flights delayed>15 min. delay per delayed flight (min.) delay per flight (min.) % of flights delayed>15 min. IFR flights (M) US % % Europe % % US: En-route delays are much lower per flight, but the delay per delayed flight is significantly higher; Europe: Higher share of flights affected (than US) but with a lower average delay. In the US, ground delays (EDCT) are used when other options such as MIT are not sufficient, whereas, in Europe ground delays (ATFM) are the main ATM tool for balancing demand with capacity 15


16 Additional time in the taxi out phase DEPARTURE ANS-related Holding at the Gate (ATFM/ EDCT) Taxi-out GATE-to-GATE En-route Flight Efficiency In last 100NM Measured as the time from off-block to take-off in excess of an unimpeded d time. Unimpeded time is representative of the time needed to complete an operation in period of low traffic Unimpeded time may not be a realistic reference in period of high traffic Additional time in the taxi-out phase may be due to runway capacity constraints or results from local en-route departure and miles in trails restriction 16
17 Additional time in the taxi out phase DEPARTURE ANS-related Holding at the Gate (ATFM/ EDCT) Taxi-out GATE-to-GATE En-route Flight Efficiency In last 100NM Average additional time in the taxi out phase (Only the first 20 airports are shown) Europe main 34 average (4.3 min.) minute s per departuree London (LHR) Rome (FCO) London (LGW) Paris (CDG) Dublin (DUB) Barcelona (BCN) Istanbul (IST) Amsterdam (AMS) Munich (MUC) Madrid (MAD) Dusseldorf (DUS) Milan (MXP) Zurich (ZRH) London (STN) Manchester (MAN) Copenhagen (CPH) Stuttgart (STR) Vienna (VIE) Geneva (GVA) Warsaw (WAW) US OEP 34 average (6.2 min.) Newark (EWR) New York (JFK) New York (LGA) Atlanta (ATL) Philadelphia (PHL) Charlotte (CLT) Chicago (ORD) Detroit (DTW) Boston (BOS) Las Vegas (LAS) Salt Lake City (SLC) Phoenix (PHX) Minneapolis (MSP) Washington (DCA) Washington (IAD) Memphis (MEM) Cincinnati (CVG) Ft. Lauderdale Houston (IAH) Denver (DEN) Source: FAA/ PRC analysis/ CODA/ CFMU Additional times in the taxi out phase are higher in the US (6.2 min.) than in Europe (4.3 min.) For the US, excess times also include delays due to local en-route departure and miles in trail restrictions.. 17
18 En-route flight Efficiency: Approach DEPARTURE ANS-related Holding at the Gate (ATFM/ EDCT) Taxi-out GATE-to-GATE En-route Flight Efficiency In last 100NM Airport B Actual route (A) G D A Direct Course (D) Direct route extension TMA interface En-route extension Focus on horizontal flight Distance based approach 40 NM Airport A Great Circle (G) Indicator is the difference between the length of the actual trajectory (A) and the Great Circle Distance (G) between the departure and arrival terminal areas. Direct route extension is measured as the difference between the actual route (A) and the direct course between the TMA entry points (D). This difference is an ideal (and unachievable) situation where each aircraft would be alone in the sky and not subject to any constraints (i.e. safety, capacity). 18
19 Flight : Direct Route Extension DEPARTURE ANS-related Holding at the Gate (ATFM/ EDCT) Taxi-out GATE-to-GATE En-route Flight Efficiency In last 100NM En-route exte ension (%) 12% 10% 8% 6% 4% 2% 0% 40% En-route extension flights to/from the main 34 airports (20) TMA interface (D-G)/G Direct route extension (A-D)/G EUR US EUR US EUR US EUR US EUR US EUR US NM NM NM NM NM >1000 NM Great circle distance between 40 NM circles (D40-A40) EUR US TOTAL ts % of flight 30% 20% 10% 0% Direct route extension is approximately 1% lower in the US US: Miles in trail restrictions are passed back from constrained airports Europe: Fragmentation of airspace, location of shared civil/military airspace 19
 Taxi-out")


20 Impact of Military Airspace SW of Frankfurt DEPARTURE ANS-related Holding at the Gate (ATFM/ EDCT) Taxi-out GATE-to-GATE En-route Flight Efficiency In last 100NM Military airspace is a significant driver of excess distance Area southeast of Frankfurt is a major contributor Adjoining French Military airspace further increases problem 20
21 Boston (BOS) to Philadelphia (PHL) Flights DEPARTURE ANS-related Holding at the Gate (ATFM/ EDCT) Taxi-out GATE-to-GATE En-route Flight Efficiency In last 100NM July 2007 Great Circle Distance: 242 nmi Average Excess Distance: 102 nmi Percent Excess Distance over Great Circle: 42.1% Average excess distance per stage: First 40 nmi: 12 nmi 40 to 40 nmi circles: 63 nmi Last 40 nmi: 27 nmi 21


")


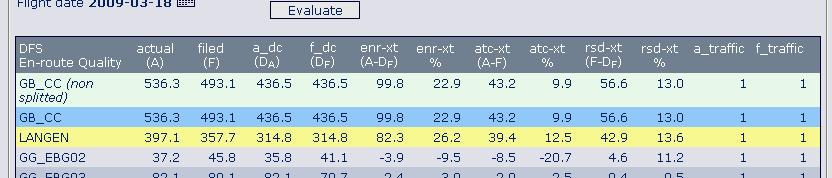
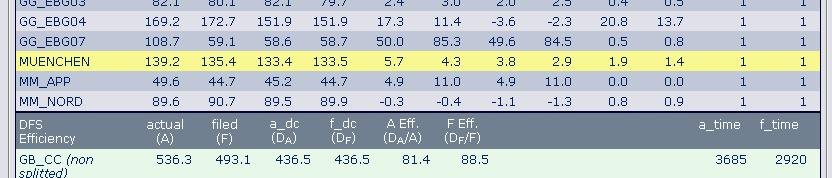
22 IAD to FLL Number of Flights 1488 Direct Flight Indicator Total (A-G) 41.9 Direct Between TMA (A-D) 20.3 TMA Interface (G-D)
 Taxi-out GATE-to-GATE En-route Flight Efficiency In last 100NM Feb 15th 20 0h01-23h59 40 nm")

, irrespective of local strategies.")

23 Efficiency: Additional time in the last 100NM DEPARTURE ANS-related Holding at the Gate (ATFM/ EDCT) Taxi-out GATE-to-GATE En-route Flight Efficiency In last 100NM Feb 15th 20 0h01-23h59 40 nm nm At Frankfurt as much as an extra 15 minutes can be absorbed inside the Terminal Airspace Long Final alternative to holding stacks like in Heathrow Capture tactical arrival control measures (sequencing, flow integration, speed control, spacing, stretching, etc.), irrespective of local strategies. Standard d Arrival Sequencing and Metering Area (ASMA) is defined d as two consecutive rings with a radius of 40NM and 100NM around each airport. In Europe delay absorption at departure airport or around the arrival airport while in the US sequencing can span back to the departure airports (MIT) 23
24 Efficiency: Excess time in the last 100NM Actual Route Arrival Fix Arrival Airport Notional Optimal Route 2.5% x 40 nmi 100 nmi Time based measure Captures type of A/C ARC Entry point and runway configuration Nominal derived from 20th percentile Excess time above nominal for each category 24
25 Additional time within the last 100NM DEPARTURE ANS-related Holding at the Gate (ATFM/ EDCT) Taxi-out GATE-to-GATE En-route Flight Efficiency In last 100NM Average additional time within the last 100NM miles (only the first 20 airports in 20 are shown) Europe main 34 average (2.8 min.) l London (LHR) Frankfurt (FRA) Athens (ATH) Vienna (VIE) Madrid (MAD) Munich (MUC) London (LGW) Zurich (ZRH) Geneva (GVA) Nice (NCE) Rome (FCO) Dusseldorf (DUS) Dublin (DUB) Hamburg (HAM) Barcelona (BCN) Manchester (MAN) Milan (MXP) Paris (ORY) London (STN) Oslo (OSL) minutes per arrival US OEP 34 average (2.9 min.) Philadelphia (PHL) New York (JFK) New York (LGA) Newark (EWR) Charlotte (CLT) Atlanta (ATL) Memphis (MEM) Boston (BOS) Chicago (ORD) Washington (IAD) Baltimore (BWI) Minneapolis (MSP) Chicago (MDW) San Francisco Tampa (TPA) Orlando (MCO) Washington (DCA) Denver (DEN) Seattle (SEA) Phoenix (PHX) minutes per arriva Source: FAA/ PRC analysis Average additional time is similar in Europe (2.8 min.) and the US (2.9 min.) Mainly driven by London Heathrow (LHR) which is clearly an outlier Performance at LHR is consistent with the 10 minute average delay criteria agreed by the airport scheduling committee. 25
26 Estimated benefit pool actionable by ATM (typical flight) The benefit pool represents a theoretical optimum. Safety and capacity constraints limit the practicality of ever fully recovering these inefficiencies The estimated in pool actionable by ANS and associated fuel burn is similar in the US and Europe (estimated to be between 6-8% of the total fuel burn) but with notable differences in the distribution by phase of flight. Inefficiencies have a different impact (fuel burn, time) on airspace users, depending on the phase of flight (airborne vs. ground) and the level of predictability (strategic vs. tactical). 26
27 Continuous Descent Arrival CDA is an arrival procedure designed to eliminate level segments flown below cruise altitude, thus minimizing fuel burn, emissions and noise. Continuous Descent Arrival In a CDA, these level segments would be flown at cruise altitude Standard Arrival 27
28 What ATM can do? ATM can help improving performance by : Maximizing throughput so as to minimize total delay Making the best use of capacity available Optimizing Departure/landing sequences Minimizing the impact of delay Priority between flights Minimizing fuel impact by managing the Phase of Flight where necessary delay is applied But be careful Delaying aircraft on the ground (engine off) is not always more fuel efficient than airborne delays! Continuous descent approach can burn more fuel than interrupted Descent 28
29 Conclusions High value in global comparisons and benchmarking in order to optimise performance and identify best practice; Arrival punctuality is similar in the US and in Europe, albeit with a higher level of variability in the US. The estimated in pool actionable by ANS and associated fuel burn appear to be similar in the US and Europe (estimated to be between 6-8% of the total fuel burn) but with notable differences in the distribution by phase of flight. Inefficiencies have a different impact (fuel burn, time) on airspace users, depending on the phase of flight (airborne vs. ground) and the level of predictability (strategic vs. tactical). Further work is needed to assess the impact of and predictability on airspace users, the utilisation of capacity, and the environment. A more comprehensive comparison of service performance would also need to address Safety, Capacity and other performance affecting factors such as weather and governance. 29
30 Backup 30
31 Impact of altitude on fuel flow Difference in % compared to fuel flow at optimum altitude (in pink) 31


32 Sample Inefficient DFS Routes 32
2010 US/Europe comparison of ATM-related operational performance
 2010 US/Europe comparison of ATM-related operational performance Joint FAA (ATO) and EUROCONTROL (PRC) benchmark reports Hartmut Koelman EUROCONTROL Performance Review Unit 21 May 2013 History In 2003,
8 th USA/Europe Air Traffic Management R&D Seminar. US/Europe comparison of ATM-related operational performance. June 30, 2009 Napa Valley, California
 8 th USA/Europe Air Traffic Management R&D Seminar US/Europe comparison of ATM-related operational performance June 30, 2009 Napa Valley, California Objective & Scope OBJECTIVES Provide a high-level comparison
John Gulding Manager, Strategic Analysis and Benchmarking, FAA. Hartmut Koelman Senior Expert, Performance review Unit, EUROCONTROL
 Global Challenges to Improve Air Navigation Performance February 11 13, 2015, Asilomar Conference Grounds, Pacific Grove, CA Session 5.1 US-European Joint Performance Analysis John Gulding Manager, Strategic
US/ Europe comparison of ATM-related operational performance
 Eighth USA/Europe Air Traffic Management Research and Development Seminar (ATM9) US/ Europe comparison of ATM-related operational performance An initial harmonized assessment by phase of flight John Gulding,
U.S./Europe Comparison of ATM-related Operational Performance
 U.S./Europe Comparison of ATM-related Operational Performance Produced by the Performance Review Commission and the Air Traffic Organization Strategy and Performance Business Unit 2009-AJG-333 BACKGROUND
ACI 2008 WORLDWIDE AIRPORT TRAFFIC STATISTICS
 WORLD AIRPORT RANKING BY TOTAL PASSENGERS TOTAL PASSENGERS 1 ATLANTA GA ATL 90 039 280 0.7 2 CHICAGO IL ORD 69 353 876 ( 9.0) 3 LONDON LHR 67 056 379 ( 1.5) 4 TOKYO HND 66 754 829 ( 0.2) 5 PARIS CDG 60
Comparison of Air Traffic Management-Related Operational Performance: U.S./Europe
 2012 Comparison of Air Traffic Management-Related Operational Performance: U.S./Europe Produced by: EUROCONTROL Performance Review Commission FAA Air Traffic Organization System Operations Services November
TravelWise Travel wisely. Travel safely.
 TravelWise Travel wisely. Travel safely. The (CATSR), at George Mason University (GMU), conducts analysis of the performance of the air transportation system for the DOT, FAA, NASA, airlines, and aviation
Operational Performance Workgroup. John Gulding Manager, Strategic Analysis and Benchmarking, ATO Office of Performance Analysis, FAA
 Operational Performance Workgroup John Gulding Manager, Strategic Analysis and Benchmarking, ATO Office of Performance Analysis, FAA Workgroup Participants and Membership ATNS - Josia Manyakoana (co-lead)
CANSO Workshop on Operational Performance. LATCAR, 2016 John Gulding Manager, ATO Performance Analysis Federal Aviation Administration
 CANSO Workshop on Operational Performance LATCAR, 2016 John Gulding Manager, ATO Performance Analysis Federal Aviation Administration Workshop Contents CANSO Guidance on Key Performance Indicators Software
ATC Global 2014 航空运输业的可持续发展. The Sustainable Development of the Air Transport Industry. Robin Deransy
 The Sustainable Development of the Air Transport Industry 航空运输业的可持续发展 Robin Deransy Senior Expert Environment and Climate Change 17/09/2014 World Airline Route Map June 2009 traffic Source: Wiki-media
Have Descents Really Become More Efficient? Presented by: Dan Howell and Rob Dean Date: 6/29/2017
 Have Descents Really Become More Efficient? Presented by: Dan Howell and Rob Dean Date: 6/29/2017 Outline Introduction Airport Initiative Categories Methodology Results Comparison with NextGen Performance
ATRS Global Airport Performance Benchmarking Report, 2003
 ATRS Global Airport Performance Benchmarking Report, 2003 Tae H. Oum UBC and Air Transport Research Society www.atrsworld.org presented at NEXTOR Conference Tuesday, January 27 Friday, January 30, 2004
Rankings of Major U.S. Airports. Total Passengers 2016
 Rankings of Major U.S. Airports Total Passengers Total Passengers (Millions) 1 Hartsfield Atlanta Int'l (ATL) Atlanta 104.2 2.6 2 Los Angeles Int'l (LAX) Los Angeles 80.9 8.0 3 O'Hare Int'l (ORD) Chicago
ATRS Global Airport Benchmarking Report 2003
 ATRS Global Airport Benchmarking Report 2003 Presented to Pacific Economic Cooperation Council (PECC) Conference, 5-6 September, 2003, Singapore The Global Airport Benchmarking Task Force of Air Transport
Free Flight En Route Metrics. Mike Bennett The CNA Corporation
 Free Flight En Route Metrics Mike Bennett The CNA Corporation The Free Flight Metrics Team FAA Dave Knorr, Ed Meyer, Antoine Charles, Esther Hernandez, Ed Jennings CNA Corporation Joe Post, Mike Bennett,
World Class Airport For A World Class City
 World Class Airport For A World Class City Air Service Update April 2018 2018 Air Service Updates February 2018 Seattle new departure, seasonal, 2x weekly Boston new departure, seasonal, 2x weekly March
World Class Airport For A World Class City
 World Class Airport For A World Class City Air Service Update April 2017 2017 Air Service Updates February 2017 Cleveland new destination, 2x weekly Raleigh-Durham new destination, 2x weekly March 2017
World Class Airport For A World Class City
 World Class Airport For A World Class City Air Service Update December 2018 2018 Air Service Updates February 2018 Delta Air Lines Seattle new departure, seasonal, 2x weekly Delta Air Lines Boston new
FAA Progress on Wake Avoidance Solutions for Closely Spaced Parallel Runways (CSPR)
") FAA Progress on Wake Avoidance Solutions for Closely Spaced Parallel Runways (CSPR) WakeNet-Europe Workshop 2015 April 2015 Amsterdam, The National Aerospace Laboratory (NLR) Tittsworth (FAA Air Traffic
FAA Progress on Wake Avoidance Solutions for Closely Spaced Parallel Runways (CSPR) WakeNet-Europe Workshop 2015 April 2015 Amsterdam, The National Aerospace Laboratory (NLR) Tittsworth (FAA Air Traffic
Rankings of Major U.S. Airports. Total Passengers 2017
 Rankings of Major U.S. Airports Total Passengers Total Passengers (Millions) 1 Hartsfield Atlanta Int'l (ATL) Atlanta 103.9-0.3 2 Los Angeles Int'l (LAX) Los Angeles 84.6 4.5 3 O'Hare Int'l (ORD) Chicago
World Class Airport For A World Class City
 World Class Airport For A World Class City Air Service Update October 2017 2017 Air Service Updates February 2017 Cleveland new destination, 2x weekly Raleigh-Durham new destination, 2x weekly March 2017
Temporal Deviations from Flight Plans:
 Temporal Deviations from Flight Plans: New Perspectives on En Route and Terminal Airspace Professor Tom Willemain Dr. Natasha Yakovchuk Department of Decision Sciences & Engineering Systems Rensselaer
CONCESSIONS FUTURE OPPORTUNITIES
 CONCESSIONS FUTURE OPPORTUNITIES MARCH 14 & 15, 2019 COLORADO S STRONG ECONOMY 2 ABOVE AVERAGE GROWTH 3 19 FORTUNE 1000 COMPANIES Fortune 1000 Companies & Major Relocations and Expansions into Metropolitan
Efficiency and Automation
 Efficiency and Automation Towards higher levels of automation in Air Traffic Management HALA! Summer School Cursos de Verano Politécnica de Madrid La Granja, July 2011 Guest Lecturer: Rosa Arnaldo Universidad
2016 Air Service Updates
 Air Service Update September 2016 2016 Air Service Updates February 2016 Pittsburgh new destination, 2x weekly April 2016 Los Angeles new departure, 1x daily Atlanta new departure, 1x daily Jacksonville
Capacity Constraints and the Dynamics of Transition in the US Air Transportation
 MIT ICAT Capacity Constraints and the Dynamics of Transition in the US Air Transportation Prof. R. John Hansman Alexandra Mozdzanowska, Philippe Bonnefoy MIT Department of Aeronautics and Astronautics
Atlantic Interoperability Initiative to Reduce Emissions AIRE
 ICAO Colloquium on Aviation and Climate Change ICAO ICAO Colloquium Colloquium on Aviation Aviation and and Climate Climate Change Change Atlantic Interoperability Initiative to Reduce Emissions AIRE Célia
2016 Air Service Updates
 Air Service Update May 2016 2016 Air Service Updates February 2016 Pittsburgh new destination, 2x weekly April 2016 Los Angeles new departure, 1x daily Atlanta new departure, 1x daily Jacksonville new
ENVIRONMENTAL BENEFITS FROM IMPROVED OPERATIONAL MEASURES. Guido Kerkhofs Director ATM Programmes EUROCONTROL
 ENVIRONMENTAL BENEFITS FROM IMPROVED OPERATIONAL MEASURES Guido Kerkhofs Director ATM Programmes EUROCONTROL EUROCONTROL Air Traffic Emissions Estimates EU 27 States 2004-2006 Tonnes of CO 2 Drop Page
Passengers Boarded At The Top 50 U. S. Airports ( Updated April 2
 (Ranked By Passenger Enplanements in 2006) Airport Table 1-41: Passengers Boarded at the Top 50 U.S. Airportsa Atlanta, GA (Hartsfield-Jackson Atlanta International) Chicago, IL (Chicago O'Hare International)
ATM in Europe It s all about Performance
 ATM in Europe It s all about Performance Facts and analysis from Performance Review World ATM Congress 2014, Madrid Xavier FRON Performance coordinator 5 March 2014 Topics ANS in aviation context European
2016 Air Service Updates
 Air Service Update June 2016 2016 Air Service Updates February 2016 Pittsburgh new destination, 2x weekly April 2016 Los Angeles new departure, 1x daily Atlanta new departure, 1x daily Jacksonville new
Impact of Advance Purchase and Length-of-Stay on Average Ticket Prices in Top Business Destinations
 Impact of Advance Purchase and Length-of-Stay on Average Ticket Prices in Top Business Destinations Research Summary Average ticket prices continue to trend downward in 2016, but since 2014 there have
Economics of International Airline Joint Ventures. Bryan Keating Georgetown Airline Competition Conference July 17, 2017
 Economics of International Airline Joint Ventures Bryan Keating Georgetown Airline Competition Conference July 17, 2017 International Airline Joint Ventures Connect Complementary Networks No individual
Airports Council International
 Airports Council International HOW SECURITY CONTRIBUTES TO THE ECONOMIC COMPETITIVENESS OF THE AIR CARGO INDUSTRY 16APRIL 2014 Michael Rossell Director ICAO Relations ACI World 1 Mission ACI promotes the
2016 Air Service Updates
 2016 Air Service Updates February 2016 Pittsburgh new destination, 2x weekly April 2016 Los Angeles new departure, 1x daily Atlanta new departure, 1x daily Jacksonville new destination, 2x weekly Philadelphia
Benefits Analysis of a Runway Balancing Decision-Support Tool
 Benefits Analysis of a Runway Balancing Decision-Support Tool Adan Vela 27 October 2015 Sponsor: Mike Huffman, FAA Terminal Flight Data Manager (TFDM) Distribution Statement A. Approved for public release;
Uncertainty in Airport Planning Prof. Richard de Neufville
 Uncertainty in Airport Planning Prof. Richard de Neufville Istanbul Technical University Air Transportation Management M.Sc. Program Airport Planning and Airport Planning and Management Module 06 January
Efficiency and Environment KPAs
 Efficiency and Environment KPAs Regional Performance Framework Workshop, Bishkek, Kyrgyzstan, 21 23 May 2013 ICAO European and North Atlantic Office 20 May 2013 Page 1 Efficiency (Doc 9854) Doc 9854 Appendix
Follow up to the implementation of safety and air navigation regional priorities XMAN: A CONCEPT TAKING ADVANTAGE OF ATFCM CROSS-BORDER EXCHANGES
 RAAC/15-WP/28 International Civil Aviation Organization 04/12/17 ICAO South American Regional Office Fifteenth Meeting of the Civil Aviation Authorities of the SAM Region (RAAC/15) (Asuncion, Paraguay,
SEPTEMBER 2014 BOARD INFORMATION PACKAGE
 SEPTEMBER 2014 BOARD INFORMATION PACKAGE MEMORANDUM TO: Members of the Airport Authority FROM: Lew Bleiweis, Executive Director DATE: September 19, 2014 Informational Reports: A. July, 2014 Traffic Report
Airport Characteristics. Airport Characteristics
 Airport Characteristics Amedeo R. Odoni September 5, 2002 Airport Characteristics Objective To provide background and an overview on the diversity of airport characteristics Topics Discussion of geometric
Development of Flight Inefficiency Metrics for Environmental Performance Assessment of ATM
 Development of Flight Inefficiency Metrics for Environmental Performance Assessment of ATM Tom G. Reynolds 8 th USA/Europe Air Traffic Management Research and Development Seminar Napa, California, 29 June-2
Megahubs United States Index 2018
 Published: Sep 2018 Megahubs United States Index 2018 The Most Connected Airports in the US 2018 OAG Aviation Worldwide Limited. All rights reserved About OAG Megahubs US Index 2018 Published alongside
Airports Council International, Geneva, Switzerland Airports Council International, European Region, Brussels
 Source: Airports Council International, Geneva, Switzerland Airports Council International, European Region, Brussels 1 2 3 4 5 6 7 8 9 10 11 12 13 14 15 16 17 18 19 20 21 22 23 24 25 26 Airports London
European Idle Network Capacity An Assessment of Capacity, Demand and Delay at 33 congested Airports
 European Idle Network Capacity An Assessment of Capacity, Demand and Delay at 33 congested Airports GAP pre-infraday Workshop Branko Bubalo Berlin October 9 th, 2009 Graduate of Berlin School of Economics
Predictability in Air Traffic Management
 Predictability in Air Traffic Management Mark Hansen, Yi Liu, Lu Hao, Lei Kang, UC Berkeley Mike Ball, Dave Lovell, U MD Bo Zou, U IL Chicago Megan Ryerson, U Penn FAA NEXTOR Symposium 5/28/15 1 Outline
Aviation Gridlock: Airport Capacity Infrastructure How Do We Expand Airfields?
 Aviation Gridlock: Airport Capacity Infrastructure How Do We Expand Airfields? By John Boatright Vice President - Delta Air Lines Properties and Facilities Issue What can be done to expand airfield capacity?
5 th Airline Marketing Workshop. Zoom in 2004 Zoom out 2005
 5 th Airline Marketing Workshop Zoom in 2004 Zoom out 2005 Key Market Developments & Prospects What we will discuss: 2004: a year of records Passengers Travelling Patterns What will the future bring? Key
AGENCY: U.S. Customs and Border Protection; Department of Homeland Security.
 This document is scheduled to be published in the Federal Register on 06/25/2013 and available online at http://federalregister.gov/a/2013-15087, and on FDsys.gov 9111-14 DEPARTMENT OF HOMELAND SECURITY
Privatization, Commercialization, Ownership Forms and their Effects on Airport Performance
 Privatization, Commercialization, Ownership Forms and their Effects on Airport Performance Tae H. Oum and Chunyan Yu The Air Transport Research Society, and Sauder School of Business University of British
Federal Perspectives on Public-Private Partnerships (P3) in the United States
 in the United States") Federal Perspectives on Public-Private Partnerships (P3) in the United States Prepared for: ACI-World Bank Symposium London, United Kingdom Presented by: Elliott Black Director Office of Airport Planning
Federal Perspectives on Public-Private Partnerships (P3) in the United States Prepared for: ACI-World Bank Symposium London, United Kingdom Presented by: Elliott Black Director Office of Airport Planning
Athens International Airport. The 2007 market performance
 Athens International Airport The 2007 market performance Great overall performance 70 Airlines 15 New Aer Lingus Air Baltic Air China Carpatair Centralwings Clickair Continental Airlines Finnair Ilyich-Avia
Puget Sound Trends. Executive Board January 24, 2019
 Puget Sound Trends Executive Board January 24, 2019 Overview Topics covered in today s presentation: How many jobs are there? Housing Trends Where do people work? How long does it take to get to work?
November Air Traffic Statistics. Prepared by the Office of Corporate Risk and Strategy
 November 214 Air Traffic Statistics Prepared by the Office of Corporate Risk and Strategy Air Traffic Statistics Table of Contents Summary Air Traffic Summary... 1 SH&E Air Traffic Schedule Activity...
Brussels Airport Airline Issues & Route Development Breakout session 18 June
 Brussels Airport Airline Issues & Route Development Breakout session 18 June Léon Verhallen, Head of Aviation Marketing Geert Van Dessel, manager Aviation Marketing Brussels Airport: The Heart of Europe
Intra-European Seat Capacity. January February March April May June July August September October November December. Intra-European Sectors Flown
 ASK's (Million) Sectors Departing Seats 80,000,000 Intra-European Seat Capacity 70,000,000 60,000,000 50,000,000 40,000,000 30,000,000 20,000,000 10,000,000 0 January February March April May June July
Different views on Performance
 Different views on Performance Benchmarking EU / US Inter FAB Communication Workshop Langen, June 7th/8th, 2017 Dr. Matthias Whittome The view on ATM is a political one. Currently the costs of providing
The O Hare Effect on the System
 The O Hare Effect on the System Diane Boone and Joseph Hollenberg The MITRE Corporation s Center for Advanced Aviation System Development with the Federal Aviation Administration s Managers of Tactical
The Anatomy of Delays:
 The Anatomy of Delays: Complexity and Interconnectivity of NAS Traffic Flow Agam N. Sinha Diane E. Boone 16 February 2001 Topics Background Three scenarios from actual operations in June 2000 A. Widespread
Growing Size and Complexity Prof. Amedeo Odoni
 Growing Size and Complexity Prof. Amedeo Odoni Istanbul Technical University Air Transportation Management M.Sc. Program Airport Planning and Management Module 3 January 2016 Growing Size and Complexity
2012 Airfares CA Out-of-State City Pairs -
 2012 Airfares Out-of-State City Pairs - Contracted rates are from July 1, 2012 through June 30, 2013. Please note all fares are designated as () and ( ) in airline computer reservation systems. fares are
Preliminary World Airport Traffic 2009
 Preliminary World Airport Traffic 2009 Passenger traffic down by 2.7%; cargo down by 8.2 % Geneva, 17 March 2010 ACI reports preliminary results of a 2.7 decline in global passenger traffic for 2009, reflecting
air traffic statistics
 October 213 air traffic statistics Prepared by the Office of Finance Department of Internal Controls, Compliance and Financial Strategy Metropolitan Washington Airports Authority Air Traffic Statistics
Vanderbilt Travel January 2019 Airfare Price Testing Testing Session, January 14, 9:30am 10:30am
 Feb 28 Feb 13, 4:50pm Feb 7, 12:05pm Feb 26, 1:18pm Date / Time 2:35pm/5:35pm/10:55pm Feb 8, 10:40pm / 1:20pm City Pair New York (LGA) Denver (DEN) Washington (DCA) Abuja (ABV) Abu Dhabi (AUH) Southwest
Description of the National Airspace System
 Description of the National Airspace System Dr. Antonio Trani and Julio Roa Department of Civil and Environmental Engineering Virginia Tech What is the National Airspace System (NAS)? A very complex system
A Methodology for Environmental and Energy Assessment of Operational Improvements
 A Methodology for Environmental and Energy Assessment of Operational Improvements Presented at: Eleventh USA/Europe Air Traffic Management Research and Development Seminar (ATM2015 ) 23-26 June 2015, Lisbon,
Brian Ryks Executive Director and CEO
 Brian Ryks Executive Director and CEO MAC Commissioners MAC Finances 2016 Budgeted Operating Revenues Utilities and Other 5% Airline Rates and Charges 34% Rents and Fees 14% Concessions 47% 2016 Budgeted
Preliminary World Airport Traffic 2008 Passenger traffic growth flat; Cargo down by 3.6 percent
 Preliminary World Airport Traffic 2008 Passenger traffic growth flat; Cargo down by 3.6 Geneva, 17 March 2009 Strong traffic results early in 2008 helped save the overall averages for the year, as seen
Linking airports with European ATM
 Linking airports with European ATM Christian Faber ATFCM Expert - DNM Network Operations EUROCONTROL The European Organisation for the Safety of Air Navigation Overview Regulatory Framework ATM in Europe,
System Oriented Runway Management: A Research Update
 National Aeronautics and Space Administration System Oriented Runway Management: A Research Update Gary W. Lohr gary.lohr@nasa.gov Senior Research Engineer NASA-Langley Research Center ATM 2011 Ninth USA/EUROPE
EUROCONTROL. Eric MIART Manager - Airport Operations Programme (APR)
") Traffic Forecast for 20 Years Resulting Challenges for Airports Potential Solutions AIRNETH, The Hague 12 th of April 2007 EUROCONTROL Eric MIART Manager - Airport Operations Programme (APR) www.eurocontrol.int/airports
Traffic Forecast for 20 Years Resulting Challenges for Airports Potential Solutions AIRNETH, The Hague 12 th of April 2007 EUROCONTROL Eric MIART Manager - Airport Operations Programme (APR) www.eurocontrol.int/airports
2011 AIRPORT UPDATE. March 25, 2011
 2011 AIRPORT UPDATE March 25, 2011 1 Airports are important economic engines for the regions they serve; creating jobs, facilitating commerce and providing access to the global marketplace 2 AIRPORT HIGHLIGHTS
Optimized Profile Descents A.K.A. CDA A New Concept RTCA Airspace Working Group
 Optimized Profile Descents A.K.A. CDA A New Concept RTCA Presented to Environmental Working Group December 05, 2007 Outline RTCA Charter and Terms of Reference Objectives Membership and Organization Activities
Modelling Airline Network Routing and Scheduling under Airport Capacity Constraints
 Modelling Airline Network Routing and Scheduling under Airport Capacity Constraints Antony D. Evans Andreas Schäfer Lynnette Dray 8 th AIAA Aviation Technology, Integration, and Operations Conference /
Established and Emerging Hubs in the last Decade
 Established and Emerging Hubs in the last Decade Leading Hubs Today Emerged Hubs in the last decade Which type of markets? Where is the economic potential for hubs? Presentation at the 6 th Annual Airneth
Yasmine El Alj & Amedeo Odoni Massachusetts Institute of Technology International Center for Air Transportation
 Estimating the True Extent of Air Traffic Delays Yasmine El Alj & Amedeo Odoni Massachusetts Institute of Technology International Center for Air Transportation Motivation Goal: assess congestion-related
Supportable Capacity
 Supportable Capacity Objective Understand Network Planning and Capacity Management How the game is played How fleet impacts the playing field Why it is flawed 2 Route Economic Fundamentals Airlines compete
Approximate Network Delays Model
 Approximate Network Delays Model Nikolas Pyrgiotis International Center for Air Transportation, MIT Research Supervisor: Prof Amedeo Odoni Jan 26, 2008 ICAT, MIT 1 Introduction Layout 1 Motivation and
Have Descents really become more Efficient?
 Twelfth USA/Europe Air Traffic Management Research and Development Seminar (ATM2017) Have Descents really become more Efficient? Trends in Potential Time and Fuel Savings in the Descent Phase of Flight
Required Navigation Performance (RNP) in the United States
 in the United States") Required Navigation Performance (RNP) in the United States Overview FAA Roadmap for Performance-Based Navigation Moving to Performance-Based Navigation (RNAV and RNP) Definitions Operational attributes
Required Navigation Performance (RNP) in the United States Overview FAA Roadmap for Performance-Based Navigation Moving to Performance-Based Navigation (RNAV and RNP) Definitions Operational attributes
Preliminary World Airport Traffic 2010 Passenger traffic up 6.3%; Cargo up 15.2%
 Preliminary World Airport Traffic 21 Passenger traffic up 6.3%; Cargo up 1.2% Montreal, 1 March 211 ACI preliminary traffic results, based on reports from over 9 airports worldwide, indicate that global
79006 AIR TRAVEL SERVICES 2001 AWARD
 Group 79006 AIR TRAVEL SERVICES 2001 AWARD Page 6 Office of General Services - Procurement Services Group Delta Air Lines Albany, NY - Albuquerque, NM ALB - ABQ 901.00 313.00 293.00 420 Delta Air Lines
air traffic statistics
 December 213 air traffic statistics Prepared by the Office of Finance Department of Internal Controls, Compliance and Financial Strategy Commercial Total Dom Int'l Passengers % Change Air Traffic Summary
Trends Shaping Houston Airports
 Trends Shaping Houston Airports Ian Wadsworth Chief Commercial Officer April 2014 Our mission is to connect Houston with the world Connect the people, businesses, cultures and economies of the world to
Airline Operations A Return to Previous Levels?
 Airline Operations A Return to Previous Levels? Prof. R John Hansman, Director MIT International Center for Air Transportation rjhans@mit.edu Impact of Sept on Demand Schedule Cutbacks -2% Currently about
3 Aviation Demand Forecast
 3 Aviation Demand 17 s of aviation demand were prepared in support of the Master Plan for Harrisburg International Airport (the Airport or HIA), including forecasts of enplaned passengers, air cargo, based
Distance to Jacksonville from Select Cities
 Distance to Jacksonville from Select Cities Source: Mapquest.com, Expedia.com, ManagementReporting.com City Miles Driving Time (Hrs) Atlanta, GA 347 5.75 1 Boston, MA 1,160 18.5 4 Chicago, IL 1,063 17.5
PITTSBURGH INTERNATIONAL AIRPORT ANALYSIS OF SCHEDULED AIRLINE TRAFFIC. October 2016
 ANALYSIS OF SCHEDULED AIRLINE TRAFFIC October 2016 Passenger volume Pittsburgh International Airport enplaned passengers totaled 379,979 for the month of October 2016, a 7.0% increase from the previous
Air Travel travel Insights insights from Routehappy
 US & International international inflight Inflight Wi- Fi wi- fi Air Travel travel Insights insights from Routehappy Overview: Flyers find more Wi- Fi than ever before Flyers want to get online, and expect
Airport Surface Detection. ASDE-X and Data Distribution System Overview. Presented to the Tarmac. Federal Aviation Administration
 Airport Surface Detection Equipment, Model X ASDE-X and Data Distribution System Overview Presented to the Tarmac Delay National Task Force Presented by: Scott Schlegel, ASDE-X Project Lead Date: ASDE-X
Appendix B Ultimate Airport Capacity and Delay Simulation Modeling Analysis
 Appendix B ULTIMATE AIRPORT CAPACITY & DELAY SIMULATION MODELING ANALYSIS B TABLE OF CONTENTS EXHIBITS TABLES B.1 Introduction... 1 B.2 Simulation Modeling Assumption and Methodology... 4 B.2.1 Runway
Infrastructure constraints in Europe
 LOT Polish Airlines Keynote CEO Presentation 5-6 June, 2018 Infrastructure constraints in Europe Rafał Milczarski CEO of LOT Polish Airlines Sydney, June 06, 2018 THE BUSSIEST EUROPEAN AIRPORTS DO NOT
Fuel Burn Impacts of Taxi-out Delay and their Implications for Gate-hold Benefits
 Fuel Burn Impacts of Taxi-out Delay and their Implications for Gate-hold Benefits Megan S. Ryerson, Ph.D. Assistant Professor Department of City and Regional Planning Department of Electrical and Systems
Press release. For immediate release 10 September European airport passenger traffic up 8.3% in July
 Press release ACI EUROPE 6 square de Meeûs 1000 Brussels, Belgium www.aci-europe.org For immediate release 10 September European airport passenger traffic up 8.3 in ACI EUROPE Airport Traffic Report -
Uncertainty in Airport Planning Prof. Richard de Neufville
 Uncertainty in Airport Planning Prof. Richard de Neufville Istanbul Technical University Air Transportation Management M.Sc. Program Airport Planning and Management / RdN Airport Planning and Management
OAG s Top 25 US underserved routes. connecting the world of travel
 OAG s Top 25 US underserved routes connecting the world of travel Underserved Uncovered: OAG s Top 50 underserved international routes Contents About OAG s underserved uncovered 3 About the data 3 OAG
Automated Integration of Arrival and Departure Schedules
 Automated Integration of Arrival and Departure Schedules Topics Concept Overview Benefits Exploration Research Prototype HITL Simulation 1 Lessons Learned Prototype Refinement HITL Simulation 2 Summary
WH Smith PLC Acquisition of InMotion providing access to the world s largest travel retail market 30 October 2018
 WH Smith PLC Acquisition of InMotion providing access to the world s largest travel retail market 30 October 2018 Transaction highlights WH Smith announces acquisition of InMotion for $198m ( 155 million)