Zodiac Aerospace FY 2012/2013 Results presentation. November 20, 2013
|
|
|
- Sheila Reeves
- 6 years ago
- Views:
Transcription

1 Zodiac Aerospace FY 2012/2013 Results presentation November 20, 2013
2 Summary Another year of organic growth Dissymmetry of margin between H1 and H2 Pursuing the External Growth Strategy A new financing for the Group A buoyant market Increase in trafic Innovation and commercial successes Page 2
3 FY 2012/2013 Highlights Page 3
 3440.6 Sales + 13.1% 3891.")

 2011/12 2012/13 * Excluding IFRS3 impact Sales")

4 Another year of growth (In million) Sales % / /13 (In million) Current Operating Income* % % % 2011/ /13 Net Earnings % (In million) 2011/ /13 * Excluding IFRS3 impact Sales breakdown *net financial debt/ equity vs /12 Aircraft Interiors Galleys & Equipment 13% Cabin & Structures 17% Aerosafety 15% 57% Aircraft * Based on trade WCR Systems 28% Seats 27% vs. 29.4%* 2011/12 Page 4
5 14 consecutive quarters of growth +40% 2010/ % +17.3% organic 2011/ % +14.4% organic +30% +20% 2009/ % -1.0% organic 2012/ % +7.3% organic +10% +0% T1 T2 T3 T4 T1 T2 T3 T4 T1 T2 T3 T4 T1 T2 T3 T4-10% Reported Organic -20% 2009/ / / /2013 /$ transaction Page 5

6 A dissymmetrical profile for the year Weaker margin in H1 13% vs. 14.3% in H1 2011/2012 Impact in H1 of the decrease in regional aviation, integration of the UK seats business In million Catch up in H2 Recovery of Zodiac Seats UK operations Improvement in AeroSafety All in all, COI* margin is 14.5% in 2012/ % 15.8% 14.3% 13.0% 14.1% 14.2% H1 H2 FY 2011/ /2013 Page 6 * Excluding IFRS3 impact


7 6 acquisitions since December, 2012 Zodiac Aerospace is growing in «Passenger Centric» IFE thanks to the acquisition of IMS NAT reinforces Zodiac Aerospace s offer for cabin retrofit Acquisition of IPS: Zodiac Aerospace enhances its world leadership in power management Zodiac Aerospace complements its expertise in the field of Fluid Management Systems Acquisition of La Jonchère, a French company dedicated to ducts and flexible joints Equipping numerous engines for the commercial aircraft industry and benifitting from a patented technology Acquisition of the Engineering department of ThreeSixty Aerospace Threesixty Aerospace is a whollyowned subsidiary of Virgin Atlantic Airways engaged in the conception, design and manufacture of the seats of the said airline. And Beginning of September, 2013: Acquisition of TriaGnoSys Zodiac Aerospace complete his position in the field of IFE thanks to the acquisition of TriaGnoSys, the German based company specializing in inflight connectivity and wireless entertainment and cabin systems. Page 7

 Fuel Cell A350XWB first flight (June) CS100 first flight (Sept.) B787-9 first flight (Sept.) Launch of F5X (Oct.")
8 Evolving in a buoyant environment Traffic is experiencing a sustained growth Civilian aircraft deliveries are increasing Current programs sustain a high production rate New program developping Boeing 787 production is ramping up Airbus A350XWB and Bombardier CSeries are pursuing their flight tests Good level of aftermarket Innovating at Zodiac Aerospace Zodiac Seats has renewed its range of products The ISIS cabin retrofit concept is gaining interest from airlines Aircraft Systems is investing in R&T programs SAFUEL: Safer Fuel Systems, including inerting GENOME: Optimized management of energy (electrical) Fuel Cell A350XWB first flight (June) CS100 first flight (Sept.) B787-9 first flight (Sept.) Launch of F5X (Oct.) Page 8
9 Dividend to increase In per share The supervisory board will propose the distribution of a 1.60 dividend per share at the General Sharholders meeting on January 8, / / / / / /2013 Page 9
 CAC 40 (index) 5 years ZC share price evolution")
10 Stock split The board will propose a fivefor-one split of the share at the General Shareholder s meeting No impact on the market cap. In order to make the stock more liquid and more accessible to all shareholders 5 years ZC share price evolution vs CAC40 Zodiac Aerospace (index) CAC 40 (index) 5 years ZC share price evolution Current Market Cap. 6.8bn Based on closing price on 19 Nov Current Nb of Shares: 57,431,022 New Nb of Shares: 287,155,110 Zodiac Aerospace (close price) Page 10
11 FY2012/2013 Financial performance Page 11
12 Financial highlights ( million) 2012/ /2012 % change Sales revenue 3, , % Current operating income before IFRS3 impact % COI before IFRS 3/ sales revenue 14.5% 14.2% Current operating income % COI/REV 14.5% 14.1% Net income attributable to Group shareholders % Net income before IFRS % EPS attributable to Group shareholders % EPS before IFRS % Net Debt/equity ratio Net Debt/EBITDA ratio /$ (Transaction) /$ (Conversion) Scope : Contour (Zodiac Seats UK) 6 additional months, IMS consolidated over 8 months ; IPS and NAT consolidated as of Feb. 28th (6 months), La Jonchère consolidated as of Aug 31st, 2013 IFRS3 in COI : 0.6m in 2012/13 vs 1.2m in 2011/12 Page 12
13 Another year of growth In million In million 600 Revenues /09 09/10 10/11 11/12 12/13 Current Operating Income* % 14.0% 14.2% Another growth of sales +13.1% to 3,891.6m +7.3% organic growth +5.3% from acquisitions Contour (6 months) IMS (8 months) IPS and NAT (6 months) Increase in COI* +15.8% to 564.9m 14.5% COI margin % 11.2% 08/09 09/10 10/11 11/12 12/13 /$ (conversion) /$ (transaction) Page 13 *Excluding IFRS3 impact
14 +15.8% increase in Current Operating Income* In million COI 2011/ $ Conversion 6.6 $ Transaction 21.1 External Growth 50.6 Internal Growth COI 2012/2013 Increase in COI* +15.8% to 564.9m +10.3% on a constant perimeter + 5.5m positive impact from exchange rates In million All segments contributed to the growth in COI* COI 2011/2012 AeroSafety Aircraft Systems Aircraft Interiors Holding COI 2012/2013 /$(conversion): 1.31 /$(transaction): 1.32 /$(conversion): 1.31 /$(transaction): 1.28 Page 14 *Excluding IFRS3 impact


15 Aircraft Interiors activities Key events 2012/ % reported growth +7.8% organic Strong growth at Seats owing to the integration of Zodiac Seats UK +18.8% reported / +8.2% organic Strong organic growth at Galleys & Equipment +16.2% reported / +16.0% organic Cabin & Structures improving 6.5% reported / +2.0% organic Vs +2.3% / -0.9% in H % increase in COI* -2.6% in H1 Impact in H1 of the decrease in regional aviation, integration of the UK seats business, non recurrence of a retrofit program, ramp up of NB galleys Recovery of Seats UK in H2 In million In million COI / REV: 14.8% 1,948.9 Revenues % Organic growth: +7.8% Current Operating Income* , / / Galleys & Equipment Cabin & Structures Seats COI 2011/2012 $ Conversion $ Transaction Ext. Growth Int. Growth COI 2012/2013 COI / REV: 14.7% Page 15 * Excluding IFRS3 impact

16 Zodiac Aircraft Systems Key Events 2012/ % of sales increase +5.7% organic External growth 8 month consolidation of IMS 6 months of IPS La Jonchère consolidated at end Aug In million % Revenues 1,101.9 Data Systems Water & Waste Systems Entertainment & Seat Technologies Controls Fluid Management Strong increase in Current Operating Income*: +13.2% Good contribution from external growth Demanding comparison basis and many project at early ramp up stage Investing in new technologies (fuel cell, inerting) COI margin is stable 14.1% Page In million COI / REV : 14.1% 2011/ /13 Organic growth: +5.7% -0.1 Current Operating Income* +7.2 *Excluding IFRS3 impact Electrical Systems Cabin & Cockpit Systems COI 2011/2012 $ Conversion $ Transaction Ext. Growth Int. Growth COI 2012/2013 COI / REV : 14.1%

17 Zodiac AeroSafety Key Events 2012/2013 Good sales growth for Evacuation Systems, Elastomer, Parachute & Protection +8.9% at 564m +8.1% organic +31.1% increase in Current operating income* Strong improvement in COI margin 17.4% vs. 14.5% Good operations at Emergency evacuation, Interconnect and Arresting Systems Improvement in Elastomers and Parachute & Protection In million In million % 2011/ / Revenues Organic growth: +8.1% Current Operating Income* Arresting Systems Interconnect Elastomer Parachute & Protection Evacuation Systems 98.4 COI 2011/2012 $ Conversion $ Transaction Int. Growth COI 2012/2013 COI / REV : 14.5% COI / REV : 17.4% Page 17 *Excluding IFRS3 impact
18 Decrease in financial expenses In million Decrease in Financial expenses Owing to the decrease of average interest rate 2.33% vs. 2.80% Other P&L items Income tax 20 From 134.4m to 141.6m in 12/ % vs 30.2% implicit rate 15 But 30.1% vs 30.2% restated 10 Non current operating items -23.2m vs m 5 Mainly related to IFRS 3 ( -21.1m vs -15.7m) 0 No contribution from held-for-sale assets Vs a positive contribution of 10.9m after tax in 2011/2012 Page 18

19 +19.2% increase in Cash Flow In million Cash Flow In million Working capital % of sales % of sales / / / / Aug 10 Aug 11 Aug 12 Aug 13 Page 19 (1) Based on trade WCR (2) Excluding acquisitions
20 Capex increase linked to investment in new programs In million / / / /13 Intangible capital expenditures 62.8 m of capitalized development costs in FY 2012/2013 vs. 62 m in FY 2011/2012 Mainly related to the development of the A350XWB Property, plant & Equipment, financial Intangible assets Page 20
21 Acquisition and WCR increase result in increase in net debt compared to end 2011/2012 In million Net debt Aug Net Income Amortization & Provision Change in WCR Intangible Assets Tangible Assets Acquisitions Other Financial (1) Others (2) Net debt Aug (1) Including dividends (2) Currency translation adjustments and Net Income from Equity Method Acquisitions: IMS, NAT, IPS, ThreeSixty Aerospace, La Jonchère Page 21
22 Still a significant external growth potential Gearing (1) In million Net debt Gearing is decreasing to Zodiac Aerospace has the capacity to pursue its external growth strategy Aug 07/08 Aug 08/09 Aug 09/10 Aug 10/11 Aug 11/12 Aug 12/13 (1) Net financial debt / equity after dividend Page 22
23 Strategy and outlook Page 23

24 Evolving in a buoyant environment Traffic is experiencing a sustained growth Civilian deliveries are increasing New programs ramping up Zodiac Aerospace is innovating ISIS Fuel Cell Page 24

25 World air traffic is still increasing Revenue Passenger Km World evolution 10% % change compared to previous year 9% 8% 2012 : leap year, rebound after «arabic spring» and tsunami in Japan Change of month for the Chinese New Year X Feb 2013 At same nb of days as of Feb % 6% «Sandy» storm October Preliminary 5% 4% Long term CAGR 4.9% 3% 2% 1% 0% Jan Fév Mar Avr Mai Juin 2012 Juil Aoû Sep Oct Nov Déc Jan Fév Mar Avr Mai Juin 2013 Juil Aoû Sep Oct Nov Déc Page 25

26 Still a high demand for new aircraft Load factor at a high level In % Load factor (3 years) Over the last year, traffic grew by 5.2%... and capacity by 4.5% Increase in 2013 Decrease in April and July Further increase in 2013 Resulting in a 79.9% average load factor, +0.6pt compared to the previous year Further increase in traffic will generate need for additional capacities World traffic forecast ICAO 2013e-2015e % change 2013E 2014E 2015E Africa +5,2% +5,9% +6,0% Asia-Pacific +5,5% +6,4% +6,8% Europe +4,4% +5,5% +6,2% Middle East +10,2% +11,2% +10,8% North America +2,3% +3,3% +3,8% Latin America +7,6% +8,7% +8,0% World +4,8% +5,9% +6,3% Page 26

27 Increase in commercial aircraft production rates Airbus and Boeing are planning further increase in production rates for NB Airbus A320 current: 42/month Studies the possibility to grow further, after the transition to the NEO Current backlog: 4223 aircraft Boeing New WB B737 current: 38/month Targets 42 in Q Studies possibility to go higher Current backlog: 3486 aircraft 787 is ramping up to 10a/c Increase in production rates at Airbus A320s A330/340 A380 Increase in production rates at Boeing B737s B787 B747 Page 27
28 Regional Jets: waiting for new programs Mixed outlook in the short term Decrease in output at Embraer Stabilize at low level at Bombardier While new programs are developping Bombardier CSeries made is first flight on Sept 16th, 2013 Embraer s G2 revealed in June 2013 Newcomers arriving Russia: MC21 and SSJ China: Comac 919 and ARJ21 Japan: MRJ Regional Jets Backlog (units) Development ended Embraer ERJ 170/ Embraer E2 150 Bombardier CRJ 89 Bombardier CSeries 177 Comac Comac ARJ Mitsubishi RJ 160 Irkut MC Sukhoi SJ Development in progress Total Source: Deutsche Bank Page 28
29 Bizjets: a slow pick up Fleet in service is +/- 19,000 aircraft 71% of the fleet is based in North America Deliveries of bizjets are per year 2/3 the market in value is «Large and Global» segment Dassault Falcon, Bombardier, Gulfstream A slow pick up Decrease of bizjets inventory New programs Launch of Dassault 5X during NBAA Development of Bombardier G BizJets Deliveries Cessna Bombardier Embraer Gufstream Dassault Beechcraft Autres Source: GAMA Page 29


")


")
30 New programs sum up First Flight Development Boeing (Sept.) Airbus A350XWB (June) IRKUT MC 21 Mitsubishi RJ Ramp up Bombardier CS100 (Sept.) Embraer G2 Comac 919 Boeing New Launch Airbus A320 NEO Boeing 737 MAX Dassault Falcon 5X (Oct.) Boeing 777X (Nov.) Bombardier Global 7000 Page 30

31 Our Development Strategy combines Internal and External Growth Page 31
32 Our Development Strategy combines Internal and External Growth A successful external growth strategy Key metrics Be a world leader In selected aerospace niche markets With strong barrier to entry And a good aftermarket content Profitable companies Additional metric: operations in dollars and/or in cost competitive countries More than 35 acquisitions in Aerospace since 1978 Page 32

33 Combining internal and external growth, Zodiac Aerospace has built world-leadership in selected niche markets Main Zodiac Aerospace acquisitions in Aerospace And also Heim, Enertec, Simula, Superflexit, Plastiremo, Amfuel, Quinson, Swan, Adder Marine activities were divested in 2007 Page 33
34 A new financing for the Group Announced on July 24th, m reinforcing the Group s financing 535m from a German Schuldschein 3, 5 and 7 year maturity range The largest issue from a non German / Austrian company Initial offer was for 200m 125m from a private placement in France It will allow Zodiac Aerospace to pursue its strategy of internal and external growth diversify its funding sources reinforce its financing structure by increasing the average maturity of its debt Page 34

35 Zodiac Aerospace is innovating ISIS Fuel Cell Page 35

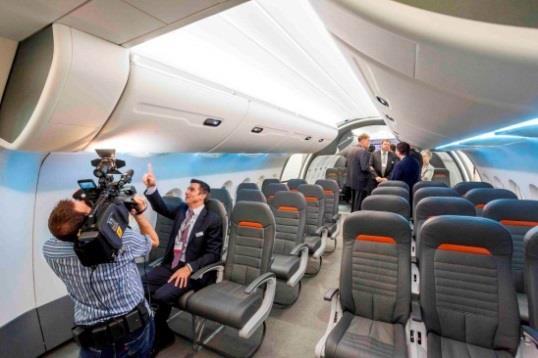
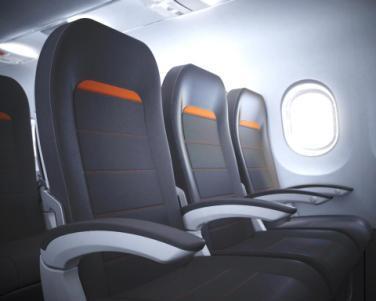
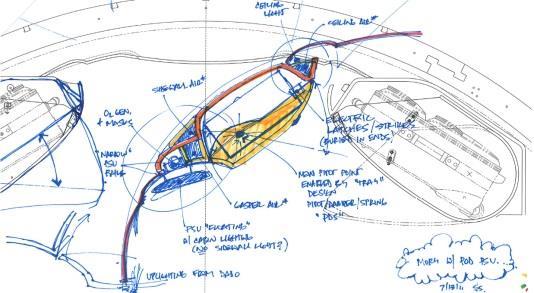
36 ISIS Page 36


37 First ever clamshell pivot bin design, providing 60% increase in carry-on luggage capacity with improved bin ergonomics and reduced weight Giving space back to the passenger A high density Galley A confortable Lavatory Better access for wheel chairs Dual-zone environment Simplified manufacturing, installation and maintenance thanks to modular design All existing aircraft interfaces and structures retained for new build and retrofit markets DragonFly The lightest certified seat : 7.5 kg/pax Permitting easy maintenance 85% of recyclable components New LED lighting solution offering possibility to create customized atmospheres
38 ISIS is taking off A unique offer gathering all Zodiac Aerospace competencies Airlines are showing a strong interest for ISIS Full ISIS solution or ISIS elements Totalizing LOI or orders to equip 900 aircraft Self-financed program Under development, already tested in aircraft Page 38

39 Towards the more electrical aircraft Page 39

40 Zodiac Aerospace is a world leader in power management The acquisition of Innovative Power Solutions (IPS) Completed in early 2013 Specialist of generators and converters for business jets, helicopters and UAVs completes and reinforces Zodiac Aerospace s position in the field of on board electrical power ATA 24 chapter Zodiac Aerospace was already the world leader for primary power management, and is aboard all main aircraft programs Zodiac Aerospace can offer aircraft manufacturers all the solutions complying with their different technological choices ATA 24 parts Zodiac Aerospace IPS Generation Conversion Primary distribution Secondary distribution Battery Fuel Cell R.A.T. - The development of the Fuel Cell will further enhance our positions Page 40

41 Fuel cell principle and application Page 41
42 2013/2014 outlook Passenger Traffic is still growing New programs are progressing Zodiac Aerospace targets another year of organic growth Financial hedges in place for 2013/ % of net estimated /$ transaction exposure at % of net estimated CAD/$ transaction exposure at % of net estimated /$ transaction exposure at 1.56 Page 42
43 A successful strategy Development of the Group focused on Commercial aviation Aboard all new civilian aircraft programs Leading positions in selected niche markets Recurring services model providing additional resilience Leadership in key future technologies Established track record in acquisitions Page 43

44 Appendices P&L Cash Flow Statement Balance Sheet Page 44
45 Appendices: Income statement Income statement 2012/ /2012 % change Sales revenue 3, , % Depreciation and amortization Charges to provisions Current operating income % Non-current operating income Operating income % Cost of net debt % Other financial income and expenses Tax expense % Share in income (loss) of equity affiliates 0.7 Income from continuing operations % Income from operations being discontinued 10.9 Net income % Net income attributable to non-group shareholders Net income attributable to Group shareholders % Page 45
46 Appendices: Cash flow statement In millions of euros 2012/ /2012 Operating activities Cash flow from operations Change in WCR Cash flow from continuing operations Cash flow from operations of businesses being sold INVESTMENT OPERATIONS Acquisition of intangible fixed assets Acquisition of tangible fixed assets and others Changes to the scope of consolidation Cash flow from investments in continuing operations Cash flow from investments of operations being discontinued and assets held for sale 27.4 FINANCING OPERATIONS Change in debt Treasury stock Increase in equity Dividends Cash flow from the financing of continuing operations Currency translation adjustments. beginning of period Change in cash position Page 46
47 Appendices: Balance sheet In millions of euros 31/08/ /08/ /08/ /08/2012 Non-current assets 2, ,347.0 Equity 2, ,056.8 Current liabilities 1, ,504.0 Provisions and deferred taxes Cash and cash equivalents Financial liabilities 1, Other current liabilities Assets held for sale Liabilities held for sale 4, , , ,014.2 Page 47
1 53 70 74 61 preneaume@image7.fr Grégoire LUCAS Tel: +33 (0)1 53 70 74 61 glucas@image7.")
48 ZODIAC AEROSPACE CONTACTS Pierre-Antony VASTRA Tel: +33 (0) Valérie AUGER Tel: +33 (0) rue Pierre Curie CS PLAISIR CEDEX MEDIA CONTACTS IMAGE 7 Priscille RENEAUME Tel: +33 (0) preneaume@image7.fr Grégoire LUCAS Tel: +33 (0) glucas@image7.fr Next meetings: Q1 sales revenue December 17, 2013 (after closing) Q2 sales revenue March 19, 2014 (after closing) Financial results for the first half of 2013/2014 April 23, 2014 (before opening) Page 48
Press Release November 20, 2013
 Another year of growth Results for the 2012/13 fiscal year Zodiac Aerospace posts another year of profitable growth: Sales revenue increased by +13.1% to 3,891.6m; +7.3% increase in organic revenue 1 Current
Press release 17 September 2013
 Another year of growth for Zodiac Aerospace Sales revenue sees a 13.2% increase in - Annual sales revenue for shows a further increase of 13.2%, to 3,895.0 million - Organic growth in sales revenue up
Press Release June 13, 2013
 Zodiac Aerospace confirms its growth objectives An increase of 14.6% in sales over the first nine months of the - fiscal Plaisir, June 13, - Zodiac Aerospace recorded income of 2,836.9 million over the
Half Year Earnings 2009/2010
 Half Year Earnings 2009/2010 April 23, 2010 April 23, 2010 Key Events Current Operating Income of 76.5 million in the first half of 2009/2010, in line with Group forecasts The first half of the year appears
Q3 2015/2016 Sales Presentation. ZODIAC AEROSPACE Tuesday 14th June 2016
 Q3 2015/2016 Sales Presentation ZODIAC AEROSPACE Tuesday 14th June 2016 Safe Harbour statement Certain statements contained in this document are forward-looking statements. These statements includes, without
FY RESULTS ROADSHOW PRESENTATION
 1 FY RESULTS 2014 ROADSHOW PRESENTATION FY 2014 HIGHLIGHTS FOCUS ON EXECUTION 2 Strong financial performance Revenues: 61 bn, +5% vs. 2013 EBIT* before one off: 4.1 bn, +15% vs. 2013 EPS: 2.99, +61% vs.
AIRBUS H Roadshow Presentation. New York July 31 st, 2017
 AIRBUS H1 2017 Roadshow Presentation New York July 31 st, 2017 H1 2017 HIGHLIGHTS 2 Healthy commercial aircraft environment; robust backlog of 6,771 a/c supports ramp-up plans H1 financials reflect delivery
Third Quarter 2014 Results. 29 October 2014
 Third Quarter 2014 Results 29 October 2014 Highlights of the Third Quarter Operating environment Air France-KLM Economic environment remains weak Further currency volatility affecting revenues and results
AIRBUS. H Roadshow Presentation. July 2018
 AIRBUS H1 2018 Roadshow Presentation July 2018 H1 18 HIGHLIGHTS 2 Robust commercial aircraft environment Backlog of ~7,200 a/c underpins ramp-up plans H1 financials reflect mainly A350 performance and
FIRST QUARTER 2017 RESULTS. 4 May 2017
 FIRST QUARTER 2017 RESULTS 4 May 2017 A resilient start of the year, traffic up 4.2% 20.9 million passengers carried, up 5.2%, traffic (RPK) up 4.2%, capacity (ASK) up 3.3% and load factor up 0.7pts Confirmation
First Half 2013 Results. 16 mai 2013
 First Half 2013 Results 16 mai 2013 26 July 2013 Results Increasing effects of Transform 2015 Highlights of the First Half A difficult global economic environment Transform 2015 plan roll-out on track
Financial Results 3 rd Quarter MAR/2016 (FY2015)
") Financial Results MAR/2016 (FY2015) January 29 th, 2016 CONTENTS P.1 P.2 P.3 P.4~ Overview of FY MAR/16 Results Operating Revenue Operating Profit 1,030 1,020 1,010 +1.0Bn 1,022.3 1,023.4 (+0.1%) 180 160
Financial Results MAR/2016 (FY2015) January 29 th, 2016 CONTENTS P.1 P.2 P.3 P.4~ Overview of FY MAR/16 Results Operating Revenue Operating Profit 1,030 1,020 1,010 +1.0Bn 1,022.3 1,023.4 (+0.1%) 180 160
Copa Holdings Reports Net Income of $57.7 million and EPS of $1.36 for the Third Quarter of 2018
 Copa Holdings Reports Net Income of $57.7 million and EPS of $1.36 for the Third Quarter of 2018 November 14, 2018 PANAMA CITY, Nov. 14, 2018 /PRNewswire/ -- Copa Holdings, S.A. (NYSE: CPA), today announced
Financial Results 1 st Quarter Mar/2016 (FY2015) 30 July, 2015
 30 July, 2015") Financial Results Mar/2016 (FY2015) 30 July, 2015 Today s Topics P.2 P.3 P.15 1 Overview of FY Mar/2016 Financial Results Operating Revenue Operating Profit 320 307.0 +4.9Bn (+1.6%) 312.0 50 +17.6Bn (+94.6%)
Financial Results Mar/2016 (FY2015) 30 July, 2015 Today s Topics P.2 P.3 P.15 1 Overview of FY Mar/2016 Financial Results Operating Revenue Operating Profit 320 307.0 +4.9Bn (+1.6%) 312.0 50 +17.6Bn (+94.6%)
OPERATING AND FINANCIAL HIGHLIGHTS
 Copa Holdings Reports Financial Results for the Fourth Quarter of 2018 Excluding special items, adjusted net profit came in at $44.0 million, or Adjusted EPS of $1.04 Panama City, Panama --- February 13,
1.3% millionn euros. Net debt of 5.4 improvement. euros to. Financial Year. the Air. operating. equipped. ness and. also focus on.
 25 th July 2014 Financial Year 2014: First Half results SECOND QUARTER Revenues of 6.45 billion euros, upp 1.7% like-for-like; passenger unit revenue up 1.3% at constant currency thanks to strict capacity
JAPAN AIRLINES Co., Ltd. Financial Results 1 st Quarter Mar/2018(FY2017)
") JAPAN AIRLINES Co., Ltd. Financial Results Mar/2018(FY2017) July 31, 2017 Today s Topics P.1 P.2 P.3 P.4 P.6 P.15 Overview of Financial Results for (FY2017) 1 st quarter resulted in an increase in both
JAPAN AIRLINES Co., Ltd. Financial Results Mar/2018(FY2017) July 31, 2017 Today s Topics P.1 P.2 P.3 P.4 P.6 P.15 Overview of Financial Results for (FY2017) 1 st quarter resulted in an increase in both
Finnair Group Interim Report 1 January 30 September 2008
 Finnair Group Interim Report 1 January 30 September 2008 1 31/10/2008 Presentation name / Author Airline industry at a historical turning point Expensive fuel price in the beginning of 2008 has dramatical
OPERATING AND FINANCIAL HIGHLIGHTS
 Copa Holdings Reports Financial Results for the Fourth Quarter of 2015 Excluding special items, adjusted net income came in at $31.7 million, or EPS of $0.73 per share Panama City, Panama --- February
SAS Group Q2 2012/13. Q2 Restructuring programme moving KPIs in the right direction
 SAS Group Q2 2012/13 1 Q2 Restructuring programme moving KPIs in the right direction Operating revenues +1.6%* Yield improvement of +2.7%* Forceful implementation of 4XNG plan: Unit cost down by 10.7%
Copa Holdings Reports Net Income of $136.5 million and EPS of $3.22 for the First Quarter of 2018
 Copa Holdings Reports Net Income of $136.5 million and EPS of $3.22 for the First Quarter of 2018 May 9, 2018 PANAMA CITY, May 9, 2018 /PRNewswire/ -- Copa Holdings, S.A. (NYSE: CPA), today announced financial
Full Year 2017 RESULTS 16 th of February 2018
 Full Year 2017 RESULTS 16 th of February 2018 2017 FULL YEAR 2017 MAIN ACHIEVEMENTS Robust traffic statistics Strong Full Year results +5.6% +2.0% 42% +101% 1,049 1,488 347 696 FY 2016 FY 2017 Passengers
Copa Holdings Reports Net Income of $49.9 million and EPS of $1.18 for the Second Quarter of 2018
 Copa Holdings Reports Net Income of $49.9 million and EPS of $1.18 for the Second Quarter of 2018 Panama City, Panama --- Aug 8, 2018. Copa Holdings, S.A. (NYSE: CPA), today announced financial results
OPERATING AND FINANCIAL HIGHLIGHTS. Subsequent Events
 Copa Holdings Reports Net Income of US$113.1 Million and EPS of US$2.57 for the First Quarter of 2015 Excluding special items, adjusted net income came in at US$106.0 million, or EPS of US$2.41 per share
Interim results. 11 May 2010
 Interim results 11 May 2010 Introduction Andy Harrison Chief Executive Officer Strong performance despite disruption Improvement in revenue, margins and cash Continued network improvement has driven better
AIR FRANCE-KLM RESULTS PRESENTATION
 AIR FRANCE-KLM RESULTS PRESENTATION Results as at 30 th of June 2018 1 st August 2018 SECOND QUARTER 2018: KEY HIGHLIGHTS Leveraging ongoing solid demand +0.8% +1.7% Stable operating result before strike
THIRD QUARTER 2016 RESULTS. 3 November 2016
 THIRD QUARTER 2016 RESULTS 3 November 2016 Highlights of the Third Quarter 2016 Environment Operations Financial highlights Strong increase in airline industry capacity Terrorist attacks in Europe resulting
Interim Business Report 2017
 April 1, 2017 through September 30, 2017 November 22, 2017 Contents SECTION 1 01 Consolidated Statement of Income 02 Factors Leading to Difference in Consolidated Ordinary Income Compared With Same Period
Finnair Group Interim Report 1 January 30 June 2008
 Finnair Group Interim Report 1 January 30 June 2008 1 08/08/2008 Presentation name / Author Airline industry at a historical turning point Fuel price has a stranglehold on the business Average ticket prices
FOURTH QUARTER RESULTS 2017
 FOURTH QUARTER RESULTS 2017 KEY RESULTS In the 4Q17 Interjet total revenues added $5,824.8 million pesos that represented an increase of 10.8% over the revenue generated in the 4Q16. In the 4Q17, operating
FIRST HALF 2016 RESULTS. 27 July 2016
 FIRST HALF 2016 RESULTS 27 July 2016 Highlights of the Second Quarter 2016 Environment Operations Financial highlights High level of geopolitical uncertainties, including Brexit Terrorist attacks in Europe
1 st Half FY17/18 FY17/18
 SIA SIA ENGINEERING ENGINEERING COMPANY COMPANY 1 st Half Performance Performance Review Review 1 2 SIA ENGINEERING COMPANY Financial Review Financial Highlights The Group posted a net profit of $184.1M
Second Quarter to 30th September
 22 nd November 2007 FINANCIAL YEAR 2007-08 EXCELLENT SECOND QUARTER Operating income up 27.6% to 725 million euros Adjusted 1 operating margin of 12%, up 2 points Net income up 97% to 736 million euros
THIRD QUARTER 2017 RESULTS 3 rd of November 2017
 THIRD QUARTER 2017 RESULTS 3 rd of November 2017 2017 THIRD QUARTER 2017: STRONG OPERATING RESULT DRIVEN BY SOLID TRAFFIC AND INCREASE IN UNIT REVENUE Robust Group traffic statistics +5.1% +4.1% Strong
1 st Quarter Results FY
 1 st Quarter Results FY 2004-05 05 Q1 Highlights p Context 8Improving economic context 8Strong economic growth in Americas and Asia 8Modest economic recovery in Europe 8Soaring fuel prices 8IPE Brent up
OPERATING AND FINANCIAL HIGHLIGHTS. Subsequent Events
 Copa Holdings Reports Net Income of $103.8 million and EPS of $2.45 for the Third Quarter of 2017 Excluding special items, adjusted net income came in at $100.8 million, or EPS of $2.38 per share Panama
AIRBUS FY 2017 ROADSHOW PRESENTATION
 AIRBUS FY 2017 ROADSHOW PRESENTATION February 2018 SAFE HARBOUR STATEMENT 2 DISCLAIMER This presentation includes forward-looking statements. Words such as anticipates, believes, estimates, expects, intends,
Air China Limited Annual Results. March Under IFRS
 Air China Limited 21 Annual Results Under IFRS March 211 Agenda Part 1 Highlights Part 2 Business Overview Part 3 Financial Overview Part 4 Outlook 2 Part 1 Highlights Steady Economic Growth; Asia Pacific
SkyWest, Inc. Announces First Quarter 2018 Profit
 NEWS RELEASE CONTACT: Investor Relations Corporate Communications 435.634.3200 435.634.3553 Investor.relations@skywest.com corporate.communications@skywest.com SkyWest, Inc. Announces First Quarter 2018
Third Quarter Results
 1 Third Quarter 2010-11 Results Highlights of the Third Quarter Passenger business affected by significant disruptions Dynamic cargo activity Strong improvement in results Decline in ex-fuel unit costs
JAPAN AIRLINES Co., Ltd. Financial Results 1 st Quarter Mar/2017(FY2016) July 29, 2016
 July 29, 2016") JAPAN AIRLINES Co., Ltd. Financial Results Mar/2017(FY2016) July 29, 2016 Today s Topics P.1 P.2 P.13 From the first quarter of this fiscal year, figures for Revenue Passengers Carried, ASK, RPK and Load
JAPAN AIRLINES Co., Ltd. Financial Results Mar/2017(FY2016) July 29, 2016 Today s Topics P.1 P.2 P.13 From the first quarter of this fiscal year, figures for Revenue Passengers Carried, ASK, RPK and Load
ANA HOLDINGS Financial Results for the Three Months Ended June 30, 2018
 ANA HOLDINGS NEWS ANA HOLDINGS Financial Results for the Three Months Ended June 30, 2018 TOKYO, July 31, 2018 ANA HOLDINGS INC. (hereinafter ANA HD ) today reports its financial results for the three
OPERATING AND FINANCIAL HIGHLIGHTS SUBSEQUENT EVENTS
 Copa Holdings Reports Net Income of US$6.2 Million and EPS of US$0.14 for the Third Quarter of 2015 Excluding special items, adjusted net income came in at $37.4 million, or EPS of $0.85 per share Panama
2012 Result. Mika Vehviläinen CEO
 2012 Result Mika Vehviläinen CEO 1 Agenda Market environment in Q4 Business performance and strategy execution Outlook Financials 2 Market Environment According to IATA, Global air travel continues to
THIRD QUARTER RESULTS 2018
 THIRD QUARTER RESULTS 2018 KEY RESULTS In the 3Q18 Interjet total revenues added $ 6,244.8 million pesos that represented an increase of 7.0% over the revenue generated in the 3Q17. In the 3Q18, operating
THIRD QUARTER RESULTS 2017
 THIRD QUARTER RESULTS 2017 KEY RESULTS In the 3Q17 Interjet total revenues added $5,835.1 million pesos that represented an increase of 22.0% over the revenue generated in the 3Q16. In the 3Q17, operating
OPERATING AND FINANCIAL HIGHLIGHTS. Subsequent Events
 Copa Holdings Reports Financial Results for the First Quarter of 2016 Excluding special items, adjusted net income came in at US$69.9 million, or EPS of US$1.66 per share Panama City, Panama --- May 5,
31 October 2018 RESULTS AS AT 30 SEPTEMBER 2018 Good resilience of operating result thanks to revenue performance and unit cost reduction
 31 October 2018 RESULTS AS AT 30 SEPTEMBER 2018 Good resilience of operating result thanks to revenue performance and unit cost reduction THIRD QUARTER 2018 Air France-KLM commercial teams delivered a
Information meeting. 12 September 2011
 Information meeting 12 September 2011 Full Year 2010-11 key data April 2010-March 2011 Revenues in billions Operating result in millions 77% Passenger 18.10 +11.3% -44 +874 13% Cargo 3.16 +29.5% +69 +505
SAS Q2 2017/2018 TELECONFERENCE
 SAS Q2 2017/2018 TELECONFERENCE 30 May 2018 Earnings as expected despite negative currency effect POSITIVES + Total revenue up MSEK 73 vs. LY + Currency adjusted yield up 0.6% vs. LY + EB-point sale revenue
THIRD QUARTER 2017 RESULTS STRONG OPERATING RESULT DRIVEN BY SOLID TRAFFIC AND INCREASE IN UNIT REVENUE
 3 rd of November 2017 THIRD QUARTER 2017 RESULTS STRONG OPERATING RESULT DRIVEN BY SOLID TRAFFIC AND INCREASE IN UNIT REVENUE THIRD QUARTER 2017 The operating result stands at 1,022 million euros, up 38.7%
Information meeting. 1 st September 2011
 Information meeting 1 st September 2011 Full Year 2010-11 key data April 2010-March 2011 Revenues in billions Operating result in millions 77% Passenger 18.10 +11.3% -44 +874 13% Cargo 3.16 +29.5% +69
AIRBUS. Berenberg Conference. 23 May 2018
 AIRBUS Berenberg Conference 23 May 2018 SAFE HARBOUR STATEMENT 2 DISCLAIMER This presentation includes forward-looking statements. Words such as anticipates, believes, estimates, expects, intends, plans,
IAG results presentation. Quarter One th May 2018
 IAG results presentation Quarter One 2018 4 th May 2018 Highlights Willie Walsh, Chief Executive Officer Highlights Another strong quarter performance with an operating profit of 280m (5.6% margin, +2.3pts)
Finnair Q Result
 17 August 2016 CEO Pekka Vauramo CFO Pekka Vähähyyppä Finnair Q2 2016 Result 1 Highlights of the second quarter The seventh consecutive quarter of profit improvement Fukuoka & Guangzhou route openings
2013 Annual Results Press Conference, March 13, 2014 Eric Trappier, Chairman & CEO
 2013 Annual Results Press Conference, March 13, 2014 Eric Trappier, Chairman & CEO Falcon: an expanded product line 77 Falcon delivered in 2013 : Falcon 7X Certification of EASy II cockpit Falcon 900LX
OPERATING AND FINANCIAL HIGHLIGHTS SUBSEQUENT EVENTS
 Copa Holdings Reports Financial Results for the Third Quarter of 2016 Excluding special items, adjusted net income came in at $55.3 million, or adjusted EPS of $1.30 per share Panama City, Panama --- November
Preliminary Figures FY 2016
 February 14, 2017 Preliminary Figures FY 2016 Capital Markets Day 2017 Tom Blades (CEO) Disclaimer This presentation has been produced for support of oral information purposes only and contains forwardlooking
CONTACT: Investor Relations Corporate Communications
 NEWS RELEASE CONTACT: Investor Relations Corporate Communications 435.634.3200 435.634.3553 Investor.relations@skywest.com corporate.communications@skywest.com SkyWest, Inc. Announces Fourth Quarter 2017
Fourth Quarter 2015 Financial Results
 Fourth Quarter 2015 Financial Results AerCap Holdings N.V. February 23, 2016 Disclaimer Incl. Forward Looking Statements & Safe Harbor This presentation contains certain statements, estimates and forecasts
MARKET FORECAST BOMBARDIER COMMERCIAL AIRCRAFT COMMERCIALAIRCRAFT.BOMBARDIER.COM BOMBARDIER COMMERCIAL AIRCRAFT MARKET FORECAST
 MARKET FORECAST 2015-2034 BOMBARDIER COMMERCIAL AIRCRAFT COMMERCIALAIRCRAFT.BOMBARDIER.COM BOMBARDIER COMMERCIAL AIRCRAFT MARKET FORECAST 2015-2034 FORWARD-LOOKING STATEMENTS This presentation includes
Copa Holdings Reports Net Income of US$113.9 Million for the Fourth Quarter of 2013
 Copa Holdings Reports Net Income of US$113.9 Million for the Fourth Quarter of 2013 Panama City, Panama --- February 12, 2014. Copa Holdings, S.A. (NYSE: CPA), today announced financial results for the
Cathay Pacific Airways Interim Results 04 August Cathay Pacific Airways Interim Results 6 August 2008
 Cathay Pacific Airways 2010 Interim Results 04 August 2010 Cathay Pacific Airways 2008 Interim Results 6 August 2008 Interim Result 1H 2010 1H 2009 Group Profit/(Loss) HK$6,840m HK$812m Group Turnover
SIA ENGINEERING COMPANY 1 st Half FY17/18 Financial Review
 SIA SIA ENGINEERING ENGINEERING COMPANY COMPANY 11 st st Half Half FY17/18 FY17/18 Performance Performance Review Review 1 2 SIA ENGINEERING COMPANY 1 st Half FY17/18 Financial Review 1H17/18 Financial
SAS Q1 2017/2018. Q1 in Summary: Improved earnings CHANGE VS. Q1 FY17
 SAS 2017/2018 27.02.2018 in Summary: Improved earnings POSITIVES + Passenger revenue up 1% (FX adj.) + Cargo and EB-point sale revenue increased MSEK 109 + Efficiency program delivered MSEK 165 + Positive
JAPAN AIRLINES Co., Ltd. Financial Results 1 st Quarter Mar/2018(FY2017)
") JAPAN AIRLINES Co., Ltd. Financial Results Mar/2018(FY2017) July 31, 2017 Today s Topics P.1 P.2 P.3 P.4~ P.6~ P.15~ Overview of Financial Results for Mar/18 Mar/18 (FY2017) 1 st quarter resulted in an
JAPAN AIRLINES Co., Ltd. Financial Results Mar/2018(FY2017) July 31, 2017 Today s Topics P.1 P.2 P.3 P.4~ P.6~ P.15~ Overview of Financial Results for Mar/18 Mar/18 (FY2017) 1 st quarter resulted in an
First Half 2017 results Result improvement driven by solid traffic and unit revenue performance
 28 th July 2017 2017 results Result improvement driven by solid traffic and unit revenue performance FIRST HALF 2017 Robust traffic resulting in an improved load factor, up 1.4 pts compared to last year
JAPAN AIRLINES Financial Results 2 nd Quarter Mar / 2014 (FY2013)
") JAPAN AIRLINES Financial Results 2 nd Quarter Mar / 2014 (FY2013) Yoshiharu Ueki, President Norikazu Saito, Managing Executive Officer 31 October, 2013 Contents P.2 P.3 P.4 P.6 1 Overview of 2 nd Quarter
JAPAN AIRLINES Financial Results 2 nd Quarter Mar / 2014 (FY2013) Yoshiharu Ueki, President Norikazu Saito, Managing Executive Officer 31 October, 2013 Contents P.2 P.3 P.4 P.6 1 Overview of 2 nd Quarter
executive summary The global commercial aircraft fleet in service is expected to increase by 80% to 45,600 aircraft in 2033 including 37,900
 executive summary The 2014 Flightglobal Fleet Forecast estimates that 36,820 new commercial jet and turboprop aircraft will be delivered into passenger and freighter airline service between 2014 and 2033.
Information meeting. September 2011
 Information meeting September 2011 Full Year 2010-11 key data April 2010-March 2011 Revenues in billions Operating result in millions 77% Passenger 18.10 +11.3% -44 +874 13% Cargo 3.16 +29.5% +69 +505
SAS Q1 2016/
 SAS Q1 2016/2017 08.03.2017 Weak Q1 as expected new structural actions underway Q1 in summary Positives + Currency adjusted passenger revenue up 5% + Strong development of ancillary revenues + Passengers
Cebu Air, Inc. Annual Stockholders Briefing. 24 June cebupacificair.com
 Cebu Air, Inc. Annual Stockholders Briefing 24 June 2015 cebupacificair.com Business Updates Passengers (M) Operating Statistics 2014: Passenger traffic grew 17.5% to 16.9M. Seat capacity grew 14.8% to
FINANCIAL YEAR Key data
 March 8 th, 2012 FINANCIAL YEAR 2011 2011: A TOUGH YEAR Economic environment and geopolitical crises weigh on activity Insufficient level of unit revenues to absorb higher fuel bill Revenues up 4.5% to
Q Fast growth continued, Comparable operating result at record high levels Pekka Vauramo
 2018 Fast growth continued, Comparable operating result at record high levels 17.7.2018 Pekka Vauramo 2 A good - Comparable operating result increased to new seasonal high Revenue Comparable operating
Thank you for participating in the financial results for fiscal 2014.
 Thank you for participating in the financial results for fiscal 2014. ANA HOLDINGS strongly believes that safety is the most important principle of our air transportation business. The expansion of slots
ANA HOLDINGS Financial Results for the Six Months Ended September 30, 2018
 ANA HOLDINGS NEWS ANA HOLDINGS Financial Results for the Six Months Ended September 30, 2018 TOKYO, Nov. 2, 2018 ANA HOLDINGS INC. (hereinafter ANA HD ) today reports its financial results for the six
FY 2013 and Q results. Increasing effects of Transform 2015
 FY 2013 and Q1 2014 results Increasing effects of Transform 2015 Key data FY 13 Change (1) Q1-14 Change (2) Revenue ( bn) 25.52 +2,3% (3) 5.55 +0.0% (4) EBITDA (5) ( m) 1,855 +461m -50 +66m Operating result
CONTACT: Investor Relations Corporate Communications
 NEWS RELEASE CONTACT: Investor Relations Corporate Communications 435.634.3200 435.634.3553 Investor.relations@skywest.com corporate.communications@skywest.com SkyWest, Inc. Announces Second Quarter 2017
Finnair Group Interim Report 1 January 31 March 2008
 Finnair Group Interim Report 1 January 31 March 2008 1 29/04/2008 Presentation name / Author Outlook for the industry less positive Growth of demand declining due to uncertainty of global economy Growth
Management Presentation. March 2016
 Management Presentation March 2016 Forward looking statements This presentation as well as oral statements made by officers or directors of Allegiant Travel Company, its advisors and affiliates (collectively
Interim Report 3m Bilfinger Berger SE, Mannheim May 10, 2012 Joachim Müller, CFO
 Interim Report 3m 2012 Bilfinger Berger SE, Mannheim May 10, 2012 Joachim Müller, CFO Bilfinger Berger SE Interim report 3m 2012 May 10, 2012 Page 1 3m 2012: Highlights Growth in output volume and orders
Consolidated Financial Results for the Three Months Ended June 30, 2017 (Japanese GAAP)
") [REFERENCE TRANSLATION] Please note that this translation is to be used solely as reference and the financial statements in this material are unaudited. In case of any discrepancy between this translation
[REFERENCE TRANSLATION] Please note that this translation is to be used solely as reference and the financial statements in this material are unaudited. In case of any discrepancy between this translation
SHAPING A SUSTAINABLE FUTURE
 SHAPING A SUSTAINABLE FUTURE Full Year Results Year ended 31 March 2017 Analyst and Investor Presentation 8 June 2017 Agenda Introduction Christine Ourmieres-Widener Financial Review Philip de Klerk Performance
FIRST QUARTER RESULTS 2017
 FIRST QUARTER RESULTS 2017 KEY RESULTS In the 1Q17 Interjet total revenues added $4,421.5 million pesos that represented an increase of 14.8% over the income generated in the 1Q16. In the 1Q17, operating
Management Presentation. May 2013
 Management Presentation May 2013 Forward looking statements This presentation as well as oral statements made by officers or directors of Allegiant Travel Company, its advisors and affiliates (collectively
NORWEGIAN AIR SHUTTLE ASA QUARTERLY REPORT SECOND QUARTER 2006 [This document is a translation from the original Norwegian version]
![NORWEGIAN AIR SHUTTLE ASA QUARTERLY REPORT SECOND QUARTER 2006 [This document is a translation from the original Norwegian version]](/thumbs/74/71229964.jpg "NORWEGIAN AIR SHUTTLE ASA QUARTERLY REPORT SECOND QUARTER 2006 [This document is a translation from the original Norwegian version]") NORWEGIAN AIR SHUTTLE ASA QUARTERLY REPORT SECOND QUARTER 2006 SECOND QUARTER IN BRIEF had earnings before tax of MNOK 24.8 (20.6) in the second quarter. The operating revenue increased by 44 % this quarter,
NORWEGIAN AIR SHUTTLE ASA QUARTERLY REPORT SECOND QUARTER 2006 SECOND QUARTER IN BRIEF had earnings before tax of MNOK 24.8 (20.6) in the second quarter. The operating revenue increased by 44 % this quarter,
JAPAN AIRLINES Co., Ltd. Financial Results 3 rd Quarter Mar/2018(FY2017) January 31, 2018
 January 31, 2018") JAPAN AIRLINES Co., Ltd. Financial Results 3 rd Quarter Mar/2018(FY2017) January 31, 2018 Today s Topics P.1 P.2 P.3 P.12 JAL Corporate Website the CONTRAIL Project Overview of Financial Results for 3
JAPAN AIRLINES Co., Ltd. Financial Results 3 rd Quarter Mar/2018(FY2017) January 31, 2018 Today s Topics P.1 P.2 P.3 P.12 JAL Corporate Website the CONTRAIL Project Overview of Financial Results for 3
Volaris Reports Strong First Quarter 2015: 32% Adjusted EBITDAR Margin, 9% Operating Margin
 Volaris Reports Strong First Quarter 2015: 32% Adjusted EBITDAR Margin, 9% Operating Margin Mexico City, Mexico, April 22, 2015 Volaris* (NYSE: VLRS and BMV: VOLAR), the ultra-low-cost airline serving
20 February 2019 FULL YEAR 2018 RESULTS Resilient results despite the impact of strikes and fuel bill increase
 20 February 2019 FULL YEAR 2018 RESULTS Resilient results despite the impact of strikes and fuel bill increase FULL YEAR 2018 More than 100 million passengers carried, the leading European group for long-haul
SAS Group Presentation Carnegie, May 22, 2012 Sture Stölen, Head of IR
 SAS Group Presentation Carnegie, May 22, 2012 Sture Stölen, Head of IR 1 This is the SAS Group 128 destinations 27,2 million passengers 28 new routes to be launched 2012 1,085 daily flights Revenues 2011,
EADS: New Stage of Maturity. Nathalie Errard VP Investor Relations
 EADS: New Stage of Maturity Nathalie Errard VP Investor Relations Lagardere Investor Day, June 1 st, 2006 1 Content Integration and Rise to Leadership 2005 Group Financials New Challenges, New Growth 2
Analysts and Investors conference call. Q results. 15 May 2013
 Analysts and Investors conference call Q1 2013 results 15 May 2013 Management summary Key messages of Q1 2013 +6% +9% +3.3%p. Q1 2013 operational KPIs are in line with 109.7 116.2 6.5 7.1 82.3 85.6 expectations,
FENIX OUTDOOR INTERNATIONAL AG Interim condensed consolidated financial statement for the period ended 30 September 2017
 FENIX OUTDOOR INTERNATIONAL AG Interim condensed consolidated financial statement for the period ended 30 September 2017 Third quarter 2017-07-01 2017-09-30 Period 2017-01-01 2017-09-30 Events after period
Presentation on Results for the 2nd Quarter FY Idemitsu Kosan Co.,Ltd. November 14, 2018
 Presentation on Results for the 2nd Quarter FY 2018 Idemitsu Kosan Co.,Ltd. November 14, 2018 Table of Contents 1. FY 2018 2nd Quarter Financials (1) Overview (2) Segment Information 2. Reference Materials
Summary of Results for the First Three Quarters FY2015/3
 Summary of Results for the First Three Quarters FY2015/3 February 10, 2015 Tokyu Corporation (9005) http://www.tokyu.co.jp/ Contents Ⅰ.Executive Summary 2 Ⅱ.Conditions in Each Business 5 Ⅲ.Details of Financial
26 October 2017 Icelandair Group Interim Report NET PROFIT USD 101 MILLION IN THIRD QUARTER
 NET PROFIT USD 101 MILLION IN THIRD QUARTER Total income in Q3 up by 10% between years, to USD 536.0 million Passenger revenue higher than expected EBITDA unchanged year on year, at USD 161.1 million Passenger
Management Discussions and Analysis for the three-month period ended 31 March 2014 and Executive Summary
 Executive Summary Overview of the global economy during the first quarter of 2015 (Q1/2015) are as following; the US economy has been in recovery mode while rapidly dollar appreciation weighs on net exports
Effective and Efficient Inventory Strategies
 Moderated by: Klaus Mueller Senior Advisor, Aerospace & MRO Practice ICF International Effective and Efficient Inventory Strategies MRO Europe 14 October 2015 London, UK 0 Panel Track Supply Chain & Logistics,
1Q13 R sults esentation
 1Q13 Results Presentation 14 May 2013 Disclaimer The presentation is dated the day it is given. The delivery of this presentation shall not, under any circumstances, create any implication that there has
EMBRAER DAY USA
 EMBRAER DAY 2016 - USA John Slattery President & CEO, Commercial Aviation +55 12 3927 4404 investor.relations@embraer.com.br www.embraer.com 2 Highlights 1,740+ accumulated E-Jets orders 100 Embraer jet