Evaluation of Regional Jet Operating Patterns in the Continental United States. By Aleksandra Mozdzanowska and R. John Hansman
|
|
|
- Opal Watts
- 6 years ago
- Views:
Transcription
1 Evaluation of Regional Jet Operating Patterns in the Continental United States By Aleksandra Mozdzanowska and R. John Hansman International Center for Air Transportation Report ICAT May
2
3 Evaluation of Regional Jet Operating Patterns in the Continental United States by Aleksandra Mozdzanowska and R. John Hansman Abstract Airlines are increasingly using regional jets to better match aircraft size to high value, but limited demand markets. The increase in regional jet usage represents a significant change from traditional air traffic patterns. To investigate the possible impacts of this change on the air traffic management and control systems, this study analyzed the emerging flight patterns and performance of regional jets compared to traditional jets and turboprops. This study used ASDI data, which consists of actual flight track data, to analyze flights between January 1998 and January In addition, a study of regional jet economics, using Form 41 data, was conducted in order to better understand the observed patterns. It was found that in 1998 US regional jet patterns and utilization closely resembled those of the turboprops. Both aircraft were used for hub feeder operations. They flew relatively short distances, under 500 nautical miles, and exhibited similar cruise altitudes and speeds. These patterns began to change as the number of regional jets increased. By January 2003, the regional jets were no longer used solely for hub feeder operations, but were flying longer routes at higher altitudes and faster speeds than turboprops. As a result, regional jets have come to fill a gap in the market by flying on longer routes than the turboprops, but shorter than the narrow body jets. An economic analysis was conducted in order to better understand the observed regional jet patterns. It was found that regional jets have lower operating costs per trip and higher operating costs per ASM than traditional jets. As a result, regional jets are currently a lower cost alternative for traditional airlines because they cover the cost of regional jet flights on a per departure basis. However, if this structure were to change regional jets would become a less appealing alternative. To better understand the consequences of a change in the operation patterns, changes in the cost of regional and traditional jets were analyzed when trip length and pilot costs per block hour were normalized. It was found that regional jet costs per trip are very similar to traditional jet costs per trip when the trip length between the two aircraft categories is normalized, but that the normalization of pilot cost per block does not have a significant effect on the relative costs of the two aircraft types. In 2003, the US regional jet operations showed a high density of flights in the northeastern part of the country. This part of the US also has the largest concentration of traditional jet operations; this interaction may result in congestion problems since the two types of aircraft exhibit different performance. In particular, regional jets were observed to exhibit lower climb rates than traditional jets, which may impact air traffic control 3
4 handling and sector design. It was also observed that as regional jets replace turboprops, they compete for runways and take off trajectories with narrow body jets. The combination of the different performance and the competition for resources between regional and other jets may result in increased delays and congestions as well as increased controller workload. The future growth of regional jets is uncertain. However, currently both US Airways and Jet Blue have placed orders for new Embraer aircraft indicating that the growth of regional jets will continue for the time being. In addition, both Embraer and Bombardier are currently designing and manufacturing larger regional jets. These aircraft will be designed to accommodate more passengers on further trips and as a result will further change the composition and performance capabilities of the national fleet. 4
5 Acknowledgements This work was supported by Robert Yackovetsky from the NASA Langley Research Center, under grant number NAG Dale Rhoda from the Volpe Center helped with the acquisition of ASDI flight track data, which was crucial to the success of this research. The data was provided by Doug Williamson from the Air Traffic Airspace Laboratory. Joyce Lin and Professor David Gifford from the MIT Lab for Computer Science provided access to flight track data and analysis tools that were used in earlier versions of this work. In addition, members of the International Center for Air Transportation, in particular my advisor Professor Hansman, contributed their insight, advice, and support. 5
6
7 Contents 1 Introduction Objective Motivation Background Methodology Analysis Outline Data Sources Data Processing Visualization of Traffic Data Operating Patterns of Regional Jet, Traditional Jet, and Turboprops Regional Jet Growth and Operating Patterns Regional Jet Operating Patterns Compared to Other Aircraft Types Stage Length Evolution Regional Jet Economics Economic Analysis Regional Jet Costs Regional Jet Costs as a Function of Stage Length Operating Cost as a Function of Pilot Cost Ownership Costs Understanding Regional Jet Growth and Patterns Reasons for Regional Jet Growth Constraints on Regional Jet Growth The Future of Regional Jets Comparison of Regional Jet, Traditional Jet, and Turboprop Performance Performance Study Motivation Comparison of Cruise Speeds and Altitudes Comparison of Climb Rates Possible Consequences of Regional Jet Growth Airport Area
8 7.2 Terminal Area En Route Congestion Summary of ATC Concerns Conclusions Summary of Findings
9 List of Figures Figure 1: US Regional Jet Growth Based on FAA Registration Data [2] Figure 2: Examples of an E 145 (50 seats) and CRJ 2 (50 seats) [3][4] Figure 3: 3-view Drawing of E145 [3] Figure 4: 3-view Drawing of CRJ2 [4] Figure 5: Structure of Processed ASDI Data Figure 6: Density Map of 24 Hours of Flights in January 2003: Limited Scale Figure 7: Density Map of 24 Hours of Flights in January 2003: Unlimited Scale Figure 8: Density Map Close up of 24 Hours of Flights at Atlanta in January 2003: Figure 9: January 1998 Regional Jet Density Map Figure 10: January 1999 Regional Jet Density Map Figure 13: January 2000 Regional Jet Density Map Figure 14: January 2001 Regional Jet Density Map Figure 15: January 2002 Regional Jet Density Map Figure 16: January 2003 Regional Jet Density Map Figure 15: FAA Map of Major Airports in the USA [14] Figure 16: January 2003 Density Maps Figure 17: January 1998 and 2003 Departures from DFW Figure 18: January 1998 Distance Histogram Figure 19: January 2003 Distance Histogram Figure 20: Flight Operating Costs per ASM Figure 21: Flight Operating Costs per Trip Figure 22: Comparison of Operating Cost per ASM with and without a change to Stage Length Figure 23: Comparison of Operating Cost per Trip with and without a change to Stage Length Figure 24: Comparison of Operating Cost per ASM with and without a change to Pilot Costs Figure 25: Comparison of Operating Cost per Trip with and without a change to Pilot Costs
10 Figure 26: Comparison of Operating Cost per ASM with and without Ownership Costs 49 Figure 27: Comparison of Operating Cost per Trip with and without Ownership Costs. 49 Figure 28: Change in Routes between 1998 and 2003 [19] Figure 29: Percentage of Regional Jet Flights Providing Service between Hub and Nonhub Airports Figure 30: Past and Projected Growth of Regional Jets [21] Figure 31: Examples of an ERJ 190 (98 seats) and CRJ 900 (86 seats) Figure 32: January 1998 Histogram of Primary Cruise Altitudes Figure 33: January 2003 Histogram of Primary Cruise Altitudes Figure 34: January 1998 Histogram of Average Cruise Speeds Figure 35: January 2003 Histogram of Average Cruise Speeds Figure 36: A320 Climb Rate Distribution Figure 37: B737 Climb Rate Distribution Figure 38: CRJ2 Climb Rate Distribution Figure 39: E145 Climb Rate Distribution Figure 40: ATL Surface Diagram Figure 41: DFW Surface Diagram Figure 42: EWR Surface Diagram Figure 43: DFW Take off Tracks for Departures between 0000 and 0500 GMT Figure 44: Missed Sector Crossing due to Slow Climb Rate Figure 45: January 1998 Distance Histogram Figure 46: January 1999 Distance Histogram Figure 47: January 2000 Distance Histogram Figure 48: January 2001 Distance Histogram Figure 49: January 2002 Distance Histogram Figure 50: January 2003 Distance Histogram Figure 51: ATL Catchment Basin Changes between 1998 and Figure 52: BOS Catchment Basin Changes between 1998 and Figure 53: CVG Catchment Basin Changes between 1998 and Figure 54: January 1998 Primary Cruise Altitude Histogram Figure 55: January 1999 Primary Cruise Altitude Histogram
11 Figure 56: January 2000 Primary Cruise Altitude Histogram Figure 57: January 2001 Primary Cruise Altitude Histogram Figure 58: January 2002 Primary Cruise Altitude Histogram Figure 59: January 2003 Primary Cruise Altitude Histogram Figure 60: January 1998 Average Cruise Speed Histogram Figure 61: January 1999 Average Cruise Speed Histogram Figure 62: January 2000 Average Cruise Speed Histogram Figure 63: January 2001 Average Cruise Speed Histogram Figure 64: January 2002 Average Cruise Speed Histogram Figure 65: January 2003 Average Cruise Speed Histogram Figure 66: A319 Climb Rate Distribution January Figure 67: A320 Climb Rate Distribution January Figure 68: B733 Climb Rate Distribution January Figure 69: B737 Climb Rate Distribution January Figure 70: CRJ1 Climb Rate Distribution January Figure 71: CRJ2 Climb Rate Distribution January Figure 72: E135 Climb Rate Distribution January Figure 73: E145 Climb Rate Distribution January
12 List of Tables Table 1: Regional Jets and Manufacturers Table 2: Specifications for E145, CRJ2, and B733 [5][6][7] Table 3: ASDI NAS Messages [10] Table 4: Aircraft and Carriers Included in the Economic Analysis Table 5: Baseline Economic Data Table 6: List Prices by Aircraft Type Table 7: US Regional Carrier and Code Share Partners [18] Table 8: Continental Express RJ Fleet as of December
13 Abbreviations ARTS ASDI ATA ETMS FAA NAS OAG WTO Automated Radar Track System Aircraft Situational Display to Industry Air Traffic Aerospace Laboratory Enhanced Traffic Management System Federal Aviation Administration National Airspace System Official Airline Guide World Trade Organization Airport Abbreviations ATL BNA BOS USA) BWI CLE CLT CVG USA) DCA DEN DFW DTW EWR FLL USA) IAD IAH Hartsfield - Jackson Atlanta International Airport (Atlanta, GA, USA) Nashville International Airport (Nashville, TN, USA) General Edward Lawrence Logan International Airport (Boston, MA, Baltimore-Washington International Airport (Baltimore, MD, USA) Cleveland-Hopkins International Airport (Cleveland, OH, USA) Charlotte/Douglas International Airport (Charlotte, NC, USA) Cincinnati/Northern Kentucky International Airport (Cincinnati, OH, Ronald Reagan Washington National Airport (Washington, DC, USA) Denver International Airport (Denver, CO, USA) Dallas/Fort Worth International Airport (Dallas-Fort Worth, TX, USA) Detroit Metropolitan Wayne County Airport (Detroit, MI, USA) Newark Liberty International Airport (Newark, NJ, USA) Fort Lauderdale/Hollywood International Airport (Fort Lauderdale, FL, "Washington Dulles International Airport (Washington, DC, USA) George Bush Intercontinental Airport/Houston (Houston, TX, USA) 13
14 IND JFK LAS LGA MCI MCO MDW MEM MIA MSP ORD PDX PHL PHX PIT RDU SAN SEA SFO SJC SLL STL TEB TPA Indianapolis International Airport (Indianapolis, IN, USA) John F Kennedy International Airport (New York, NY, USA) Mc Carran International Airport (Las Vegas, NV, USA) La Guardia Airport (New York, NY, USA) Kansas City International Airport (Kansas City, MO, USA) Orlando International Airport (Orlando, FL, USA) Chicago Midway International Airport (Chicago, IL, USA) Memphis International Airport (Memphis, TN, USA) Miami International Airport (Miami, FL, USA) Minneapolis-St Paul International Airport (Minneapolis, MN, USA) Chicago O'Hare International Airport (Chicago, IL, USA) Portland International Airport (Portland, OR, USA) Philadelphia International Airport (Philadelphia, PA, USA) Phoenix Sky Harbor International Airport (Phoenix, AZ, USA) Pittsburgh International Airport (Pittsburgh, PA, USA) Raleigh-Durham International Airport (Raleigh/Durham, NC, USA) San Diego International Airport (San Diego, CA, USA) Seattle-Tacoma International Airport (Seattle, WA, USA) San Francisco International Airport (San Francisco, CA, USA) Norman Y. Mineta San Jose International Airport (San Jose, CA, USA) Mc Carran International Airport (Las Vegas, NV, USA) Lambert-St Louis International Airport (St Louis, MO, USA) Teterboro Airport (Teterboro, NJ, USA) Tampa International Airport (Tampa, FL, USA) 14
15 1 Introduction 1.1 Objective Since 1993, one of the significant changes to the national air space system has been the emergence of regional jets. This growth may have unpredicted consequences on the National Airspace System. The goal of this thesis is to analyze, compare, and understand the national flight patterns and performance characteristics of regional jets, narrow body jets, wide body jets, and turboprops, and to identify the possible implications of regional jet growth for Air Traffic Management and Control. 1.2 Motivation Regional jets were first introduced in the USA in June 1993 when Comair introduced service between Cincinnati and Akron/Canton [1]. Since that time regional jets have experienced a tremendous growth in the USA. This growth can be seen in Figure 1, which shows the registration data between the first quarter of 1995 and the first quarter of 2004, for the regional jets commonly flown in the United States. The figure shows the sum of all the registrations of each aircraft type in each quarter. It can be seen that the growth between 1995 and 2004 is significant and exhibits a nearly exponential pattern. The two most popular regional aircraft, the E145 and the CRJ2, grew the fastest in this time period. Looking at flight track data, this growth in the number of registrations translated to approximately a 356% increase in regional jet flights in the United States between January 22nd 1998 and January 9th In 1998 there were 1761 regional jet flights serving 625 origin-destination pairs, and in 2003, these numbers increased to
16 regional jet flights serving 2140 origin-destination pairs. In comparison, in 1998 traditional jets flew flights connecting 6275 origin-destination pairs, and in 2003 traditional jets flew flights connecting 7058 origin-destination pairs Q1 1987Q3 1988Q4 1990Q1 1994Q1 1994Q4 1995Q3 1996Q3 1997Q2 1998Q1 1998Q4 1999Q3 2000Q2 2001Q1 2001Q4 2002Q3 2003Q2 2004Q1 CRJ900 CRJ700 CRJ200 CRJ100 EMB135 EMB145 BAE145 Figure 1: US Regional Jet Growth Based on FAA Registration Data [2] 1.3 Background Regional jets are generally defined as aircraft powered by jet engines, having between 30 and 100 seats, and capable of flying distances of 800 to a 1,000 nautical miles. The list of regional jets along with the corresponding manufacturers and status of service and production can be seen in Table 1. 16
 Aircraft manufactured by Bombardier and Embraer are")
17 Manufacturer Bombardier British Aerospace Embraer Table 1: Regional Jets and Manufacturers In service, but no longer produced RJ70, RJ85, RJ100, BAe146 In service and currently produced CRJ1, CRJ2, CRJ7, CRJ9 ERJ135, ERJ140, ERJ145 Not yet in service ERJ170, ERJ175, ERJ190, ERJ195 Fairchild Dornier 328JET 328JET (production is to resume) Aircraft manufactured by Bombardier and Embraer are currently the most commonly flown regional jets in the USA. In particular the Embraer 145 (E145) and the Bombardier 200 (CRJ2) are the two most numerous aircraft in the US regional jet fleet. In 2003, there were slightly fewer than 400 E145 aircraft and slightly more than 400 CRJ2 aircraft, which together account for 65% of the total registered regional jets and for over 50% of all regional jet flights in the United States. Pictures of the two aircraft as well as three view diagrams can be seen in Figures 2 through 4. Figure 2: Examples of an E 145 (50 seats) and CRJ 2 (50 seats) [3][4] 17
18 Figure 3: 3-view Drawing of E145 [3] 18
19 Figure 4: 3-view Drawing of CRJ2 [4] To provide a better understanding of how regional jets compare to other aircraft currently flow in the Unites States Table 2 shows the specifications for the E145, the CRJ2, the B190, and the B (B733). The B190 and B733 are currently the turboprop and narrow body jet aircraft with the highest frequency of flights in the US. It can be seen from the specifications that the regional jets are smaller, lighter, and carry fewer passengers than the narrow body jet. However, the two aircraft types exhibit 19
20 similar performance. The regional jets are also much larger then the turboprops, which fly slower and require a much shorter take off and landing field length. Table 2: Specifications for E145, CRJ2, and B733 [5][6][7] Aircraft Type B190 E145 CRJ2 B733 Manufacturer Raytheon Embraer Bombardier Boeing Number of Crew Number of Passengers Wing Span (ft) Wing Area (sq. ft) Max Length (ft) Max Height (ft) Empty Weight (lb) Gross Weight (lb) Max Landing Weight (lb) Cargo Capacity (lb) Engine Model and PWC 2 All. AE3007- Make PTA6A-65B A1/1 or -A1 2 GE CF34-3B1 2 CMF56-3C-1 Max Speed (Mach or mph) M0.4 M0.78 M Best Cruise Speed (Mach or mph) M0.4 M0.76 M0.74 M0.745 FAA Take off Field Length (ft) FAA Landing Field Length (ft) Still Air Range (mi)
21 2 Methodology 2.1 Analysis Outline The first goal of this study was to analyze and understand regional jet growth, evolution, and operating patterns. This goal was reached in two steps. The first was to analyze the data and develop methods to visualize and quantify the change in patterns of regional jet flights. Once this was accomplished aircraft economics, aircraft utilization, airline scope clause agreements, and other factors were used to develop an understanding and explanation of the observed patterns. The second goal of the study was to assess the validity of common concerns about the impact of regional jets on congestion and air traffic control and management. The concerns were based on the belief that regional jets perform differently than other aircraft. As a result, cruise altitudes, cruise speeds, and climb rates of regional jets and other aircraft were compared. Once the performance of the regional jets and other aircraft was known, areas where the performances differed were identified and studied in more detail. 2.2 Data Sources To accomplish the goal of analyzing the emerging regional jet trends and conducting a performance comparison between regional jets and other aircraft, this study required flight data for regional jet and other aircraft flights. However, where previous studies have used scheduled flight data such as the OAG [8], this study desired to use actual flight data, which, in addition to containing information about the origin, destination, and 21
22 time of flight, would also provide position information about the aircraft during flight. As a result, flight data from the Aircraft Situational Display to Industry (ASDI) feed was used. The ASDI feed is compiled by the Volpe center from the FAA s Enhanced Traffic Management System (ETMS) and made available to vendors, who can then pass the data on to other interested parties. ETMS data is used by the FAA to monitor and control air traffic flow. The ETMS system includes information about the aircraft during flight, weather information, as well as various tools for monitoring and predicting demand, congestion, and other states of the system. Data regarding aircraft during flight includes flight plan and actual flight path data, which is updated every minute. This data is assembled from the Official Airline Guide (OAG), flight messages from airline flight data systems, and National Airspace System (NAS) messages from the Automated Radar Track System (ARTS). [9]. The ASDI server receives raw data from ETMS, which contains the above mentioned data, as well as TO and RT messages, both described in Table 3, generated by ETMS. The received data is then filtered to remove sensitive data such as information about military flights. The specific rules for filtering the data can be seen in Appendix A. The final ASDI data stream contains 10 message types, which are listed and explained in Table 3. [10]. For the purpose of this research, archived ASDI data was obtained from the Air Traffic Airspace (ATA) Laboratory. The data was obtained in the form of 10 data tables, where each table contains a specific grouping of ASDI messages, retrieved from the Laboratory s ASDI database. From the 10 available tables, this study used the Flight and the Route tables, which contain the desired variables. The list of variables extracted for the purpose of this study can be seen in Figure 5. 22
23 This study used ASDI data for one Thursday in January, between 1998 and Additional days of data were obtained, but the January data was used because it represented the longest sample of consecutive years. The actual dates of days for which data was used can be seen in Appendix B. Since part of the goals of this research was to analyze the emergence and growth of regional jets, multiple years of data were necessary. Furthermore, each data sample is for the same weekday to eliminate the effect of weekly variations in airline operations. The specific day was chosen based on the identification of clear weather days, which were found by looking at the National Climatic Data Center (NCDC) weather archives [11]. Table 3: ASDI NAS Messages [10] Message AF AZ DZ FZ RZ TZ UZ RT TO HB Description Flight Plan Amendment Arrival Announcement Departure Announcement Flight Plan Cancellation Position Update Flight Plan Update Extra Data Calculated by ETMS ARINC Oceanic Flight Reports Proof of Connection Signal In order to understand the patterns observed using the ASDI data, Form 41 data was used to study and compare the cost structure of regional jets and other aircraft. Form 41 data includes balance sheet and income statement information from all US airlines that 23

24 are required to file with the US Department of Transportation s Research and Special Projects Administration. This includes all airlines with annual operating revenues of $20 million or more, and includes all major and some regional airlines. The specific information used for this study included the aircraft operating expenses grouped by aircraft type. [12]. 2.3 Data Processing To effectively use the ASDI data it needed to be consolidated and formatted in a way that made calculations and plotting possible. The desired format was a text file that could be operated on using python and MatLab, but the data required extensive processing and filtering before this format could be achieved. The resulting file consisted of multiple flight records separated by a space. The format of each flight record can be seen in Figure 5. For the purpose of this discussion the first line of the record will be referred to as the header and the subsequent lines as the updates. Figure 5: Structure of Processed ASDI Data 24
25 The first step in creating a usable version of the data was to consolidate flights messages into a single flight record. Different parts of the flight messages were located in either the Flight or Route files and were matched based on all the fields listed in the header line of the record. It was necessary to use multiple data fields to group flight messages because it is possible for two flights with the same ID and the same aircraft type to be flying at the same time, but in different parts of the country. In consolidating the flight records, flights with missing fields in the header line, as well as flights with fewer then two updates were thrown out. The flights with missing fields in the header line were removed because without this information it is impossible to know if the flight actually flew, what its flight path was, or when it flew. Flights with fewer then two updates were removed because no actual flight lasts only a few minutes, and because if one of the updates is bad it is not possible to determine which. Once the flight messages were assembled into flight records, the next step was to remove flight records that did not make sense. This includes flights where the arrival time was before the departure time and flights where the time of travel did not accurately correspond to the distance of travel. As a result of the above outlined data processing, on average 37% of flights were removed. It is not clear what fraction of the removed flights were actual flights that took place and what fraction was a result of noise in the data. A significant amount of noise can be introduced into the ETMS data because it is based on a real time message stream, and assembled from multiple sources. The next step in creating a usable data file was to filter out transition and incomplete updates from each record. Transition updates contain information about what the plane is required to do in the future rather than what it is doing now. For example, it may contain 25
26 the cruising altitude to which the aircraft will climb. Since these updates do not contain information about the actual behavior of the aircraft they were removed. Updates where the point did not fit in between those surrounding it, as well as updates where speed was zero but altitude was not, and vice versa were counted as incomplete data and also removed. This filtering has no effect on the total number of aircraft that was kept. It does, however, remove updates of specific flights to make the flight trajectory smoother. Finally, for the purposes of this study the data was broken down into four categories based on aircraft type: the narrow body traditional jets (TJnb), the wide body traditional jets (TJwb), the turboprops (TP), and the regional jets (RJ). The list of aircraft included in each category can be seen in Appendix C. Other aircraft such as general aviation or business jets were not included. As a result, from the data that survived the above outlined process on average about 63% of daily flights were used for analysis. 2.4 Visualization of Traffic Data To visualize the flight patterns of regional jets and other aircraft, density maps were generated using the ASDI data. The technique for making density maps was based on the algorithms developed by a previous graduate student for a program called Visual Flight [13]. An example of a density map is shown in Figure 6. The plot was generated by dividing the map into a grid and counting the number of flights whose paths intersected each square in the grid. The map was colored based on the number of aircraft that appeared over a specific area during the course of an input time bound. The size of each square in the grid was 1/15 th by 1/15 th of a latitude longitude increment. It should be noted that if the granularity of the grid is changed, the resulting density values will be altered. This resolution was limited by the computational capability of MatLab. 26

27 However, for analyzing large scale patterns over the entire US, this resolution is sufficient. Furthermore, if more accurate resolution is required it can be achieved provided that the data set analyzed is smaller then the one containing 24 hours of flights over the entire US. This can be accomplished by limiting the geographical area, or the time bound studied. The top limit on the map scale does not represent the highest density of aircraft, rather the scale ends at 100; this was done to create a map with a good contrast between areas of different density. For comparison, a map where the limit of the scale is equal to the highest value of density can be seen in Figure 7. It can be seen from the figure that this scale obscures most of the density differences because very few areas have densities at the high end of the spectrum. In fact, the only places where the density reaches close to the maximum occur almost directly over large airports. An example of such an area can be seen in Figure 8 which shows a close up view of the Atlanta airport. Aircraft Count Figure 6: Density Map of 24 Hours of Flights in January 2003: Limited Scale 27

28 Aircraft Count Figure 7: Density Map of 24 Hours of Flights in January 2003: Unlimited Scale Aircraft Count Figure 8: Density Map Close up of 24 Hours of Flights at Atlanta in January 2003: Unlimited Scale 28
29 3 Operating Patterns of Regional Jet, Traditional Jet, and Turboprops 3.1 Regional Jet Growth and Operating Patterns As mentioned in the introduction, there has been a significant increase in the number of regional jets in the US. However, in addition to looking at the increase in the number of aircraft, it is also useful to analyze the growth in the number of flights, as well as where in the US those flights cluster. Figures 9 through 14 show the growth in the density of regional jet flights over the US. It can be seen from Figure 9 that in 1998 most of the regional jet flights clustered closely around large airports, such as DFW, ATL, CVG, SLC, LAX, DEN, and SFO. This clustering suggests that the jets were being used for hub feeder operations. Figure 10 shows that in 1999 the densities increased, but the patterns remained very similar. As can be seen from Figure 11, the growth in the regional jet density continued between 1999 and In particular, a large growth can be seen in the northeast part of the country, and in places like IAH and ORD. Figures 12 through 14 show that between 2001 and 2003, the densities increased significantly all over the US, resulting in a dense covering of regional jet flights over the eastern half of the country. Furthermore, the highest densities can be observed at many of the major airports in the country. In addition, a change in the flight distances can also be observed. There are still flights clustered around hubs, but the distances that these aircraft are flying around the hubs have increased. Close observation of SLC between 1998 and 2003 shows a good example of this change. A map of the location of all the major airports can 29
30 be seen in Figure 15. The full names of all the airports can be found in the Abbreviations section at the start of this document. Aircraft Count Figure 9: January 1998 Regional Jet Density Map Aircraft Count Figure 10: January 1999 Regional Jet Density Map 30
31 Aircraft Count Figure 11: January 2000 Regional Jet Density Map Aircraft Count Figure 12: January 2001 Regional Jet Density Map 31

32 Aircraft Count Figure 13: January 2002 Regional Jet Density Map Aircraft Count Figure 14: January 2003 Regional Jet Density Map 32
33 Figure 15: FAA Map of Major Airports in the USA [14] 3.2 Regional Jet Operating Patterns Compared to Other Aircraft Types The previous section showed the growth and high level development of regional jet pattern between 1998 and However, it also important to understand where the regional jet patterns fit as compared to other aircraft types. Figure 16 shows how the 2003 regional jet patterns compare to those of narrow body traditional jets, wide body traditional jets, and turboprops. As was mentioned above regional jets have dense operations in the eastern part of the country and flew increasingly longer stage lengths between 1998 and In comparison, Figure 16 shows that in 2003 turboprops flew fever flights then regional jets, but like regional jets showed the highest densities in the north east. It can also be seen that the turboprop operations clustered around major airports, and exhibited relatively short stage lengths. A clear example of this clustering 33

34 can be seen at DFW. Narrow body jets have the largest number of flights, showing a high density over all of the US, but like regional jets and turboprops show the largest concentration of flights in the north east and near major airports. It can also be seen that narrow body jets fly longer routes than either regional jets or turboprops. These routes include many transcontinental flights and some international flights. Similarly to narrow body jets, wide body traditional jets fly long stage lengths, with some transcontinental flights and a significant number of international fights. Unlike the previous three categories of aircraft, wide body jets do not exhibit the highest densities in the north east, but show a corridor of dense flights between California on the west cost and the New York region in the east cost. Figure 16: January 2003 Density Maps 34
35 3.3 Stage Length Evolution In order to better understand the observed changes in regional jet operating patters an analysis of the evolution of stage length was conducted. A specific case of this evolution can be seen by looking at a route map of DFW in 1998 and 2003, shown in Figure 17. The plot shows the catchment basin created around DFW by regional jets, turboprops, and narrow body jets. The catchment basin was defined as the radius within which 95% of all flights from DFW fit. It can be seen from Figure 17 that in 1998 regional jets and turboprops both covered about the same distances away from DFW, with the turboprops having a slightly longer range. The figure also shows that, by 2003, regional jets provided service to cities within a radius of 868 nautical miles around DFW. This new regional jet pattern increased the catchment basin around DFW by over 500 nautical miles, while the turboprop range increased by only about 30 nautical miles. Regional jets evolved from flying the same ranges as the turboprops, to flying ranges in between the turboprops and the narrow body jets, effectively increasing the amount of traffic into DFW. Appendix E contains further examples of airports where regional jets have increased the catchment basin. 35


36 Figure 17: January 1998 and 2003 Departures from DFW In order to understand the overall change in the stage length flown by regional jet compared to other aircraft types, a histogram of the stage length distribution for each aircraft category was created for January 1998 and January These histograms show data for flights over the entire US, and not just from one city as in the example above. The histograms are normalized by the total number of aircraft in each category so that the relative shapes of the distributions are not distorted. Figure 18 shows that in 1998 the regional jet and turboprop distributions were very similar as can be seen from the way the two curves almost overlap. The respective peaks of the regional jet and turboprops both occur at about 250 nautical miles, and both distributions exhibit very few flights longer than 400 nautical miles. Figure 19 shows that while the turboprop distribution changed little; by 2003 the percentage of regional jet flights with stage lengths less than 500 nautical miles had decreased, and the percentage with stage lengths greater than 500 nautical miles had grown. This increase resulted in 36
37 regional jets flying stage lengths between those of turboprops and narrow body jets. Appendix D contains the distance histograms for the years between 1998 and Figure 18: January 1998 Distance Histogram Figure 19: January 2003 Distance Histogram 37
38
39 4 Regional Jet Economics 4.1 Economic Analysis The goal of this analysis was to understand the cost structure of both regional and traditional jets and to gain insight into the reasons for the observed regional jet patterns. In order to compare the cost of operating a regional jet versus a traditional jet, Form 41 data, between the second quarter of 2002 and 2003 was used. Form 41 data is the mandatory filling of financial data for all large US airlines. This data includes cost and operating information for all airlines with annual revenues over $20 million. As a result, the number of airlines that fly regional jets and are included in the study was limited, because many of these airlines do not make high enough revenues. In addition, the data was aggregated across airlines according to aircraft type. The aircraft types and air carriers included in the study, as well as the list of regional carriers not included in the study, are shown in Table 4. 39
40 Table 4: Aircraft and Carriers Included in the Economic Analysis Aircraft Carriers Included in Analysis B737 Aloha, Alaska, American, America West, Continental, Delta, Frontier, Northwest, Southwest, United B757 American, Comair, Continental, Delta, Northwest, United, USAirways A319 America West, Frontier, Northwest, United, USAirways A320 America West, Jet Blue, Northwest, United, USAirways CRJ2 Air Wisconsin, Atlantic Southeast, Comair CRJ7 American Eagle, Atlantic Southeast, Comair, Horizon E135 American Eagle E140 American Eagle E145 American Eagle, Trans States Excluded Regional Carriers: Ameristar, Chautauqua, Express Jet, Horizon, Mesa, Pinnacle, Republic, Sky West, USA Jet In order to evaluate the effect on cost as a result of changes in operation patters, it is useful to first present the baseline data to which other scenarios can be compared. Table 5, shows the baseline data for all aircraft included in the analysis. The variables shown are those used to calculate the costs per ASM and per trip shown later in this chapter. 40
41 Table 5: Baseline Regional Jet Operations and Economic Data Aircraft Number of Average Trip Pilot Cost per ASMs ( 000s) Trips Length Block Hours B B A A CRJ CRJ E E E Regional Jet Costs The flight operating costs per ASM for all the aircraft included in the study are shown in Figure 20. The per ASM metric is a good way to look at costs because it directly relates the cost to the product that the airline is selling: a seat to a passenger on a specific route. It can be seen from the figure that the regional aircraft costs per ASM are much higher than those of the narrow body jets. This is due to the fact that regional jets have fewer seats and are generally operated on shorter routes. Given this cost difference, the rapid growth in regional jets may appear somewhat surprising. However, currently many regional jet flights are flown on behalf of a major airline. Major airlines contract with regional airlines to incorporate regional jet flights into their network structure covering the cost of the flight on a fee-per-departure basis. Figure 21 shows the flight operating costs per flight. It can be seen from the figure that the costs of regional jets per flight are significantly lower than those of narrow body jets. Given the fee-per-departure structure of many contracts between major and 41
42 regional airlines, it can be seen that the regional aircraft flights are less expensive for the major airlines than their own narrow body flights Cost/ASM ($) B737 B757 A320 A319 CRJ200 CRJ700 EMB135 EMB145 EMB140 Figure 20: Flight Operating Costs per ASM Cost/Trip ($) B737 B757 A320 A319 CRJ200 CRJ700 EMB135 EMB145 EMB140 Figure 21: Flight Operating Costs per Trip 42
43 4.2.1 Regional Jet Costs as a Function of Stage Length While the above analysis provided information about each aircraft type, it did not provide any insight into how the costs of these aircraft would change if they were all used under the same operating conditions. In particular, the data doesn t show how operating costs per ASM and per departure change when flight distances are changed. As a result, the goal of the following analysis was to normalize the effect of stage length and compare the cost of regional and traditional jets if they were to fly the same routes. Changes in stage length were analyzed because, as shown in chapter 3, the stage length of regional jets has increased significantly between 1998 and If this trend continues, it is valuable to know what the effect on the cost of regional jets will be. In order to show the effects of changes in stage length on the overall operating cost per ASM and per trip it was assumed that flight operating costs scale linearly with the number of block hours flown. It was also assumed that maintenance costs, which are added to the flight operating costs to make up the total operating costs, scale with the number of take offs. In this analysis, the number of take offs was kept constant and as a result the maintenance costs did not change. While it may have been more accurate to use existing data and model costs using regression, not enough data points were available due to the small number of regional airlines that file Form 41 data. Once the costs could be modeled given changes in the stage length, the next step was to equalize the stage length in order to compare how expensive narrow body and regional jets would be if they were used on the same trips. The chosen stage length was 1000 miles. This number represents the rounded average of the base case narrow body jet stage lengths. The mathematical formulation of this model can be seen in Appendix F. 43

44 It can be seen from Figures 22 and 23 that regional jet costs per ASM and per trip both increase over the baseline case, but that the per trip costs increased by a higher percentage. This result indicates that if regional jets are flown on the same distance routes as traditional jet aircraft, the fee-per-departure payment structure will no longer make the regional jet a significantly cheaper alternative to a narrow body jet. For example, when the CRJ200 is compared to he B737 it can be seen that when the trip length is increased to 1000 miles, the costs per trip of the two aircraft become very similar. Furthermore, the costs per ASM will still remain much higher than those for traditional jets making regional jets a less economical choice. Figure 22: Comparison of Operating Cost per ASM with and without a change to Stage Length 44

45 Figure 23: Comparison of Operating Cost per Trip with and without a change to Stage Length Operating Cost as a Function of Pilot Cost The decision to investigate the effect of changes in pilot costs was made because the lower crew costs of regional jets are often cited as the reason why regional jets have been growing rapidly in the US [15]. As a result, it is valuable to know how regional jet costs compare to narrow body jet costs when crew costs between the two aircraft types are equalized. In order to show the effects of changes in crew costs on the overall operating cost per ASM and per trip it was assumed that pilots are paid per block hour of flight. The chosen pilot cost per block hour was $450, which is the average of the values for the narrow body jets, rounded to the nearest 50. Figures 24 and 25 show that regional jet costs increase in both cases, but the differences are not significant enough to make regional jets any more or less economical than traditional jets. Their cost per ASM is still significantly higher and the cost per trip 45
46 is still significantly lower than the cost of traditional jets. This indicates that the lower crew costs of regional jet operations are not the reason that regional jets are considered to be less expensive. Rather, as shown in the previous section the fee-per-departure is what makes the regional jet an affordable alternative to narrow body jets. Figure 24: Comparison of Operating Cost per ASM with and without a change to Pilot Costs 46
47 Figure 25: Comparison of Operating Cost per Trip with and without a change to Pilot Costs 4.3 Ownership Costs In addition to calculating how the operating costs changed with pilot costs and trip length, the change in costs when ownership expenses are taking into account is also of interest because this cost often accounts for a large percentage of the overall aircraft cost. However, From 41 data does not provide ownership cost information per aircraft type. As a result, in order to calculate the ownership cost for each aircraft type a list price for each aircraft was approximated based on a few published values [16] [17], a loan time of 20 years and an interest rate of 10% were assumed. The list prices for each aircraft can be seen in Table 6. It was also assumed that all the aircraft are owned not leased, or that the yearly cost of the lease is equivalent to the yearly amortized ownership cost under the conditions described above. 47
48 Table 6: List Prices by Aircraft Type Aircraft Type List Price B737 50,000,000 B757 75,000,000 A320 65,000,000 A319 50,000,000 CRJ2 40,000,000 CRJ7 40,000,000 E135 40,000,000 E140 40,000,000 E145 40,000,000 Once the ownership costs were calculated the total cost per ASM and per trip was found. Figures 26 and 27 show the comparison of costs per ASM and per trip for both the baseline case and the baseline case with the addition of ownership costs. It can be seen from Figure 26, that the cost per ASM of regional jets increases significantly when ownership costs are added. In fact, the figure shows that the cost per ASM of regional jets and narrow body jets is about equal if the ownership costs are included for the narrow body jets and not included for the regional jets. This indicates that the regional aircraft would have to be sold at a significant discount in order to equalize the cost per ASM of regional and narrow body jets. While the sale prices of aircraft are not known, there is evidence that both Bombardier and Embraer provide incentives in the form of low interest rates to make their regional jets more affordable: According to a dispute brought before the World Trade Organization (WTO), Bombardier and Embraer have both at different times complained that their sales are being undermined by the ability of the other company to offer substantially lower interest rates as a result of government support 48
![[18]. In contrast, when looking at the cost per trip the regional aircraft remain significantly less expensive then traditional jets.](/docs-images/74/70221156/images/49-1.jpg "Figure 26: Comparison of Operating Cost per ASM with and without Ownership Costs Figure 27: Comparison of Operating Cost per Trip with and without")
49 [18]. In contrast, when looking at the cost per trip the regional aircraft remain significantly less expensive then traditional jets. Figure 26: Comparison of Operating Cost per ASM with and without Ownership Costs Figure 27: Comparison of Operating Cost per Trip with and without Ownership Costs 49
50

51 5 Understanding Regional Jet Growth and Patterns 5.1 Reasons for Regional Jet Growth When regional jets were first introduced, they provided service similar to turboprops, and in many cases replaced turboprop aircraft and flights. Part of the reason for this replacement was the public perception, most likely caused by the fact that turboprops fly at lower and more turbulent altitudes, that turboprops are less safe than jets. However, soon after their introduction, regional jets began to fly longer distances and serve new markets. Figure 28 shows the changes caused by regional jet routes between 1992 and 2001, as well as between the start and end of As can be seen, while regional jets have supplemented and replaced both turboprop and traditional jet routes their primary function has been to create new routes. Figure 28: Change in Routes between 1998 and 2003 [19] 51
52 Regional jets have been successful in creating new routes because their smaller size means they can serve routes that do not have enough demand to warrant a traditional jet. While it was shown in the previous section that regional jets are more expensive per seat, because of yield management, having the right number of seats is more profitable than having more seats to spread the cost among. Yield management allows an airline to maximize yield by selling as many high priced tickets as possible. If an aircraft is correctly sized to the market it can be filled with high paying passengers and result in higher revenues. Passengers will compete for the available seats, and those willing to pay more will buy the tickets. However, if an aircraft is too large there are always available seats. As a result, the airline has to discount the ticket prices in order to fill enough seats to cover their costs. The addition of regional jets allowed major airlines to serve small, but profitable cities, which had been too far to efficiently serve with a turboprop and did not have enough demand to serve with a traditional jets. In addition, to airlines could expand and support their hub operations by using regional jets to feed passengers into the hub [20]. This utilization can be observed in Figure 29. The figure shows that rather than providing point to point service, over 90% of regional jet flights start or terminate at a hub or major airport. The list of airports considered as hubs for the purpose of this study can be seen in Appendix G. 52

53 Figure 29: Percentage of Regional Jet Flights Providing Service between Hub and Non-hub Airports While major airlines have benefited from the use of regional jets, as mentioned in the previous chapter, most do not directly own any regional aircraft. Instead, major airlines incorporate regional jet flights into their operations by having wholly-owned subsidiaries or by code sharing with small regional carriers. An example of a wholly owned subsidiary is American Eagle, where American is the owner company. Table 7 shows the list of regional jets used by regional carriers and the major airlines that they partner with. This structure ensures that regional jet crews are on a different pay scale and allows major airlines to pay the regional carriers on a per departure basis. 53
54 Table 7: US Regional Carrier and Code Share Partners [18] Aircraft Type E135 E145 CRJ1 CRJ2 CRJ7 BA46 Regional Carrier American Eagle Continental Express Republic American Eagle Continental Express Mesa Republic Trans State Comair Sky West Air Wisconsin Atlantic Southeast Mesa Sky West American Eagle Atlantic Southeast Comair Horizon Mesa Air Wisconsin Mesaba Code Share Partners/Carriers American Continental America West, Delta, US Airways American Continental America West, Frontier, US Airways America West, Delta, USAirways America, US Airways Delta Delta, United Air Tran, United Delta America West, Frontier, US Airways Delta, United American Delta Delta Alaska, Northwest America West, Frontier, US Airways Air Tran, United Northwest 5.2 Constraints on Regional Jet Growth The growth of regional jets, while rapid, would most likely have been faster if not for the restrictions placed on major airlines by scope clause agreements. Scope clauses are 54
55 part of labor contracts between airlines and airline pilots. They limit the number and size of regional jets that an airline can own, as well as cities or routes where the airlines can operate regional aircraft. Pilots working at major airlines are thwarting the growth of regional jets because they see them as a direct threat to their jobs. As shown earlier regional jets have created new routes, but have also replaced or supplemented traditional jet routes, taking jobs away from traditional jet pilots. In addition, traditional jet pilots can assume that they would have flown on some of the new routes created by incoming regional jets [19]. Finally, since most major airlines pay pilots based on the size of the aircraft they fly, the popularity of new smaller aircraft threatens not only their jobs, but their salaries as well. As a result, major airline pilots have fought back with scope clauses. An example of a simple scope clause agreement can be seen at Continental Airlines. The airline is allowed to operate any number of regional jets with fewer then 59 seats, but cannot own larger regional aircraft. Table 8 shows the fleet, as of December 2003, of Continental Express, now known as Express Jet, which is the regional partner for Continental Airlines [21]. It can be seen that the airline owns only regional jets with 50 seats or less rather than 59 seats or less. The reason for this difference is that there are no regional jets available with over 50, but fewer than 59 seats; the closest model after 50 seats has 70 seats. 55
56 Table 8: Continental Express RJ Fleet as of December 2003 Aircraft Type Number of Aircraft Number of Seats ERJ ERJ ERJ 145 XR Restrictions No restrictions on aircraft with under 59 seats As a result of the post 9/11 economic downturn many airlines have been facing financial problems and renegotiating their existing pilot contracts. As a result, the effect of scope clauses is likely to change. The changes in the scope clauses are complicated and it is unclear if they will result in an increase in regional jet operations. However, there is evidence that airlines are negotiating contract that will allow them to operate regional aircraft with a higher number of seats. Between the Fall of 2001 and 2003 United Airlines and USAirways both negotiated contacts that allow them to fly aircraft with additional 20 and 7 seats respectively. A summary of scope clause restrictions for both dates is provided by the Regional Air Service Initiative (RASI) and can be seen in Appendix H. 5.3 The Future of Regional Jets The future growth or regional jets depends on many factors, and as a result it is uncertain. However, it is known that in the next few years, both US Airways and Jet Blue will be receiving a large number of regional jets, which means that some growth in registrations will continue for at least the next few years. Figure 30 shows the past growth of regional jets and arrows depicting the uncertainty of future growth. Many airlines are currently in financial difficulty and it is unclear what the future successful 56

57 airline business model will look like, if it will include regional jets, and what the labor and code share arrangements will be like. It is possible that at some point the fee-perdeparture structure will change, making the use of regional jets less affordable. It is also possible that the partnerships between regional and major airlines will be disbanded. Atlantic Southeast has been a regional partner of United, but has announced that it will transition to operating independently [22]. Whether or not the airline will be successful may provide insight into the viability of regional jet economics. Figure 30: Past and Projected Growth of Regional Jets [21] While many of the major airlines are currently struggling financially, it is known that at some point in the future the economic situation will improve, and as a result, demand and capacity will grow as well. It is unclear whether, under increased demand, regional 57

58 jets will be able to provide the necessary amount of capacity, or if they will need to be replaced with narrow body jets or larger regional jets. If regional jets will have to be replaced, it is unclear what they will be used for. One possibility is that they will replace the remaining turboprops in the national fleet. Currently both Embraer and Bombardier are building larger regional jets, which can be seen in Figure 31. These new airplanes seat between 70 and 110 passengers, which means that the line between regional jets and narrow body traditional jets will blur further. Embraer believes that there is a capacity gap in the market and that the new 70 to 110 seat aircraft will help to fill that gap [23]. This new size of regional jets will further change the composition and performance range of the national fleet, making the future unclear. In addition, it was mentioned in chapter 4 that regional jets are most likely being sold at a discount or with highly favorable financing. If Embraer and Bombardier stop offering deals to stimulate the purchase of regional jets, the operational cost of these aircraft compared with narrow body jets will increase even further. Figure 31: Examples of an ERJ 190 (98 seats) and CRJ 900 (86 seats) 58
59 6 Comparison of Regional Jet, Traditional Jet, and Turboprop Performance 6.1 Performance Study Motivation In order to understand the implication of regional jet growth on the ATC and ATM systems, an analysis of the performance differences between regional jets and other aircraft was conducted. Possible implications of these differences are further discussed in chapter Comparison of Cruise Speeds and Altitudes The changes in the operational patterns of regional jets resulted in a change in observed regional jet performance. It is important to note that these changes in performance are not a result of increased capabilities of the aircraft, rather as regional jets began to be used less like turboprops their full capabilities could be utilized. The change in regional jet performance can be seen by looking at the change in primary cruise altitudes and cruise speeds flown by the aircraft. The primary cruise altitude was defined as the altitude at which the aircraft flew for the longest consecutive number of updates. Cruise speed is the average speed at the primary altitude. Once again the histograms are normalized to factor out the number of aircraft in each of the four categories. Figures 32 and 33 show the histograms of the primary cruise altitudes in January 1998 and 2003 respectively; histograms for other dates can be seen in Appendix I. It can be seen that 1998 the regional jet cruise at altitudes most similar to those of the turboprops. However, the regional jet distribution shows a higher percentage of flights 59
60 cruising above 150 flight level. In addition the peak of the turboprop distribution is at about 50 flight level, which is significantly lower than the peak of the regional jet distribution that occurs at about 200 flight level. Figure 33 shows that in 2003 the regional jet cruise altitude distribution fits almost exactly in between the turboprop and narrow body distributions. The peaks of the turboprop, regional jets, and narrow body distributions occur at about 150 flight level, 250 flight level, and 350 flight level respectively. Figure 32: January 1998 Histogram of Primary Cruise Altitudes 60
61 Figure 33: January 2003 Histogram of Primary Cruise Altitudes Figures 34 and 35 show the cruise speed distribution for all four aircraft categories in 1998 and 2003 respectively. More examples of speed histograms can be found in Appendix J. It can be seen that in 1998 regional jets flew at speeds very similar to those of the turboprops. This is most likely due to the fact that many regional jets shared cruise altitudes with turboprops and as a result had to conform to their speed capabilities. The plot also shows regional jets cruising at speeds between 300 and 500 miles per hour: those are most likely the regional jets sharing cruising altitudes with narrow bodies. Figure 35 shows the speed distributions in It can be seen that regional jets are now cruising at speeds very similar to the narrow body jets, with both distributions peaking at about 400 miles per hour. Based on the analysis of the cruise altitudes and speeds, it can be seen that while regional jets are capable of cruising at the same speeds and altitudes as narrow body jets, a significant number still fly lower. The most likely explanation for 61
62 this is that since regional jets fly shorter distances they are assigned lower cruise altitudes. In this way the aircraft do not have to cross traffic cruising at lower altitudes while they climb up to their cruising fight level and then cross it again when they descend. Figure 34: January 1998 Histogram of Average Cruise Speeds 62
63 Figure 35: January 2003 Histogram of Average Cruise Speeds 6.3 Comparison of Climb Rates In addition to the performance during cruise, climb rates were also analyzed. Figures 36 through 39 show the climb rate distributions for the A320, B737, CRJ2, and E145 respectively. More examples can be found in Appendix K. The figures show the climb rates a function of altitude for each aircraft type. The altitudes were grouped every 1000 ft, and the cells in the plot are colored according to the number of aircraft that climbed at a given rate during the 1000 ft increment. It can be seen from the plots that the regional jets climb slower than narrow body jets at all altitudes. Below 10,000 ft the speed of flight is restricted and as a result the climb rate profiles of all the aircraft type are similar. This speed restriction is also the reason for the sharp decrease in climb rates after 10,000 feet, where aircraft are using power to speed up rather to climb. The difference in climb 63
64 rates between the regional and narrow body jets is particularly noticeable between 10,000 and 20,000 ft. It is also interesting to point out that at altitudes over 20,000 ft the Embraer regional jets climb faster then the Bombardier jets. This is most likely because the Embraer jets choose climb rate over speed, where the Bombardier jets choose to fly faster and decrease the climb rate. The fact that regional jets climb slower then traditional jets may provide another explanation for why they cruise at lower altitudes. Controllers may level the aircraft sooner to prevent them from slowing down the departing traditional jet traffic. Figure 36: A320 Climb Rate Distribution 64

65 Figure 37: B737 Climb Rate Distribution Figure 38: CRJ2 Climb Rate Distribution 65
66 Figure 39: E145 Climb Rate Distribution 66
67 7 Possible Consequences of Regional Jet Growth It was shown in section 3 that regional jet operations have a high density in the same areas of the country as other aircraft categories, in particular narrow body jets and turboprops. The interaction of aircraft in these dense areas may result in operational problems since the different aircraft types do not exhibit the same performance. Regional jets were observed to exhibit lower climb rates than traditional jets, which may impact air traffic control handling and sector design. It was also observed that as regional jets replace turboprops, they compete for runways and take off trajectories with narrow body jets. The combination of the different performance and the competition for resources between regional and other jets, may pose problems for air traffic control. If problems are observed they will be congestion related, which will result in delays and increased workload for controllers. The problems can be broken down into three categories based on where in the system they may occur. The three categories are airport congestion, terminal area congestion, and en route congestion. 7.1 Airport Area In the airport, the main consequences resulting from increased regional jet operations will be congestion related and will be a result of aircraft competing for resources. Regional jets typically need to use the same runways as traditional jets, whereas turboprops often use shorter ones. As regional jets replace turboprops and as the number of regional jets increases, they will be competing for runway space, and may exacerbate congestion problems, as the number of operations per person will increase. To examine the likelihood of this problem, surface area diagrams for a few major airports 67
68 were examined. Figure 40 shows the surface diagram for ATL. It is clear from the figure that all the runways at this airport are long and therefore turboprop replacement by regional jets will not cause runway related delays. A slightly different situation exists at both Dallas Forth Worth (DFW) and Newark (EWR), as can be seen in Figures 42 and 43 respectively. In this case both airports have long or primary and short or secondary runways. While the secondary runways are still sufficient for use by regional jets, Newark airport released as study which showed that regional jet pilots are resistant to using them, citing safety concerns. As a result of this resistance, Newark recorded that the short runway usage decreased 65% between 1995 and 1999, while the number of regional jet operations increased 300%. Due to these changes Newark has experienced a significant increase in the usage of their primary arrival and departure runways and increased delays. [24] The congestion problems resulting from competition for primary runways can be alleviated by convincing regional jet pilots to use secondary runways whenever possible. This can be accomplished through either incentives and/or disincentives, such as higher landing fees for primary runways and lower fees for secondary runways. Providing pilot training to make the pilots feel that using the shorter runways is safe may also help the problem. However, if the regional jet pilots cannot be successfully convinced to use secondary runways there is the hope that new communication, navigation, and surveillance (CNS) technology will help decrease the required take off separation between aircraft and result in a higher utilization of the primary runways. 68


69 Figure 40: ATL Surface Diagram Figure 41: DFW Surface Diagram 69

70 Figure 42: EWR Surface Diagram 7.2 Terminal Area Airports may also see increased congestion on departure and arrival tracks. Figure 43 shows the flight tracks for departures from DFW on January 9th 2003 between 0000 and 0500 GMT. The black lines indicate turboprop trajectories, and the blue and green lines represent regional and traditional jet trajectories. It can be seen that regional and traditional jets align on the same tracks, while turboprops fly on separate routes. As regional jets replace turboprops and as the number of regional jets grows, an increase in congestion on the jet arrival and departure routes is expected. 70

71 Figure 43: DFW Take off Tracks for Departures between 0000 and 0500 GMT In addition to congestion issues due to an increase in operations, congestion and delay issues may also appear due to climb performance differences between regional and traditional jets. The slower climb rate of regional jets may increase the range of aircraft performance that controllers must manage in order to adhere to proper separation standards. Slower climb rates can change how regional jets interact with the sector structure. Many of the irregular sector shapes found in the current air traffic management system are a direct consequence of modifications targeted at reducing the number of sector boundary crossings. Boundary crossings are avoided due to the increased radio communications and coordination workload associated with each transition. Figure 44 shows climb rates overlaid with a hypothetical sector structure. It can be seen from the figure how the slower climb performance of regional jets could increase the number of sector boundary crossings. This implies that some departure sectors may need to be redesigned in order to accommodate this new range of aircraft performance. The dotted line in the figure shows the proposed new boundary for the lower sector. 71
72 Figure 44: Missed Sector Crossing due to Slow Climb Rate It was shown in Figure 43 that traditional jets and turboprops are separated into different tracks soon after departure, minimizing the interaction between the two aircraft types. This idea could be used to separate regional jet flights from other jet flights so that the slower climb of regional jets would not hold back the other aircraft, and so the jet take off tracks would not become too congested. However, many regional jet flights share cruise tracks with traditional jets and if the two aircraft types were separated they would have to be merged back together once at altitude. The separation and the subsequent merge would both increase the workload of the controllers. A better solution may be to simply level out the regional jets at a lower altitude so that the traditional jets can climb at an unobstructed rate. The histograms of speed and cruise altitudes, shown in Figures 32 through 35, suggest that controllers are already using this tactic, which would partially explain why regional jets cruise at a lower altitude then narrow body traditional jets even though they are capable of the same speeds during cruise. 72
73 To address the problem of missed sector transitions a number of possible solutions can be adopted. First, the trajectory between the origin and the boundary crossing point can be elongated to give the aircraft more time to climb. Second, the sector boundary can be moved either down or further. Finally, since when a missed crossing occurs the time that the aircraft spends in the addition sector is probably very brief, controller procedures that would allow the aircraft to cut through a corner of a sector without making a full transition can be used. 7.3 En Route Congestion In addition to congestion at the airport and terminal areas, there is also a concern for en route congestion where regional jets share routes with other jets. However, as shown in the previous section regional jets are capable of cruising at very similar speeds as narrow body jets, which means that their performance would not cause additional congestion. This does not mean that en route congestion is not a problem for air traffic control. As the number of planes in the system increases, and as the number of regional jets grows congestion issues will be more and more pressing. If the slight difference in the performance of regional and other jets becomes more significant, further separation of the two aircraft types by altitude will help to alleviate the problem. 7.4 Summary of ATC Concerns As shown above, the difference in the performance and the competition for resources between regional jets and other aircraft may create congestion problem for ATC. However, these problems will not affect all aspects of operations. In particular, it was shown that competition for resources may add to congestion problems at airports with 73
74 both primary and secondary runways and in jet arrival and departure tracks. It was also shown that regional jets exhibit a slower climb rate than traditional jets and as a result may slow down departing traffic and possibly result in missed sector transitions. It was also determined that the performance of regional jets during cruise will have little influence on congestion. 74
75 8 Conclusions 8.1 Summary of Findings Airlines are increasingly using regional jets to better match aircraft size to high value, but limited demand markets. The increase in regional jet usage represents a significant change from traditional air traffic patterns. To investigate the possible impacts of this change on the air traffic management and control systems, this study analyzed the emerging flight patterns and performance of regional jets compared to traditional jets and turboprops. This study used ASDI data, which consists of actual flight track data, to analyze flights between January 1998 and January In addition, a study of regional jet economics, using Form 41 data, was conducted in order to better understand the observed patterns. It was found that in 1998 US regional jet patterns and utilization closely resembled those of the turboprops. Both aircraft were used for hub feeder operations. They flew relatively short distances, under 500 nautical miles, and exhibited similar cruise altitudes and speeds. These patterns began to change as the number of regional jets increased. By January 2003, the regional jets were no longer used solely for hub feeder operations, but were flying longer routes at higher altitudes and faster speeds than turboprops. As a result, regional jets have come to fill a gap in the market by flying on longer routes than the turboprops, but shorter than the narrow body jets. An economic analysis was conducted in order to better understand the observed regional jet patterns. It was found that regional jets have lower operating costs per trip and higher operating costs per ASM than traditional jets. As a result, regional jets are 75
76 currently a lower cost alternative for traditional airlines because they cover the cost of regional jet flights on a per departure basis. However, if this structure were to change regional jets would become a less appealing alternative. To better understand the consequences of a change in the operation patterns, changes in the cost of regional and traditional jets were analyzed when trip length and pilot costs per block hour were normalized. It was found that regional jet costs per trip are very similar to traditional jet costs per trip when the trip length between the two aircraft categories is normalized, but that the normalization of pilot cost per block does not have a significant effect on the relative costs of the two aircraft types. In 2003, the US regional jet operations showed a high density of flights in the northeastern part of the country. This part of the US also has the largest concentration of traditional jet operations; this interaction may result in congestion problems since the two types of aircraft exhibit different performance. In particular, regional jets were observed to exhibit lower climb rates than traditional jets, which may impact air traffic control handling and sector design. It was also observed that as regional jets replace turboprops, they compete for runways and take off trajectories with narrow body jets. The combination of the different performance and the competition for resources between regional and other jets may result in increased delays and congestions as well as increased controller workload. The future growth of regional jets is uncertain. However, currently both US Airways and Jet Blue have placed orders for new Embraer aircraft indicating that the growth of regional jets will continue for the time being. In addition, both Embraer and Bombardier are currently designing and manufacturing larger regional jets. These aircraft will be 76
77 designed to accommodate more passengers on further trips and as a result will further change the composition and performance capabilities of the national fleet. 77
78 References [1] Canadair RJ Receives Certification. Business Aviation Weekly, January 25, 1993, Volume 56, Number 4. [2] FAA Registration Data from FAA website. Last accessed February 2004: [3] Embraer website. Last accessed January 2004: [4] Bombardier website. Last accessed January 2004: [5] Jane s website. Last accessed February 2004: [6] Aviation Week and Space Technology 2003 Aerospace Source Book, January [7] Boeing website. Last accessed February 2004: [8] William W. Trigero, The Impacts of Regional Jets on Congestion in the NAS. The MITRE Corporation, Technical Report [9] Volpe National Transportation Systems Center, Enhanced Traffic Management System (ETMS) Functional Description Version 7.6, August [10] Volpe Center Automation Applications Division, DTS-566, Aircraft Situational Display to Industry Functional Description and Interface Control Document, August [11] NEXRAD National Mosaic Reflectivity Images website. Last accessed March 2004: [12] Bureau of Transportation Statistics website. Last accessed March 2004: t_id2=0. [13] Joyce C. Lin, Visual Fight: The Air Traffic Control Data Analysis System. Master s Thesis. Massachusetts Institute of Technology, May [14] FAA website. Last accessed March 2004: [15] Adam Platt, Analysis: The Regional Jet Revolution, The Star Tribune, March 14, Last accessed April 2004: [16] Boeing Commercial Airline Pricing. Last accessed March 2004: 78
79 [17] The Canadair CRJ 100 and 200. Aviation Today, September 19, Last accessed April 2004: [18] Canada Export Credits and Loan Guarantees for Regional Aircraft Recourse by Brazil to Article 22.7 of the DSU and Article 4.10 of the SCM Agreement. World Trade Organization Case DS222, [19] Regional Air Service Initiative (RASI) website last accessed February 2004: [20] Richard A. Wynne, Future Trends in Regional Jet Development. Handbook of Airline Economics. Edited by Darryl Jenkins, Washington DC: McGraw Hill, pg [21] Continental website. Last accessed January 2004: [22] Atlantic Coast Airline Archive Page. Last accessed March [23] Embraer Rule presentation, accessed April 2004: [24] Leo Prusak, Impact of Regional Jets on Newark International Airport, Federal Aviation Administration, February
80 Appendix A. ASDI Filtering Algorithm The following is an excerpt from the Aircraft Situation Display To Industry Functional Description and Interface Document. It outlines the specific methods for filtering ETMS data before it can be passed on to vendors. 1. Check to see if the message is an allowed type. If not, e.g., the message is a BZ message, then the message is discarded; it does not go out in the ASDI feed. If it is valid, it is passed to the next step. 2. Look at the code in the message that shows the facility that generated the message. If the code is not in the configuration file that specifies legal facilities, then discard this message; it does not go out in the ASDI feed. If the code is in this file, then pass it to the next step. (Note: There are two feeds--one that contains London data and one that does not. This configuration file controls for each feed whether London data is included.) 3. Look at the aircraft call sign. If it is in the File of Forbidden Call Signs, then discard it; it does not go out in the ASDI feed. If it is not in this file, then pass it to the next step. (The File of Forbidden Call Signs, which is maintained by the Air Traffic Control System Command Center, contains call signs of non-military flights that are considered to be sensitive.) 4. Check to see if the call sign starts with 'N' followed by a digit followed by a digit or letter. That is, check to see if the first three characters of the call sign have the format 'Ndd' or Ndl', where 'd' stands for digit and 'l' for letter. If so, this is considered to be a GA flight; it goes out in the ASDI feed. If not, then this flight is passed to the next step. 5. Check to see if the call sign is exactly 5 letters, the first two of which are CF or CG. If so, this is considered to be a Canadian GA flight; it goes out in the ASDI feed. If not, then this flight is passed to the next step. 6. Check to see if the call sign starts with 'LN' followed by a digit followed by a digit or letter. That is, check to see if the first four characters of the call sign have the format 'LNdd' or LNdl', where 'd' stands for digit and 'l' for letter. If so, this is considered to be a lifeguard flight; it goes out in the ASDI feed. If not, then this flight is passed to the next step. 7. Check to see if the call sign starts with 'TN' followed by a digit followed by a digit or letter. That is, check to see if the first four characters of the call sign have the format 'TNdd' or TNdl', where 'd' stands for digit and 'l' for letter. If so, this is considered to 80
81 be an air taxi flight; it goes out in the ASDI feed. If not, then this flight is passed to the next step. 8. Check to see if the call sign is three letters followed by a digit. If not, the flight is considered to be military and is discarded; it does not go out in the ASDI feed. If so, this is considered to be a commercial flight; pass it to the next step. 9. Check the first three letters of the call sign to see if they represent an airline for which messages are to be sent in the feed. (The Radiotelephony file, which is maintained by the Air Traffic Control System Command Center, specifies the airlines whose messages are to be included in the feed.) If so, this message is sent out in the ASDI feed. If not, discard this flight; it does not go out in the ASDI feed. 81
82 Appendix B. ETMS Data Dates Used in Study The following is a list of the days for which data was obtained in order to conduct this research. Date(Y/M/D) Day 1998/01/22 Thursday 1999/01/21 Thursday 2000/01/13 Thursday 2001/01/11 Thursday 2002/01/10 Thursday 2003/01/09 Thursday 82
83 Appendix C. Classification of Aircraft into Categories The following is a list of aircraft included in each of the four aircraft categories. The % sign acts as a wild card, so that as long as what appears before the % sign is matched that aircraft type is included in the category. Narrow Body Traditional Jets: A318 A319 A32% B70% B71% B72% B73% B75% DC8% DC9% MD8% MD9% F70% F100 B4% Wide Body Traditional Jets: A30% A310 A312 A313 A31C A33% A34% B74% B76% B77% DC1% MD1% Regional Jets RJ% BA46 CRJ% E1% 83
84 Turboprops B190 SF34 DH8A DH8B BE20 C208 SW4 JS4 JS41 DH8C AT72 MU2 84
85 Appendix D. Distance Histograms Figure 45: January 1998 Distance Histogram Figure 46: January 1999 Distance Histogram 85
86 Figure 47: January 2000 Distance Histogram Figure 48: January 2001 Distance Histogram 86
87 Figure 49: January 2002 Distance Histogram Figure 50: January 2003 Distance Histogram 87


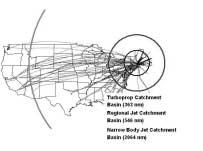
88 Appendix E. Catchment Basin Plots Figure 51: ATL Catchment Basin Changes between 1998 and 2003 Figure 52: BOS Catchment Basin Changes between 1998 and


89 Figure 53: CVG Catchment Basin Changes between 1998 and
90 Appendix F. Regional Jet Economic Model The economic model used to study and compare the cost structure of regional and traditional jet aircraft used in chapter 4 calculates the total aircraft expenses according to the following formula: where: New _ Total _Cost = [(OFOE OPC + ( NPC NBH )*NBH)* ] + MC + OC OBH OBH OFOE OPC NPC OBH NBH MC OC Old Flight Operating Costs Old Pilot Costs New Pilot Costs Old Block Hours New Block Hours Maintenance Costs Operating Costs As can be seen the flight operating costs are scaled with block hours, the maintenance costs were scaled according to the number of flights (which remained constant), and the ownership costs were calculated based on estimated price of aircraft as well as an assumed loan time and interest. When calculating the cost per ASM, a new value for ASMs needed to be calculated if trip length changed. This calculation was done according to the following fomula: New _ ASM =# Seats* Trip_ Length*#Trips 90
91 Appendix G. List of Hub and Major Airports The following is a list of the codes and name of airports that were counted as hubs for the point-point service study. ATL The William B Hartsfield Atlanta International Airport BOS General Edward Lawrence Logan International Airport ORD Chicago O'Hare International Airport LGA La Guardia Airport JFK John F Kennedy International Airport EWR Newark Liberty International Airport PHL Philadelphia International Airport BWI Baltimore-Washington International Airport DCA Ronald Reagan Washington National Airport PIT Pittsburgh International Airport IAD Washington Dulles International Airport RDU Raleigh-Durham International Airport CLT Charlotte Airport MIA Miami International Airport CLE Cleveland Airport DTW Detroit Metro Airport CVG Cincinnati/Northern Kentucky International Airport MEM Memphis International Airport STL St Louis International Airport MSP Minneapolis-St. Paul International Airport DFW Dallas/Fort Worth International Airport IAH George Bush Intercontinental Airport/Houston DEN Denver International Airport SLC Salt Lake City International Airport PHX Phoenix Sky Harbor International Airport LAX Los Angeles International Airport SFO San Francisco International Airport SEA Seattle-Tacoma International Airport 91
92 Appendix H. Summary of Scope Clause Restrictions The Regional Air Service Initiative compiled the following scope clause restriction summary. [18] 92
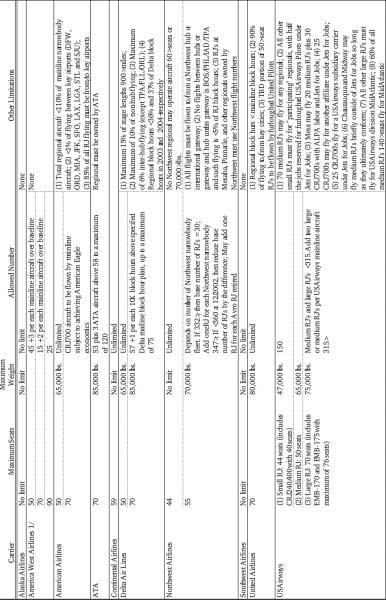
93 93
94 Appendix I. Cruise Altitude Histograms Figure 54: January 1998 Primary Cruise Altitude Histogram Figure 55: January 1999 Primary Cruise Altitude Histogram 94
95 Figure 56: January 2000 Primary Cruise Altitude Histogram Figure 57: January 2001 Primary Cruise Altitude Histogram 95
96 Figure 58: January 2002 Primary Cruise Altitude Histogram Figure 59: January 2003 Primary Cruise Altitude Histogram 96
97 Appendix J. Cruise Speed Histograms Figure 60: January 1998 Average Cruise Speed Histogram Figure 61: January 1999 Average Cruise Speed Histogram 97
98 Figure 62: January 2000 Average Cruise Speed Histogram Figure 63: January 2001 Average Cruise Speed Histogram 98
99 Figure 64: January 2002 Average Cruise Speed Histogram Figure 65: January 2003 Average Cruise Speed Histogram 99
100 Appendix K. Climb Rate Distributions Figure 66: A319 Climb Rate Distribution January 2003 Figure 67: A320 Climb Rate Distribution January
101 Figure 68: B733 Climb Rate Distribution January 2003 Figure 69: B737 Climb Rate Distribution January
102 Figure 70: CRJ1 Climb Rate Distribution January 2003 Figure 71: CRJ2 Climb Rate Distribution January


103 Figure 72: E135 Climb Rate Distribution January 2003 Figure 73: E145 Climb Rate Distribution January
Passengers Boarded At The Top 50 U. S. Airports ( Updated April 2
 (Ranked By Passenger Enplanements in 2006) Airport Table 1-41: Passengers Boarded at the Top 50 U.S. Airportsa Atlanta, GA (Hartsfield-Jackson Atlanta International) Chicago, IL (Chicago O'Hare International)
World Class Airport For A World Class City
 World Class Airport For A World Class City Air Service Update December 2018 2018 Air Service Updates February 2018 Delta Air Lines Seattle new departure, seasonal, 2x weekly Delta Air Lines Boston new
World Class Airport For A World Class City
 World Class Airport For A World Class City Air Service Update October 2017 2017 Air Service Updates February 2017 Cleveland new destination, 2x weekly Raleigh-Durham new destination, 2x weekly March 2017
World Class Airport For A World Class City
 World Class Airport For A World Class City Air Service Update April 2017 2017 Air Service Updates February 2017 Cleveland new destination, 2x weekly Raleigh-Durham new destination, 2x weekly March 2017
Observations and Potential Impacts of Regional Jet Operating Trends
 Observations and Potential Impacts of Regional Jet Operating Trends Aleksandra Mozdzanowska, R. John Hansman Massachusetts Institute of Technology International Center for Air Transportation, Cambridge,
World Class Airport For A World Class City
 World Class Airport For A World Class City Air Service Update April 2018 2018 Air Service Updates February 2018 Seattle new departure, seasonal, 2x weekly Boston new departure, seasonal, 2x weekly March
TravelWise Travel wisely. Travel safely.
 TravelWise Travel wisely. Travel safely. The (CATSR), at George Mason University (GMU), conducts analysis of the performance of the air transportation system for the DOT, FAA, NASA, airlines, and aviation
2016 Air Service Updates
 Air Service Update May 2016 2016 Air Service Updates February 2016 Pittsburgh new destination, 2x weekly April 2016 Los Angeles new departure, 1x daily Atlanta new departure, 1x daily Jacksonville new
2016 Air Service Updates
 Air Service Update June 2016 2016 Air Service Updates February 2016 Pittsburgh new destination, 2x weekly April 2016 Los Angeles new departure, 1x daily Atlanta new departure, 1x daily Jacksonville new
2016 Air Service Updates
 Air Service Update September 2016 2016 Air Service Updates February 2016 Pittsburgh new destination, 2x weekly April 2016 Los Angeles new departure, 1x daily Atlanta new departure, 1x daily Jacksonville
The O Hare Effect on the System
 The O Hare Effect on the System Diane Boone and Joseph Hollenberg The MITRE Corporation s Center for Advanced Aviation System Development with the Federal Aviation Administration s Managers of Tactical
2016 Air Service Updates
 2016 Air Service Updates February 2016 Pittsburgh new destination, 2x weekly April 2016 Los Angeles new departure, 1x daily Atlanta new departure, 1x daily Jacksonville new destination, 2x weekly Philadelphia
2012 Airfares CA Out-of-State City Pairs -
 2012 Airfares Out-of-State City Pairs - Contracted rates are from July 1, 2012 through June 30, 2013. Please note all fares are designated as () and ( ) in airline computer reservation systems. fares are
Uncertainty in Airport Planning Prof. Richard de Neufville
 Uncertainty in Airport Planning Prof. Richard de Neufville Istanbul Technical University Air Transportation Management M.Sc. Program Airport Planning and Airport Planning and Management Module 06 January
DEPARTMENT OF HOMELAND SECURITY U.S. CUSTOMS AND BORDER PROTECTION. CBP Dec. No EXPANSION OF GLOBAL ENTRY TO NINE ADDITIONAL AIRPORTS
 This document is scheduled to be published in the Federal Register on 10/04/2016 and available online at https://federalregister.gov/d/2016-23966, and on FDsys.gov 9111-14 DEPARTMENT OF HOMELAND SECURITY
AGENCY: U.S. Customs and Border Protection; Department of Homeland Security.
 This document is scheduled to be published in the Federal Register on 06/25/2013 and available online at http://federalregister.gov/a/2013-15087, and on FDsys.gov 9111-14 DEPARTMENT OF HOMELAND SECURITY
Industry Voluntary Pollution Reduction Program (VPRP) for Aircraft Deicing Fluids
 for Aircraft Deicing Fluids") Industry Voluntary Pollution Reduction Program (VPRP) for Aircraft Deicing Fluids Background/ Discussion Overview Chad E. Leqve Director Environment Minneapolis/St. Paul Metropolitan Airports Commission
Industry Voluntary Pollution Reduction Program (VPRP) for Aircraft Deicing Fluids Background/ Discussion Overview Chad E. Leqve Director Environment Minneapolis/St. Paul Metropolitan Airports Commission
Beyond Measure jdpower.com North America Airport Satisfaction Study
 Beyond Measure jdpower.com 2017 North America Airport Satisfaction Study 2017 North America Airport Satisfaction Study Publish Date: September 21, 2017 Why do passengers love going to some airports and
Brian Ryks Executive Director and CEO
 Brian Ryks Executive Director and CEO MAC Commissioners MAC Finances 2016 Budgeted Operating Revenues Utilities and Other 5% Airline Rates and Charges 34% Rents and Fees 14% Concessions 47% 2016 Budgeted
Distance to Jacksonville from Select Cities
 Distance to Jacksonville from Select Cities Source: Mapquest.com, Expedia.com, ManagementReporting.com City Miles Driving Time (Hrs) Atlanta, GA 347 5.75 1 Boston, MA 1,160 18.5 4 Chicago, IL 1,063 17.5
Have Descents Really Become More Efficient? Presented by: Dan Howell and Rob Dean Date: 6/29/2017
 Have Descents Really Become More Efficient? Presented by: Dan Howell and Rob Dean Date: 6/29/2017 Outline Introduction Airport Initiative Categories Methodology Results Comparison with NextGen Performance
Megahubs United States Index 2018
 Published: Sep 2018 Megahubs United States Index 2018 The Most Connected Airports in the US 2018 OAG Aviation Worldwide Limited. All rights reserved About OAG Megahubs US Index 2018 Published alongside
79006 AIR TRAVEL SERVICES 2001 AWARD
 Group 79006 AIR TRAVEL SERVICES 2001 AWARD Page 6 Office of General Services - Procurement Services Group Delta Air Lines Albany, NY - Albuquerque, NM ALB - ABQ 901.00 313.00 293.00 420 Delta Air Lines
PITTSBURGH INTERNATIONAL AIRPORT ANALYSIS OF SCHEDULED AIRLINE TRAFFIC. October 2016
 ANALYSIS OF SCHEDULED AIRLINE TRAFFIC October 2016 Passenger volume Pittsburgh International Airport enplaned passengers totaled 379,979 for the month of October 2016, a 7.0% increase from the previous
SEPTEMBER 2014 BOARD INFORMATION PACKAGE
 SEPTEMBER 2014 BOARD INFORMATION PACKAGE MEMORANDUM TO: Members of the Airport Authority FROM: Lew Bleiweis, Executive Director DATE: September 19, 2014 Informational Reports: A. July, 2014 Traffic Report
Lower Income Journey to Work Market Share From American Community Survey
 Lower Income Journey to Work Market Share From American Community Survey 2006-2010 Table 1: Overall National Data Table 2: Car, Truck or Van Table 3: Transit Table 4: Metrics Table 1 Work Trip Market Share:
OAG s Top 25 US underserved routes. connecting the world of travel
 OAG s Top 25 US underserved routes connecting the world of travel Underserved Uncovered: OAG s Top 50 underserved international routes Contents About OAG s underserved uncovered 3 About the data 3 OAG
Aviation Gridlock: Airport Capacity Infrastructure How Do We Expand Airfields?
 Aviation Gridlock: Airport Capacity Infrastructure How Do We Expand Airfields? By John Boatright Vice President - Delta Air Lines Properties and Facilities Issue What can be done to expand airfield capacity?
What Does the Future Hold for Regional Aviation?
 What Does the Future Hold for Regional Aviation? FAA Aviation Forecast Conference March 10, 2010 HCH T C George W. Hamlin Hamlin Transportation Consulting Fairfax, Virginia www.georgehamlin.com Taxonomy
Impact of Advance Purchase and Length-of-Stay on Average Ticket Prices in Top Business Destinations
 Impact of Advance Purchase and Length-of-Stay on Average Ticket Prices in Top Business Destinations Research Summary Average ticket prices continue to trend downward in 2016, but since 2014 there have
J.D. Power and Associates Reports: Customer Satisfaction with Airports Declines Sharply Amid an Industry Fraught with Flight Delays
 J.D. Power and Associates Reports: Customer Satisfaction with Airports Declines Sharply Amid an Industry Fraught with Flight Delays Philadelphia International, Chicago Midway International and Dallas Love
Place image here (10 x 3.5 ) FAA NEXTGEN DATA COMM TOWER SERVICE: CPDLC DCL NEW OPERATOR INTRODUCTION HARRIS.COM #HARRISCORP
 FAA NEXTGEN DATA COMM TOWER SERVICE: CPDLC DCL NEW OPERATOR INTRODUCTION HARRIS.COM #HARRISCORP") Place image here (10 x 3.5 ) FAA NEXTGEN DATA COMM TOWER SERVICE: CPDLC DCL NEW OPERATOR INTRODUCTION HARRIS.COM #HARRISCORP Data Communication Basics Voice communication frequencies between pilots and
Place image here (10 x 3.5 ) FAA NEXTGEN DATA COMM TOWER SERVICE: CPDLC DCL NEW OPERATOR INTRODUCTION HARRIS.COM #HARRISCORP Data Communication Basics Voice communication frequencies between pilots and
Temporal Deviations from Flight Plans:
 Temporal Deviations from Flight Plans: New Perspectives on En Route and Terminal Airspace Professor Tom Willemain Dr. Natasha Yakovchuk Department of Decision Sciences & Engineering Systems Rensselaer
MIT ICAT. Price Competition in the Top US Domestic Markets: Revenues and Yield Premium. Nikolas Pyrgiotis Dr P. Belobaba
 Price Competition in the Top US Domestic Markets: Revenues and Yield Premium Nikolas Pyrgiotis Dr P. Belobaba Objectives Perform an analysis of US Domestic markets from years 2000 to 2006 in order to:
A Decade of Consolidation in Retrospect
 A Decade of Consolidation in Retrospect MARCH 7, 2017 CONSOLIDATION TIMELINE Airlines Announced Closed SOC US Airways- America West Delta- Northwest Frontier- Midwest United- Continental Southwest- AirTran
Hector International Airport Fargo, North Dakota
 Hector International Airport Fargo, North Dakota Volume 073 Twelve Months Ended September 2007 January 2008 Airlines Serving Fargo Carried 831 Onboard Passengers Per Day for the Twelve Months Ended September
Description of the National Airspace System
 Description of the National Airspace System Dr. Antonio Trani and Julio Roa Department of Civil and Environmental Engineering Virginia Tech What is the National Airspace System (NAS)? A very complex system
Aviation Insights No. 5
 Aviation Insights Explaining the modern airline industry from an independent, objective perspective No. 5 November 16, 2017 Question: How has air travel in specific metropolitan areas changed in recent
Airport Profile Pensacola International
 Airport Profile Pensacola International 2015 BY THE NUMBERS Enplanements 808,170 Airport Pensacola International Airport (PNS) is located approximately three nautical miles northeast of the central business
Airports Council International North America Air Cargo Facilities and Security Survey
 Airports Council International North America 2011 Air Cargo Facilities and Security Survey 2011 ACI NA Air Cargo Committee Air Cargo Conference June, 2011 Contact: Economic Affairs and Research Tel: 202
The Airport Credit Outlook
 The Airport Credit Outlook Peter Stettler Ricondo & Associates, Inc. National Federation of Municipal Analysts National Conference April 19, 2012 Las Vegas, Nevada The Outlook for Airports Recent Trends
Benefits Analysis of a Runway Balancing Decision-Support Tool
 Benefits Analysis of a Runway Balancing Decision-Support Tool Adan Vela 27 October 2015 Sponsor: Mike Huffman, FAA Terminal Flight Data Manager (TFDM) Distribution Statement A. Approved for public release;
Puget Sound Trends. Executive Board January 24, 2019
 Puget Sound Trends Executive Board January 24, 2019 Overview Topics covered in today s presentation: How many jobs are there? Housing Trends Where do people work? How long does it take to get to work?
Questions regarding the Incentive Program should be directed to Sara Meess at or by phone at
 Ogden-Hinckley New Entrant Incentive Program Request for Letters of Interest Amendment No. 1 The City of Ogden, Utah (the City ) is seeking Letters of Interest from air carriers not currently serving the
Uncertainty in Airport Planning Prof. Richard de Neufville
 Uncertainty in Airport Planning Prof. Richard de Neufville Istanbul Technical University Air Transportation Management M.Sc. Program Airport Planning and Management / RdN Airport Planning and Management
ELS Language Centers 2019 USA Pricing
 ELS Language Centers 2019 USA Pricing Tuition and Fees 2019 The 2019 prices are effective for all new applications for 2019 courses received by ELS after September 17, 2018. General Fees General Fees Description
Hector International Airport Fargo, North Dakota
 Hector International Airport Fargo, North Dakota Volume 072 Twelve Months Ended June 2007 November 2007 Airlines Serving Fargo Carried 830 Onboard Passengers Per Day for the Twelve Months Ended June 2007,
BLACK KNIGHT HPI REPORT
 CONTENTS 1 OVERVIEW 2 NATIONAL OVERVIEW 3 LARGEST STATES AND METROS 4 FEBRUARY S BIGGEST MOVERS 5 20 LARGEST STATES 6 40 LARGEST METROS 7 ADDITIONAL INFORMATION OVERVIEW Each month, the Data & Analytics
October Air Traffic Statistics. Prepared by the Office of Corporate Risk and Strategy
 October 214 Air Traffic Statistics Prepared by the Office of Corporate Risk and Strategy Metropolitan Washington Airports Authority Air Traffic Statistics Table of Contents Summary Air Traffic Summary...
3 Aviation Demand Forecast
 3 Aviation Demand 17 s of aviation demand were prepared in support of the Master Plan for Harrisburg International Airport (the Airport or HIA), including forecasts of enplaned passengers, air cargo, based
Capacity Constraints and the Dynamics of Transition in the US Air Transportation
 MIT ICAT Capacity Constraints and the Dynamics of Transition in the US Air Transportation Prof. R. John Hansman Alexandra Mozdzanowska, Philippe Bonnefoy MIT Department of Aeronautics and Astronautics
ACI 2008 WORLDWIDE AIRPORT TRAFFIC STATISTICS
 WORLD AIRPORT RANKING BY TOTAL PASSENGERS TOTAL PASSENGERS 1 ATLANTA GA ATL 90 039 280 0.7 2 CHICAGO IL ORD 69 353 876 ( 9.0) 3 LONDON LHR 67 056 379 ( 1.5) 4 TOKYO HND 66 754 829 ( 0.2) 5 PARIS CDG 60
PUBLIC TRANSPORTATION INTRODUCTION
 PUBLIC TRANSPORTATION INTRODUCTION 1 OUTLINE Current Status and Recent Trends Significant Influences A Critical Assessment Arguments Supporting Public Transport Future Influences Ingredients for Future
CANSO Workshop on Operational Performance. LATCAR, 2016 John Gulding Manager, ATO Performance Analysis Federal Aviation Administration
 CANSO Workshop on Operational Performance LATCAR, 2016 John Gulding Manager, ATO Performance Analysis Federal Aviation Administration Workshop Contents CANSO Guidance on Key Performance Indicators Software
PFC Collection Analysis
 PFC Collection Analysis 8:40 9:30am June 11, 2018 2018 BUSINESS OF AIRPORTS Airport/Airline Business Working Group Analysis of declining trend in PFC-paying passengers Background U.S. Airport Infrastructure
FAA Call to Action on Runway Safety Short-term Actions. By Glenn Michaël (FAA)
") FAA Call to Action on Runway Safety Short-term Actions By Glenn Michaël (FAA) Background Information On August 15, 2007 the Administrator issued a call to action to the industry to re-energize and re-focus
FAA Call to Action on Runway Safety Short-term Actions By Glenn Michaël (FAA) Background Information On August 15, 2007 the Administrator issued a call to action to the industry to re-energize and re-focus
FAA Progress on Wake Avoidance Solutions for Closely Spaced Parallel Runways (CSPR)
") FAA Progress on Wake Avoidance Solutions for Closely Spaced Parallel Runways (CSPR) WakeNet-Europe Workshop 2015 April 2015 Amsterdam, The National Aerospace Laboratory (NLR) Tittsworth (FAA Air Traffic
FAA Progress on Wake Avoidance Solutions for Closely Spaced Parallel Runways (CSPR) WakeNet-Europe Workshop 2015 April 2015 Amsterdam, The National Aerospace Laboratory (NLR) Tittsworth (FAA Air Traffic
Hector International Airport Fargo, North Dakota
 Hector International Airport Fargo, North Dakota Volume 081 Twelve Months Ended March 2008 July 2008 Airlines Serving Fargo Carried 838 Onboard Passengers Per Day for the Twelve Months Ended March 2008,
A Methodology for Environmental and Energy Assessment of Operational Improvements
 A Methodology for Environmental and Energy Assessment of Operational Improvements Presented at: Eleventh USA/Europe Air Traffic Management Research and Development Seminar (ATM2015 ) 23-26 June 2015, Lisbon,
MINNESOTA. Regional Air Service Study. The KRAMER Team
 MINNESOTA Regional Air Service Study The KRAMER Team June, 2003 Today s Topics Tier 2 Demand Profile Context for Possibilities (The Industry) Air Service Options Likely Build-out Facility Implications
2011 AIRPORT UPDATE. March 25, 2011
 2011 AIRPORT UPDATE March 25, 2011 1 Airports are important economic engines for the regions they serve; creating jobs, facilitating commerce and providing access to the global marketplace 2 AIRPORT HIGHLIGHTS
September Air Traffic Statistics. Prepared by the Office of Corporate Risk and Strategy
 September 214 Air Traffic Statistics Prepared by the Office of Corporate Risk and Strategy Air Traffic Summary September 214 Commercial Total Dom Int'l Passengers % Change Passenger Activity (in Millions)
Trusted Traveler Program Overview and Best Practices. February 2017
 Trusted Traveler Program Overview and Best Practices February 2017 Risk-Based Passenger Security In September 2011, TSA began undertaking efforts to adopt an intelligence-driven and risk-based approach
The Airline Quality Rating 2002
 University of Nebraska Omaha DigitalCommons@UNO Faculty Books and Monographs 4-2002 The Airline Quality Rating 2002 Brent D. Bowen University of Nebraska at Omaha Dean Headley Wichita State University
Airport Networks Are Putting Your Devices & Cloud Apps at Severe Risk
 Networks Are Putting Your Devices & Cloud Apps at Severe Risk TABLE OF CONTENTS Executive Summary The Cyber Risk to All Passengers Methodology Most Vulerable s Least Vulnerable Regions Complete Rankings
Air France is proud to be the first European airline to fly the A380
 InFocus n e w l e t t e r Continental will join Star Alliance This fall, Continental will join Star Alliance and also begin to cooperate closely with United Airlines, linking our networks and services
September Air Traffic Statistics. Prepared by the Office of Marketing & Consumer Strategy
 September 217 Air Traffic Statistics Prepared by the Office of Marketing & Consumer Strategy This report includes only data submitted by airlines as of the date of publication: November 15, 217. Reports
Associates 2009 Rental Car Satisfaction Study SM (Page 1 of 2)
") Reports: Although Technology May Help Improve the Airport Experience, the Basics Have the Greatest Impact on Passenger Satisfaction Detroit Metropolitan Wayne County, Indianapolis International and Kansas
Reports: Although Technology May Help Improve the Airport Experience, the Basics Have the Greatest Impact on Passenger Satisfaction Detroit Metropolitan Wayne County, Indianapolis International and Kansas
WH Smith PLC Acquisition of InMotion providing access to the world s largest travel retail market 30 October 2018
 WH Smith PLC Acquisition of InMotion providing access to the world s largest travel retail market 30 October 2018 Transaction highlights WH Smith announces acquisition of InMotion for $198m ( 155 million)
Managing And Understand The Impact Of Of The Air Air Traffic System: United Airline s Perspective
 Managing And Understand The Impact Of Of The Air Air Traffic System: United Airline s Perspective NEXTOR NEXTOR Moving Moving Metrics: Metrics: A Performance-Oriented View View of of the the Aviation Aviation
Airline Mergers and Consumers. Before the US DOT Advisory Committee for Aviation Consumer Protection
 Airline and Consumers Before the US DOT Advisory Committee for Aviation Consumer Protection Daniel M. Kasper October 29th, 2014 Presentation Overview 1. Key drivers of airline consolidation a) Relentless
November Air Traffic Statistics. Prepared by the Office of Corporate Risk and Strategy
 November 214 Air Traffic Statistics Prepared by the Office of Corporate Risk and Strategy Air Traffic Statistics Table of Contents Summary Air Traffic Summary... 1 SH&E Air Traffic Schedule Activity...
Appendix B Ultimate Airport Capacity and Delay Simulation Modeling Analysis
 Appendix B ULTIMATE AIRPORT CAPACITY & DELAY SIMULATION MODELING ANALYSIS B TABLE OF CONTENTS EXHIBITS TABLES B.1 Introduction... 1 B.2 Simulation Modeling Assumption and Methodology... 4 B.2.1 Runway
QUARTERLY NOISE REPORT For: California Department of Transportation
 QUARTERLY NOISE REPORT For: California Department of Transportation 1st Quarter 2015 January 1 March 31, 2015 Airport Noise Mitigation June 12, 2015 TABLE OF CONTENTS Summary of Statistical Information
Terminal Area Forecast Summary
 Terminal Area Forecast Summary Fiscal Years 2003-2020 U.S. Department of Transportation Federal Aviation Administration FAA-APO-04-1 March 2004 Acknowledgments This document was prepared by the Statistics
January Air Traffic Statistics. Prepared by the Office of Marketing & Consumer Strategy
 January 218 Air Traffic Statistics Prepared by the Office of Marketing & Consumer Strategy This report includes only data submitted by airlines as of the date of publication: March 21, 218. Reports are
Naples Municipal Airport Master Plan. Joint NAA / NCC Workshop April 30, 2018
 Naples Municipal Airport Master Plan Joint NAA / NCC Workshop April 30, 2018 Airport Master Planning Process Project Initiation Stakeholder and Public Outreach Airport Mapping and AGIS Existing Conditions
The Airline Quality Rating 2002
 The Airline Quality Rating 2002 Brent D. Bowen University of Nebraska at Omaha Aviation Institute Dean E. Headley Wichita State University W. Frank Barton School of Business April, 2002 What the Airline
Agenda. 1. Reduce Airline Cost. 2. Develop Airport Related Businesses. 3. Provide Customer Friendly Facilities and Services. 4. Expand Air Service
 O N T Agenda 1. Reduce Airline Cost 2. Develop Airport Related Businesses 3. Provide Customer Friendly Facilities and Services 4. Expand Air Service Agenda 1. Reduce Airline Cost Reduce Airline Cost Reduce
Kansas City Aviation Department. Update to Airport Committee January 26, 2017
 Kansas City Aviation Department Update to Airport Committee January 26, 2017 1 Status of Customer Service Improvements Additional electric outlets in public areas Review Wi-Fi speed / coverage / study
Approximate Network Delays Model
 Approximate Network Delays Model Nikolas Pyrgiotis International Center for Air Transportation, MIT Research Supervisor: Prof Amedeo Odoni Jan 26, 2008 ICAT, MIT 1 Introduction Layout 1 Motivation and
Factors Influencing Visitor's Choices of Urban Destinations in North America
 Factors Influencing Visitor's Choices of Urban Destinations in North America Ontario Ministry of Tourism and Recreation May 21, 2004 Study conducted by Global Insight Inc. Executive Summary A. Introduction:
MIT ICAT EMERGENCE OF SECONDARY AIRPORTS AND DYNAMICS OF REGIONAL AIRPORT SYSTEMS IN THE UNITED STATES. Philippe A. Bonnefoy and R.
 MIT ICAT EMERGENCE OF SECONDARY AIRPORTS AND DYNAMICS OF REGIONAL AIRPORT SYSTEMS IN THE UNITED STATES Philippe A. Bonnefoy and R. John Hansman Report No. ICAT-2005-02 May 2005 MIT International Center
Rankings of Major U.S. Airports. Total Passengers 2016
 Rankings of Major U.S. Airports Total Passengers Total Passengers (Millions) 1 Hartsfield Atlanta Int'l (ATL) Atlanta 104.2 2.6 2 Los Angeles Int'l (LAX) Los Angeles 80.9 8.0 3 O'Hare Int'l (ORD) Chicago
Investor Update April 22, 2008
 JetBlue Airways Investor Relations Lisa Studness (718) 709-2202 ir@jetblue.com Investor Update April 22, 2008 This investor update provides our investor guidance for the second quarter ending June 30,
The Anatomy of Delays:
 The Anatomy of Delays: Complexity and Interconnectivity of NAS Traffic Flow Agam N. Sinha Diane E. Boone 16 February 2001 Topics Background Three scenarios from actual operations in June 2000 A. Widespread
Federal Perspectives on Public-Private Partnerships (P3) in the United States
 in the United States") Federal Perspectives on Public-Private Partnerships (P3) in the United States Prepared for: ACI-World Bank Symposium London, United Kingdom Presented by: Elliott Black Director Office of Airport Planning
Federal Perspectives on Public-Private Partnerships (P3) in the United States Prepared for: ACI-World Bank Symposium London, United Kingdom Presented by: Elliott Black Director Office of Airport Planning
Frequent Fliers Rank New York - Los Angeles as the Top Market for Reward Travel in the United States
 Issued: April 4, 2007 Contact: Jay Sorensen, 414-961-1939 IdeaWorksCompany.com Frequent Fliers Rank New York - Los Angeles as the Top Market for Reward Travel in the United States IdeaWorks releases report
North America s Fastest Growing Airports 2018
 connecting the world of travel North America s Fastest Growing Airports 2018 2018 OAG Aviation Worldwide Limited. 1 THE HUBS Over 20m departing seats Data for the 12-months from May 2017 to April 2018
Monthly Employment Watch: Milwaukee and the Nation's Largest Cities
 Monthly Employment Watch: Milwaukee and the Nation's Largest Cities A monthly report on employment trends in the nation s largest cities Prepared by: The University of Wisconsin-Milwaukee Center for Economic
Higher Education in America s Metropolitan Areas A Statistical Profile
 Higher Education in America s Metropolitan Areas A Statistical Profile MSA Study No.2 Higher Education in America s Metropolitan Areas A Statistical Profile CONTENTS Why Metro Areas? 1 Executive Summary
Runway Length Analysis Prescott Municipal Airport
 APPENDIX 2 Runway Length Analysis Prescott Municipal Airport May 11, 2009 Version 2 (draft) Table of Contents Introduction... 1-1 Section 1 Purpose & Need... 1-2 Section 2 Design Standards...1-3 Section
Rank Place State Native Hawaiian and Pacific Islander population (alone or in combination
 TABLE 2a: 100 Largest Places Ranked by Number of s (race alone or in *) Living in Hard-to- Census Rank Place State (alone or in 1 Honolulu (CDP) HI 64,196 11,130 17.3 2 New York City NY 14,981 8,211 54.8
Access Across America: Transit 2014
 Access Across America: Transit 2014 Final Report CTS 14-11 Prepared by: Andrew Owen David Levinson Accessibility Observatory Department of Civil, Environmental, and Geo- Engineering University of Minnesota
Transportation: Airlines
 Transportation: Airlines In times of peace, approximately 8 million people take a plane trip each day. Wright brother s first plane: 1903 Passenger travel on planes: 1919 Charles Lindberg crossed Atlantic:
Bridget Rief, Vice President Planning and Development Metropolitan Airports Commission
 Bridget Rief, Vice President Planning and Development Metropolitan Airports Commission Topics Operations and Air Service Trends Economic Impact Striving for Excellence Planning for the Future Prep for
Air Travel travel Insights insights from Routehappy
 US & International international inflight Inflight Wi- Fi wi- fi Air Travel travel Insights insights from Routehappy Overview: Flyers find more Wi- Fi than ever before Flyers want to get online, and expect
Sioux Falls Regional Airport Sioux Falls, SD
 Sioux Falls Regional Airport Sioux Falls, SD Volume 16-4 T1 Data Through April 216 July 216 Sioux Falls Onboard Ticker YE Apr 16 YoY Apr-16 YoY Passengers 989,223 -.4% 79,34 1.8% Airport Traffic Monthly
Census Affects Children in Poverty by Professors Donald Hernandez and Nancy Denton State University of New York, Albany
 Phone: (301) 457-9900 4700 Silver Hill Road, Suite 1250-3, Suitland, MD 20746 Fax: (301) 457-9901 Census Affects in Poverty by Professors Donald Hernandez and Nancy Denton State University of New York,
Economics of International Airline Joint Ventures. Bryan Keating Georgetown Airline Competition Conference July 17, 2017
 Economics of International Airline Joint Ventures Bryan Keating Georgetown Airline Competition Conference July 17, 2017 International Airline Joint Ventures Connect Complementary Networks No individual