Business Intelligence Development at Winnipeg Transit
|
|
|
- Shawn McCarthy
- 6 years ago
- Views:
Transcription

1 ITS Canada Webinar February 28, 2013 Business Intelligence Development at Winnipeg Transit Bill Menzies Senior Transit Planner, Dillon Consulting Limited Manager of Service Development, Winnipeg Transit (formerly)
2 Transit Service Management Service Plan Decision Action Information Service Delivery Data Consolidation Analysis 3


 Bus Run")
3 Data Consolidation for Analysis GIS Transit Cost Model NETData MMIS Contact On-TRAC APC Geography Schedule Service Costs Fleet Dispatch Operations Utilization TSAS Database Network, Schedule, Cost Files (SAS) Bus Run Assignment Files (SAS) APC Files (DB2) 4
 Segment Defined by")

4 Transit Network Definition Booking Route Route Direction Trip Pattern (Leg) Segment Defined by contiguous timing points Common stop sequence Bus Stop Service Access/Egress Timing Point Transfer Point Relief Point 6
5 Utilization: APC System Automatic Passenger Counting System Boardings/Alightings by Stop Loads Between Stops Arrival/Departure/Dwell Times at Stops and Timing Points Actual Running Times Between Timing Points Service Delays 183 buses equipped (33% of fleet) 28 x 40 High Floor (New Flyer D40) 150 x 40 Low Floor (New Flyer D40LF) 5 x 30 Low Floor (New Flyer D30LF) 3 service lines at 2 garages equipped 10
6 Data Consolidation Goal is to consolidate key data from different systems to support analysis, planning, and management of transit service What s needed: Data interfaces for major applications Software that can read a variety of database formats End user programming skills Internal computer network for data access Intranet site for report publication 14
7 The TSAS Warehouse Network & Schedule Database Bus/Run Assignments Database APC BusStops Database Trip Samples Trip Sample Status Run Sample Status Utilization Trip Productivity Run Times SAS Programs APC Diagnostic Reports Service Supply Reports Dispatch Reports Passenger Count Reports Service Evaluation Reports Schedule Adherence Reports Service Cost Database Trip Recovery Status Run Time Data Files for HASTUS-ATP 15
8 Performance Metrics
9 System-Based Metrics Dispatch % of scheduled service actually operated % of designated service operated by designated buses Low Floor Routes Downtown Spirit Routes Bike Rack Routes BRT Routes APC Data Recovery % of APC-operated trips for which data successfully recovered Schedule Adherence % of departures within window: 1 min early to 3 min late Measured only at stops with boardings Weighted by boardings System Ridership Average Daily Boardings by: Booking Type Schedule Type Year 18
10 Route-Based Metrics Schedule Adherence % of departures within window: 1 min early to 3 min late Weighted by boardings Running Times/Speed Mean, Standard Deviation Crowding At trip maximum load point, % of passengers: Seated Standing (comfortable) Standing (uncomfortable) Trip Productivity Average Boardings Boardings/Bus Hour Maximum Load/Seated Capacity % of Seat-Kms used Average pgr trip length Service Frequency Scheduled Headway vs. Demand Based Headway at each route s maximum load point By schedule type, time period, and route direction 19
11 Stop-Based Metrics Passenger Activity Ons/Offs/Load by: Booking Schedule Type Time Period Route Schedule Adherence % of departures within window: 1 min early to 3 min late Weighted by each passenger trip s boardings 20
12 Service Evaluation - Supply 40 seats 0 Min 1000 m 1000 m 1000 m 1000 m 1000 m 45 Min Bus Hours = 0.75 Bus Kms = 5 Seat-Kms = (40 seats *1,000 m)/1,000 m) * 5 =
13 Service Evaluation - Demand 40 seats Min 1000 m 1000 m 1000 m 1000 m 1000 m 45 Min Ons = 52 Offs = 52 Max Load = 45 Pgr-Kms = ((5*1000)+(20*1000)+(25*1000)+(45*1000)+(15*1000))/1000 =
14 Service Evaluation - Metrics 40 seats Min 1000 m 1000 m 1000 m 1000 m 1000 m 45 Min Boardings/Bus Hour = 52/0.75 = 69 Boardings/Bus Km = 52/5 = 10.4 Pgr-Kms/Bus Kms = 110/5 = 22 (Average Load) Pgr-Kms/Seat Kms = 110/200 = 55% (Load Factor) Pgr-Kms/Boardings = 110/52 = 2.12 (Avge Pgr Trip Length) 23
15 Service Evaluation - Metrics Balanced Scorecard Performance Measures Boardings/Bus Hour Boardings/Bus Km Average Load Load Factor Complete Route Peak Direction Average Trip Length Cost Measures Variable Cost/Boarding Full Cost/Boarding Variable Cost/Bus Hour Full Cost/Bus Hour Route Peer Comparison Routes compared within category: Downtown Main Line Express Crosstown Neighbourhood Feeder Downtown Spirit DART 24


16 Service Evaluation - Example Category Schedule Route Daily Service Operated Daily Costs and Demand Performance Measures Cost Measures 25
17 Information Delivery
18 What, How, For Whom? On-Line Reports Generated daily at 05:00 Designed for quick reference by all staff Detailed Paper Reports ~30 standard reports generated on demand for planning/scheduling purposes Evaluation Reports Generated at end of each booking to track system ridership, route productivity, demand-based headways, service costs Restricted circulation Data Extraction for Input to Other Applications Observed run time data for HASTUS-ATP analysis Spatial data for GIS analysis 27


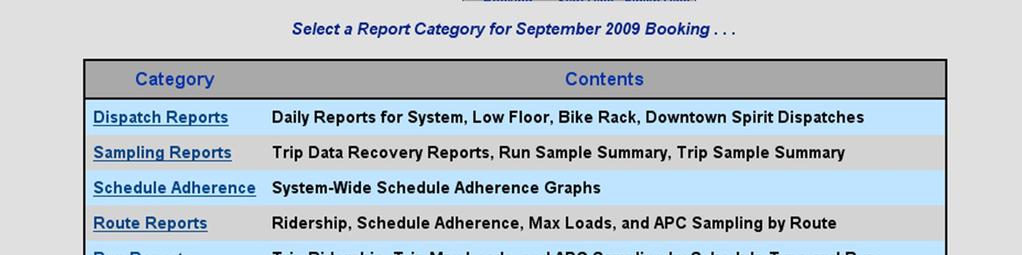
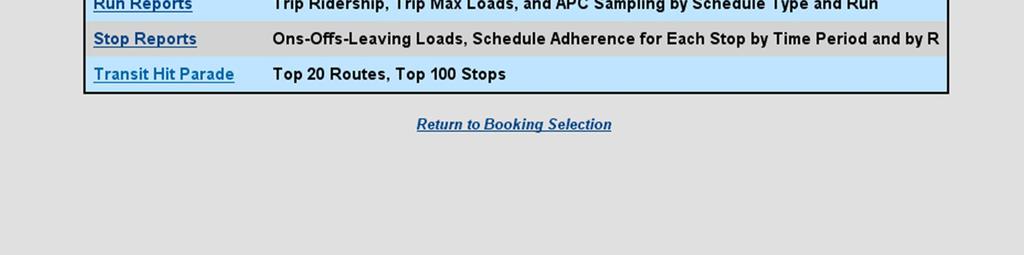
19 On-Line Reports 28


20 System Schedule Adherence 29

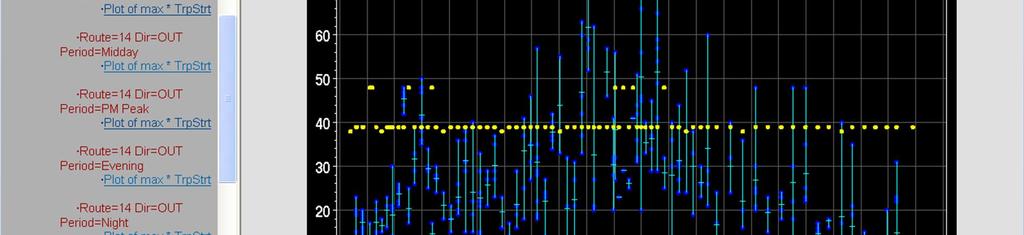
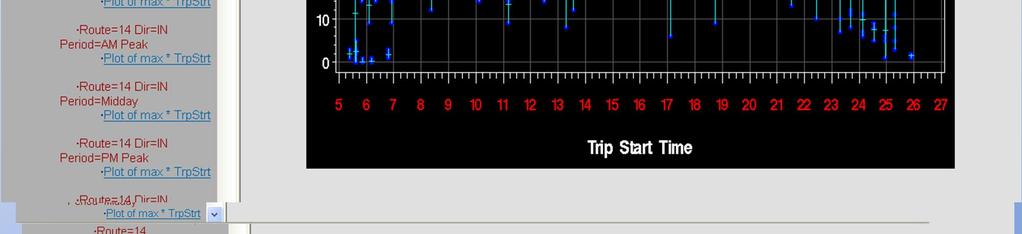
21 Route Reports 30

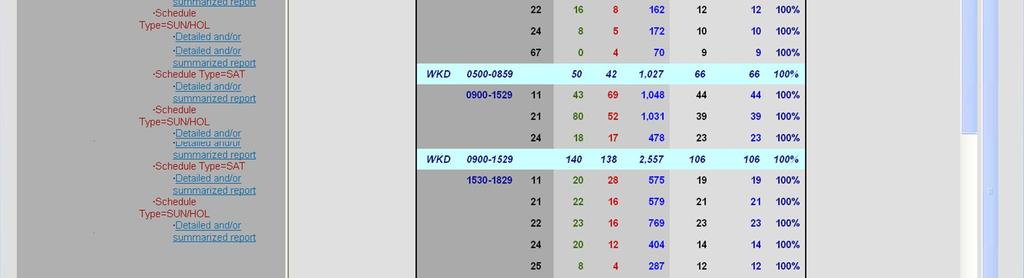

22 Stop Reports 31

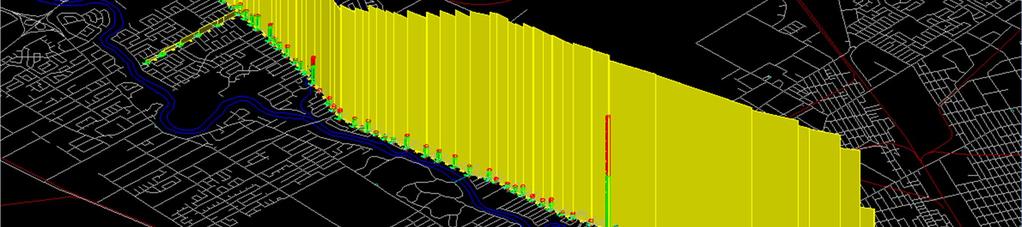
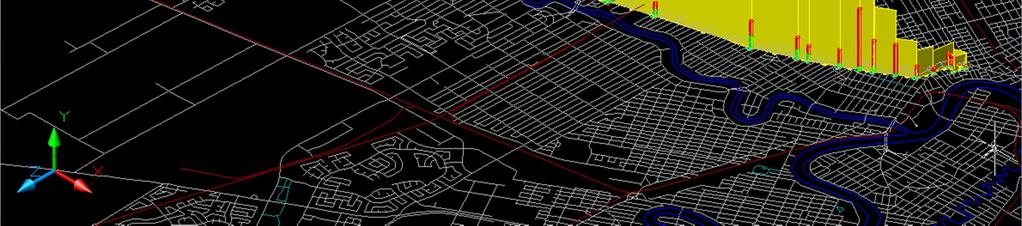
23 GIS Load Profile 34
24 Next Steps Integrate data from new ITS deployments into TSAS: Automatic Vehicle Location System (2010) Generates second-by-second log file of each bus s operation each day Electronic Passenger Information Systems (2011) Trip planner, IVR, mobile, and SMS apps generate travel pattern data Fare Collection System (2013) Generates spatially-referenced fare payment and transfer data Develop management dashboard of key operational and performance measures 35
25 Thank You!
METROPOLITAN EVANSVILLE TRANSIT SYSTEM Part I: Comprehensive Operations Analysis Overview July 9 th, 2015 Public Information Meeting
 METROPOLITAN EVANSVILLE TRANSIT SYSTEM Part I: Comprehensive Operations Analysis Overview July 9 th, 2015 Public Information Meeting AGENDA 5:30 5:40 Open House 5:40 6:30 Presentation Comprehensive Operations
Juneau Comprehensive Operations Analysis and Transit Development Plan DRAFT RECOMMENDATIONS January 2014
 Juneau Comprehensive Operations Analysis and Transit Development Plan DRAFT RECOMMENDATIONS January 2014 Tonight s Agenda System Strengths & Weaknesses Service Improvement Objectives Draft Recommendations
Att. A, AI 46, 11/9/17
 Total s San Diego Metropolitan Transit System POLICY 42 PERFORMANCE MONITORING REPORT Page 1 of 6 Date: 11/8/17 OBJECTIVE Develop a Customer-Focused and Competitive System The following measures of productivity
CURRENT SHORT-RANGE TRANSIT PLANNING PRACTICE. 1. SRTP -- Definition & Introduction 2. Measures and Standards
 CURRENT SHORT-RANGE TRANSIT PLANNING PRACTICE Outline 1. SRTP -- Definition & Introduction 2. Measures and Standards 3. Current Practice in SRTP & Critique 1 Public Transport Planning A. Long Range (>
PERFORMANCE REPORT NOVEMBER 2017
 PERFORMANCE REPORT NOVEMBER 2017 Note: New FY2018 Goal/Target/Min or Max incorporated in the Fixed Route and Connection Dashboards. Keith A. Clinkscale Performance Manager INTRODUCTION/BACKGROUND In June
METROBUS SERVICE GUIDELINES
 METROBUS SERVICE GUIDELINES In the late 1990's when stabilization of bus service was accomplished between WMATA and the local jurisdictional bus systems, the need for service planning processes and procedures
Date: 11/6/15. Total Passengers
 Total San Diego Metropolitan Transit System POLICY 42 PERFORMANCE MONITORING REPORT Page 1 of 6 OBJECTIVE Develop a Customer-Focused and Competitive System The following measures of productivity and service
Attachment C: 2017/2018 Halifax Transit Year End Performance Report. 2017/2018 Year End Performance Measures Report
 Attachment C: 2017/2018 Halifax Transit Year End Performance Report 2017/2018 Year End Performance Measures Report Contents Annual Key Performance Indicators (KPIs)... 1 Weekday Cost per Passenger... 1
HOW TO IMPROVE HIGH-FREQUENCY BUS SERVICE RELIABILITY THROUGH SCHEDULING
 HOW TO IMPROVE HIGH-FREQUENCY BUS SERVICE RELIABILITY THROUGH SCHEDULING Ms. Grace Fattouche Abstract This paper outlines a scheduling process for improving high-frequency bus service reliability based
Workshop on Advances in Public Transport Control and Operations, Stockholm, June 2017
 ADAPT-IT Analysis and Development of Attractive Public Transport through Information Technology Real-time Holding Control Strategies for Single and Multiple Public Transport Lines G. Laskaris, PhD Candidate,
Corridor Analysis. Corridor Objectives and Strategies Express Local Limited Stop Overlay on Local Service 1 Deadhead
 Corridor Analysis Outline Corridor Objectives and Strategies Express Local Limited Stop Overlay on Local Service 1 Deadhead 1 Stacey Schwarcz, "Service Design for Heavy Demand Corridors: Limited-Stop Bus
MONTHLY OPERATIONS REPORT DECEMBER 2015
 MONTHLY OPERATIONS REPORT DECEMBER 215 Table of Contents DECEMBER 215 Section Page December Highlights... 3 Strategic Goals Progress Update... 4 Ridership... 6 Revenue... 9 Expenses... 1 System Summary...
Title VI Service Equity Analysis
 Pierce Transit Title VI Service Equity Analysis Pursuant to FTA Circular 4702.1B NE Tacoma Service May 2016 Pierce Transit Transit Development Dept. PIERCE TRANSIT TITLE VI SERVICE EQUITY ANALYSIS TABLE
PERFORMANCE REPORT DECEMBER Performance Management Office
 PERFORMANCE REPORT DECEMBER 2018 Performance Management Office INTRODUCTION/BACKGROUND Performance Management Office FIXED ROUTE DASHBOARD FY 2019 Safety Max Target Goal Preventable Collisions per 100k
STEP ALTERNATIVES RANKING TABLE
 ALTERNATIVES RANKING TABLE Priority Ranking 0 = Lowest Priority 1 2 3 4 5 = Highest Priority Abbreviations TD = Transportation Disadvantaged PWD = People with Disabilities I. Existing Enhancements Increase
MONTHLY OPERATIONS REPORT SEPTEMBER 2015
 MONTHLY OPERATIONS REPORT SEPTEMBER 215 Table of Contents SEPTEMBER 215 Section Page September Highlights... 3 Strategic Goals Progress Update... 4 Ridership... 6 Revenue... 9 Expenses... 1 System Summary...
General Issues Committee Item Transit Operating Budget Ten Year Local Transit Strategy
 General Issues Committee Item 4.1 2017 Transit Operating Budget Ten Year Local Transit Strategy January 27, 2017 Presentation Outline 2017 Operating Budget Overview Ten Year Local Transit Strategy 2 2017
RTD s Performance Management System
 RTD s Performance Management System FTA s New Transit Asset Management (TAM) Program Why Set Targets? October 10, 2017 Donna DeMartino Chief Executive Officer (CEO) San Joaquin Regional Transit District
2017/ Q1 Performance Measures Report
 2017/2018 - Q1 Performance Measures Report Contents Ridership & Revenue... 1 Historical Revenue & Ridership... 1 Revenue Actual vs. Planned... 3 Mean Distance Between Failures... 5 Maintenance Cost Quarter
FIXED ROUTE DASHBOARD JULY 2018
 FIXED ROUTE DASHBOARD JULY 2018 Safety Max Target Goal Preventable Collisions per 100k Miles Non-Preventable Collisions per 100k Miles Total Incidents per 10,000 Boardings 1.6 1.3 0.8 2.63 2.1 2.0 1.60
Bus Corridor Service Options
 Bus Corridor Service Options Outline Corridor Objectives and Strategies Express Local Limited Stop Overlay on Local Service 1 Deadhead 1 Stacey Schwarcz, "Service Design for Heavy Demand Corridors: Limited-Stop
II. Terminology and Basic
 II. Terminology and Basic Relationships Public Transport Planning and Regulation: An Introduction II-1 Planning and Analysis Building Blocks Schedule Building Cost Analysis and Financial Planning Performance
Table of Contents. List of Tables
 Table of Contents 1. Introduction... 1 2. Service Recommendations... 1 A. Extend Service on Fort Belvoir to New Post Exchange/Commissary Complex... 1 B. Improve Service Frequencies on Sunday from Current
PERFORMANCE REPORT JANUARY Keith A. Clinkscale Performance Manager
 PERFORMANCE REPORT JANUARY 2018 Keith A. Clinkscale Performance Manager INTRODUCTION/BACKGROUND Keith A. Clinkscale Performance Manager FIXED ROUTE DASHBOARD JANUARY 2018 Safety Max Target Goal Preventable
Transit Vehicle Scheduling: Problem Description
 Transit Vehicle Scheduling: Problem Description Outline Problem Characteristics Service Planning Hierarchy (revisited) Vehicle Scheduling /24/03.224J/ESD.204J Problem Characteristics Consolidated Operations
APPENDIX B COMMUTER BUS FAREBOX POLICY PEER REVIEW
 APPENDIX B COMMUTER BUS FAREBOX POLICY PEER REVIEW APPENDIX B COMMUTER BUS FAREBOX POLICY PEER REVIEW The following pages are excerpts from a DRAFT-version Fare Analysis report conducted by Nelson\Nygaard
Development of SH119 BRT Route Pattern Alternatives for Tier 2 - Service Level and BRT Route Pattern Alternatives
 Development of SH119 BRT Route Pattern Alternatives for Tier 2 - Service Level and BRT Route Pattern Alternatives June 1, 2018 Development of SH119 BRT Route Pattern Alternatives for Tier 2 - Service Level
New System. New Routes. New Way. May 20, 2014
 Route Optimization I N I T I A T I V E New System. New Routes. New Way. May 20, 2014 1 Welcome Blueprint for Transportation Excellence (BTE) 20 year strategic plan Blueprint 2020 JTA s five-year plan for
KING STREET TRANSIT PILOT
 KING STREET TRANSIT PILOT Update toronto.ca/kingstreetpilot #kingstreetpilot UPDATE Average streetcar travel times in continued to show similar trends as first observed in November. The most significant
# 1 in ease-of-use. Guest Service Interconnectivity. Made by hoteliers, for hoteliers.
 1.415.992.3999 - The voice of the hotel # 1 in ease-of-use. Guest Service Interconnectivity. Made by hoteliers, for hoteliers. An intuitive guest service management software for hotels. Table of Content
2017/2018 Q3 Performance Measures Report. Revised March 22, 2018 Average Daily Boardings Comparison Chart, Page 11 Q3 Boardings figures revised
 2017/2018 Q3 Performance Measures Report Revised March 22, 2018 Average Daily Boardings Comparison Chart, Page 11 Q3 Boardings figures revised Contents Ridership & Revenue... 1 Historical Revenue & Ridership...
The Importance of Service Frequency to Attracting Ridership: The Cases of Brampton and York
 The Importance of Service Frequency to Attracting Ridership: The Cases of Brampton and York Jonathan English Columbia University CUTA Conference May 2016 Introduction Is density the most important determinant
September 2014 Prepared by the Department of Finance & Performance Management Sub-Regional Report PERFORMANCE MEASURES
 September 2014 Prepared by the Department of Finance & Performance Management 2013 Sub-Regional Report PERFORMANCE MEASURES REGIONAL PERFORMANCE MEASURES RTA staff has undertaken the development of a performance
Lessons Learned from Rebuilding the Muni Subway Schedule Leslie Bienenfeld
 Lessons Learned from Rebuilding the Muni Subway Schedule Leslie Bienenfeld Manager of Fixed Guideway Scheduling San Francisco Municipal Transportation Agency San Francisco, California SFMTA & the Municipal
APPENDIX 2 TORONTO TRANSIT COMMISSION SERVICE STANDARDS AND DECISION RULES FOR PLANNING TRANSIT SERVICE
 APPENDIX 2 TORONTO TRANSIT COMMISSION SERVICE STANDARDS AND DECISION RULES FOR PLANNING TRANSIT SERVICE Contents 1 Introduction... 1 2 Network Design Standards... 2 2.1 Transit Service Classifications...
Mount Pleasant (42, 43) and Connecticut Avenue (L1, L2) Lines Service Evaluation Study Open House Welcome! wmata.com/bus
 and Connecticut Avenue (L1, L2) Lines Service Evaluation Study Open House Welcome! wmata.com/bus") Mount Pleasant (42, 43) and Connecticut Avenue (L1, L2) Lines Service Evaluation Study Open House Welcome! Study Overview and Timeline Phase 1: Collect and Analyze Data Project Kickoff, September 2017
Mount Pleasant (42, 43) and Connecticut Avenue (L1, L2) Lines Service Evaluation Study Open House Welcome! Study Overview and Timeline Phase 1: Collect and Analyze Data Project Kickoff, September 2017
8 CROSS-BOUNDARY AGREEMENT WITH BRAMPTON TRANSIT
 8 CROSS-BOUNDARY AGREEMENT WITH BRAMPTON TRANSIT The Transportation Services Committee recommends the adoption of the recommendations contained in the following report dated May 27, 2010, from the Commissioner
Frequently Asked Questions
 Frequently Asked Questions Collected below are the most Frequently Asked Questions for easy reference. If your question isn't answered here, please email travel@vanderbilt.edu. Why did Vanderbilt implement
October REGIONAL ROUTE PERFORMANCE ANALYSIS
 October 2018 2017 REGIONAL ROUTE PERFORMANCE ANALYSIS The Council s mission is to foster efficient and economic growth for a prosperous metropolitan region Metropolitan Council Members Alene Tchourumoff
2 YORK REGION TRANSIT MOBILITY PLUS 2004 SYSTEM PERFORMANCE REVIEW
 2 YORK REGION TRANSIT MOBILITY PLUS 2004 SYSTEM PERFORMANCE REVIEW The Joint Transit Committee and Rapid Transit Public/Private Partnership Steering Committee recommends the adoption of the recommendation
Presentation Outline
 Presentation Outline Overview of Planning Process Initial Service and Fare Considerations RTC RIDE Fixed-route RTC ACCESS Paratransit Fares Next Steps Regional Transportation Commission, Washoe County
WATERBORNE TRANSIT. April 21, 2010
 WATERBORNE TRANSIT CONCEPTS STUDY April 21, 2010 1 Overview: Summary of previous 2004/2005 Ferry Service analysis Results of recent study focusing on ferry service from Newport News Conclusions 2 2004/2005
SAN LUIS OBISPO TRANSIT + SAN LUIS OBISPO RTA JOINT SHORT RANGE TRANSIT PLANS: SERVICE STRATEGIES. Presented by: Gordon Shaw, PE, AICP; Principal
 SAN LUIS OBISPO TRANSIT + SAN LUIS OBISPO RTA JOINT SHORT RANGE TRANSIT PLANS: SERVICE STRATEGIES Presented by: Gordon Shaw, PE, AICP; Principal Project Status Review of existing services and setting complete
Existing Services, Ridership, and Standards Report. June 2018
 Existing Services, Ridership, and Standards Report June 2018 Prepared for: Prepared by: Contents Overview of Existing Conditions... 1 Fixed Route Service... 1 Mobility Bus... 34 Market Analysis... 41 Identification/Description
PERFORMANCE REPORT DECEMBER 2017
 PERFORMANCE REPORT DECEMBER 2017 Note: New FY2018 Goal/Target/Min or Max incorporated in the Fixed Route and Connection Dashboards. Keith A. Clinkscale Performance Manager INTRODUCTION/BACKGROUND Keith
Presentation to the Southeast Corridor High-Performance Transit Alternative Study Public Forum. Overview of MTA. presented by
 Presentation to the Southeast Corridor High-Performance Transit Alternative Study Public Forum Overview of MTA presented by Marian Ott, MTA Board Chair, Planning and Marketing Committee SEPTEMBER 2004
KING STREET TRANSIT PILOT
 KING STREET TRANSIT PILOT Update toronto.ca/kingstreetpilot #kingstreetpilot HIGHLIGHTS TRANSIT RIDERSHIP TRANSIT CAPACITY To respond to this growth in ridership, the TTC has increased the capacity of
Chapter 3. Burke & Company
 Chapter 3 Burke & Company 3. WRTA RIDERSHIP AND RIDERSHIP TRENDS 3.1 Service Overview The Worcester Regional Transit Authority (WRTA) provides transit service to over half a million people. The service
Table E1 Summary of Annual Revenue Service Hours. System LTC Routes 581, , , , ,082 (Quick Start)
") L O N D O NT R A N S I TC O MMI S S I O N T r a n s i t N e t w o r k R a p i dt r a n s i t I n t e g r a t i o nf r a me w o r k FI NAL REPORT Augus t2016 Su bmi t t e dby : Di l l on Consul t i ng Li
L O N D O NT R A N S I TC O MMI S S I O N T r a n s i t N e t w o r k R a p i dt r a n s i t I n t e g r a t i o nf r a me w o r k FI NAL REPORT Augus t2016 Su bmi t t e dby : Di l l on Consul t i ng Li
Service Performance 2017 Networked Family of Services
 Subsidy per Boarding or Effectiveness Service Performance 2017 Networked Family of Services Overview RTD s Mission is: "To meet our constituents' present and future public transit needs by offering safe,
15:00 minutes of the scheduled arrival time. As a leader in aviation and air travel data insights, we are uniquely positioned to provide an
 FlightGlobal, incorporating FlightStats, On-time Performance Service Awards: A Long-time Partner Recognizing Industry Success ON-TIME PERFORMANCE 2018 WINNER SERVICE AWARDS As a leader in aviation and
Concur Travel FAQs. 5. How do I log in to Concur Travel? Visit or the link is available on the Travel page of the Compass.
 General 1. What is Concur Travel? Concur Travel is a hosted, web-based system that allows users to book travel using a web browser or mobile device instead of booking travel through a travel agent. Concur
DEFINITIONS DEFINITIONS 2/11/2017 REQUIREMENTS AND LIMITATIONS OF DRONE USE IN FORENSIC ACCIDENT RECONSTRUCTION
 REQUIREMENTS AND LIMITATIONS OF DRONE USE IN FORENSIC ACCIDENT RECONSTRUCTION ROGER BURGMEIER BURGMEIER CONSULTING INC. DEFINITIONS Aircraft: device that is used, or intended to be used, for flight. Drone:
(This page intentionally left blank.)
") Executive Summary (This page intentionally left blank.) Executive Summary INTRODUCTION The Cache Valley Transit District (CVTD) contracted with the team of Transportation Consultants, Inc. () and Fehr
Executive Summary (This page intentionally left blank.) Executive Summary INTRODUCTION The Cache Valley Transit District (CVTD) contracted with the team of Transportation Consultants, Inc. () and Fehr
Performance Metrics for Oceanic Air Traffic Management. Moving Metrics Conference Pacific Grove, California January 29, 2004 Oceanic Metrics Team
 Performance Metrics for Oceanic Air Traffic Management Moving Metrics Conference Pacific Grove, California January 29, 2004 Oceanic Metrics Team Agenda Metrics Team Michele Merkle, FAA AUA-600 Lynne Hamrick,
SAMTRANS TITLE VI STANDARDS AND POLICIES
 SAMTRANS TITLE VI STANDARDS AND POLICIES Adopted March 13, 2013 Federal Title VI requirements of the Civil Rights Act of 1964 were recently updated by the Federal Transit Administration (FTA) and now require
14 YORK REGION TRANSIT (YRT/VIVA) SOUTHWEST DIVISION OPERATIONS AND MAINTENANCE CONTRACT EXTENSION
 SOUTHWEST DIVISION OPERATIONS AND MAINTENANCE CONTRACT EXTENSION") Clause No. 14 in Report No. 13 of the was adopted, without amendment, by the Council of The Regional Municipality of York at its meeting held on September 11, 2014. 14 YORK REGION TRANSIT (YRT/VIVA) SOUTHWEST
Clause No. 14 in Report No. 13 of the was adopted, without amendment, by the Council of The Regional Municipality of York at its meeting held on September 11, 2014. 14 YORK REGION TRANSIT (YRT/VIVA) SOUTHWEST
Atennea Air. The most comprehensive ERP software for operating & financial management of your airline
 Atennea Air The most comprehensive ERP software for operating & financial management of your airline Atennea Air is an advanced and comprehensive software solution for airlines management, based on Microsoft
PLEASE READ Proposal for Sustainable Service
 IMPORTANT PLEASE READ 019 Proposal for Sustainable Service 019 Service Change Proposal IMPLEMENT A SUSTAINABLE NETWORK Everett Transit completed its Long Range Plan in May, and the plan was adopted by
BaltimoreLink Implementation Status Report
 BaltimoreLink Implementation Status Report February 218 Joint Chairmen s Report JH1 Executive Summary BaltimoreLink, implemented on June 18, 217, is the complete overhaul and rebranding of the core transit
RTA ScoreCard December 2009
 Background and Context RTA ScoreCard December 2009 Chapter 25 of the Acts of 2009 modernized the transportation systems of the Commonwealth and created the new MassDOT. Section 6 of this law established
NUMBER CRUNCHING FOR DUMMIES. Collecting, Identifying, Presenting, and Developing an Effective Planning Strategy Amid Billions and Billions of Records
 NUMBER CRUNCHING FOR DUMMIES Collecting, Identifying, Presenting, and Developing an Effective Planning Strategy Amid Billions and Billions of Records Jim Archer Mary Lawrence METRO Houston, TX Houston
Public Transit Services on NH 120 Claremont - Lebanon
 Public Transit Services on NH 120 Claremont - Lebanon Overview of Preferred Alternative April 12, 2011 Presentation Overview Study Goals Quick Review Methodology and Approach Key Findings Results of Public
Caroline County / King George County Transit Studies. Meeting November 1, 2017
 Caroline County / King George County Transit Studies Meeting November 1, 2017 1 FRED Routes C1 and C2 C1 C2 Caroline County Total FRED Total Ridership (FY 2017) 4,527 2,870 7,397 377,042 Revenue Hours
RACINE COUNTY PUBLIC TRANSIT PLAN:
 RACINE COUNTY PUBLIC TRANSIT PLAN: 2013-2017 Recommended Transit Service Improvement Plan NEWSLETTER 3 SEPTEMBER 2013 This newsletter describes the final recommended public transit plan for the City of
Operational Performance
 Customer Services, Operations, and Safety Committee Board Action/Information Item III-A January 10, 2008 Operational Washington Metropolitan Area Transportation Authority Board Action/Information Summary
MEMBER PORTAL QUICK GUIDE
 MEMBER PORTAL QUICK GUIDE Table of Contents How to register:... 2 How to log into Member Portal:... 3 To book a round trip:... 4 To book a one way to appointment (from home to appointment with no return
Fly Quiet Report. 3 rd Quarter November 27, Prepared by:
 November 27, 2017 Fly Quiet Report Prepared by: Sjohnna Knack Program Manager, Airport Noise Mitigation Planning & Environmental Affairs San Diego County Regional Airport Authority 1.0 Summary of Report
CHAPTER 5 SIMULATION MODEL TO DETERMINE FREQUENCY OF A SINGLE BUS ROUTE WITH SINGLE AND MULTIPLE HEADWAYS
 91 CHAPTER 5 SIMULATION MODEL TO DETERMINE FREQUENCY OF A SINGLE BUS ROUTE WITH SINGLE AND MULTIPLE HEADWAYS 5.1 INTRODUCTION In chapter 4, from the evaluation of routes and the sensitive analysis, it
ROUTE 110. St. Albans Downtown Shuttle ROUTE OVERVIEW
 ROUTE 110 St. Albans Downtown Shuttle ROUTE OVERVIEW Route 110 is a Rural Local route that provides circulator service in and around downtown St. Albans (see Figure 1). To the north, the route serves the
TransAction Overview. Introduction. Vision. NVTA Jurisdictions
 Introduction Vision NVTA Jurisdictions In the 21 st century, Northern Virginia will develop and sustain a multimodal transportation system that enhances quality of life and supports economic growth. Investments
YRT/VIVA PROPOSED FARE INCREASE
 Report No. 7 of the Transportation Services Committee Regional Council Meeting of September 22, 1 2012 YRT/VIVA PROPOSED FARE INCREASE The Transportation Services Committee recommends: 1. Receipt of the
ROUTE EBA EAST BUSWAY ALL STOPS ROUTE EBS EAST BUSWAY SHORT
 ROUTE EBA EAST BUSWAY ALL STOPS ROUTE EBS EAST BUSWAY SHORT The EBA East Busway All Stops and EBS East Busway Short routes provide the core Martin Luther King Jr. East Busway services. Route EBA operates
COMMUTING MASS TRANSPORT CALCULATOR GUIDE Version 1.0
 COMMUTING MASS TRANSPORT CALCULATOR GUIDE Version 1.0 Green Star SA Multi Unit Residential v1 Commuting Mass Transport Calculator Guide First Released: 27 th October 2011 Last Update: 27 th October 2011
Outline. 1. Timetable Development 2. Fleet Size. Nigel H.M. Wilson. 3. Vehicle Scheduling J/11.543J/ESD.226J Spring 2010, Lecture 18
 Vehicle Scheduling Outline 1. Timetable Development 2. Fleet Size 3. Vehicle Scheduling 1 Timetable Development Can translate frequency into timetable by specifying headways as: equal -- appropriate if
Service Change Plan Cowichan Valley Regional Transit System July 2018 Expansion. Prepared by
 Service Change Plan Cowichan Valley Regional Transit System July 18 Expansion Prepared by OVERVIEW In order to continue delivering on the Cowichan Valley Transit Future Plan goals and objectives and to
PREFACE. Service frequency; Hours of service; Service coverage; Passenger loading; Reliability, and Transit vs. auto travel time.
 PREFACE The Florida Department of Transportation (FDOT) has embarked upon a statewide evaluation of transit system performance. The outcome of this evaluation is a benchmark of transit performance that
Fixed-Route Operational and Financial Review
 Chapter II CHAPTER II Fixed-Route Operational and Financial Review Chapter II presents an overview of route operations and financial information for KeyLine Transit. This information will be used to develop
SRTA Year End Fixed Route Ridership Analysis: FY 2018
 SRTA Year End Fixed Route Ridership Analysis: FY 2018 2018 Contents Introduction... 1 A. Key Terms Used in this Report... 1 Key Findings... 2 A. Ridership... 2 B. Fare Payment... 4 Performance Analysis
Western Placer County Transit Operators Short Range Transit Plan Updates FY to FY Project Update and Alternatives Discussion
 Western Placer County Transit Operators Short Range Transit Plan Updates FY 2018-19 to FY 2024-25 Project Update and Alternatives Discussion Public Workshop Purpose Present various transit service, capital
Appendix B Ultimate Airport Capacity and Delay Simulation Modeling Analysis
 Appendix B ULTIMATE AIRPORT CAPACITY & DELAY SIMULATION MODELING ANALYSIS B TABLE OF CONTENTS EXHIBITS TABLES B.1 Introduction... 1 B.2 Simulation Modeling Assumption and Methodology... 4 B.2.1 Runway
Greater Portland Transit District
 Greater Portland Transit District TO: FROM: Freeport Town Council Greg Jordan - Metro General Manager DATE: September 10, 2014 SUBJECT: Metro Request to Pursue Grant Funding for Trial Express Bus Service
FY Year End Performance Report
 Overall Ridership Big Blue Bus carried 18,748,869 passengers in FY2014-2015, a 0.3% reduction from the year prior. This negligible reduction in ridership represents the beginnings of a reversal from a
Transit System Performance Update
 Clause 5 in Report No. 4 of Committee of the Whole was adopted, without amendment, by the Council of The Regional Municipality of York at its meeting held on March 29, 2018. 5 2017 Transit System Performance
Air Traffic Flow Management (ATFM) in the SAM Region METHODOLOGY ADOPTED BY BRAZIL TO CALCULATE THE CONTROL CAPACITY OF ACC OF BRAZILIAN FIR
 in the SAM Region METHODOLOGY ADOPTED BY BRAZIL TO CALCULATE THE CONTROL CAPACITY OF ACC OF BRAZILIAN FIR") International Civil Aviation Organization SAM/IG/6-IP/03 South American Regional Office 21/09/10 Sixth Workshop/Meeting of the SAM Implementation Group (SAM/IG/6) - Regional Project RLA/06/901 Lima, Peru,
International Civil Aviation Organization SAM/IG/6-IP/03 South American Regional Office 21/09/10 Sixth Workshop/Meeting of the SAM Implementation Group (SAM/IG/6) - Regional Project RLA/06/901 Lima, Peru,
The Computerized Analysis of ATC Tracking Data for an Operational Evaluation of CDTI/ADS-B Technology
 DOT/FAA/AM-00/30 Office of Aviation Medicine Washington, D.C. 20591 The Computerized Analysis of ATC Tracking Data for an Operational Evaluation of CDTI/ADS-B Technology Scott H. Mills Civil Aeromedical
Prior to reviewing the various performances of Red Apple Transit, it is important to point out some key terminology, including:
 CHAPTER IV INTRODUCTION Chapter IV presents an overview of operations and financial information for Red Apple Transit. Information on the current system ridership is also presented. This information was
rtc transit Before and After Studies for RTC Transit Boulder highway UPWP TASK Before Conditions
 rtc transit Before and After Studies for RTC Transit UPWP TASK 3403-11-14 Before Conditions Report Boulder highway June 2011 Before and After Studies for RTC Transit BOULDER HIGHWAY BEFORE STUDY UPWP Task
REVIEW OF SUN METRO LIFT SERVICES
 REVIEW OF SUN METRO LIFT SERVICES Prepared for Review by Linda Cherrington, Research Scientist Suzie Edrington, Associate Research Scientist Zachary Elgart, Associate Transportation Researcher Shuman Tan,
Mercer SCOOT Adaptive Signal Control. Karl Typolt, Transpo Group PSRC RTOC July 6th, 2017
 Mercer SCOOT Adaptive Signal Control Karl Typolt, Transpo Group PSRC RTOC July 6th, 2017 Our mission, vision, and core values Mission: deliver a high-quality transportation system for Seattle Vision: connected
2 YORK REGION TRANSIT VEOLIA AGREEMENT AMENDMENT 91 CALDARI ROAD
 2 YORK REGION TRANSIT VEOLIA AGREEMENT AMENDMENT 91 CALDARI ROAD The Transit Committee recommends the following: 1. Receipt of the presentation by Rick Takagi, Manager, Operations, York Region Transit;
Measuring Bus Service Reliability: An Example of Bus Rapid Transit in Changzhou
 Measuring Bus Service Reliability: An Example of Bus Rapid Transit in Changzhou Yueying Huo, Southeast University/Inner Mongolia University Jinhua Zhao, Massachusetts Institute of Technology Wenquan Li,
Real-Time Control Strategies for Rail Transit
 Real-Time Control Strategies for Rail Transit Outline: Problem Description and Motivation Model Formulation Model Application and Results Implementation Issues Conclusions 12/08/03 1.224J/ESD.204J 1 Problem
Quality of Life Study
 FasTracks: Quality of Life Study Transportation Systems Performance Measurement Conference May 19, 2011 Overview Quality of Life Study Background/Purpose Study Scope Reporting Example Measures 2 RTD Regional
Terrace Regional Transit System CITY OF TERRACE COMMITTEE OF THE WHOLE SEPTEMBER 13, 2017
 Terrace Regional Transit System CITY OF TERRACE COMMITTEE OF THE WHOLE SEPTEMBER 13, 2017 1 Purpose To update Council on the system performance of the Terrace Regional Transit System Presentation Topics
SMS HAZARD ANALYSIS AT A UNIVERSITY FLIGHT SCHOOL
 SMS HAZARD ANALYSIS AT A UNIVERSITY FLIGHT SCHOOL Don Crews Middle Tennessee State University Murfreesboro, Tennessee Wendy Beckman Middle Tennessee State University Murfreesboro, Tennessee For the last
COUNCIL AGENDA REPORT
 COUNCIL AGENDA REPORT Meeting Date: 6 June 2016 Subject: Boards Routed Through: 2017 Airdrie Transit s Community Services Advisory Board Date: 9 May 2016 Issue: Council is being asked to endorse the 2017
Using Travel Card Data to Improve Public Transport Services. October 3, 2018
 Using Travel Card Data to Improve Public Transport Services October 3, 2018 Facts about Movia, Public Transport Authority Inhabitants 5,8 m in Denmark 2,6 m in the area of Movia 1,9 m in Greater Copenhagen
Metrobus Service Evaluations
 Metrobus Service Evaluations Routes B30, 87-88, & 89-89M Public Meeting Laurel Library May 25, 2011 Ben Schumin Purpose of the Evaluation Identify strategic needs; Review capacity, productivity, reliability,
4. ANALYSIS OF EXISTING RIDERSHIP AND ROUTE PERFORMANCE
 4. ANALYSIS OF EXISTING RIDERSHIP AND ROUTE PERFORMANCE Data Collection Metro Transit collects bus stop-level ridership data using Automatic Passenger Counter (APC) equipped vehicles on a routine basis.