Nantucket Memorial Airport Master Plan Update
|
|
|
- Laureen Gordon
- 6 years ago
- Views:
Transcription
1 APPENDIX A NANTUCKET AIRPORT MASTER PLAN SCOPE OF SERVICES AVIATION ACTIVITY -DRAFT FOR INTERNAL REVIEW-
2 TASK 3 INVENTORY EXISTING AIRFIELD CONDITIONS/ FINANCIAL DATA/ AIRSPACE MAPPING 3.1- Document Current Air Service and Assess Trends for Future Service Opportunities Nantucket is served by five airlines (Cape Air, Island Airlines, Delta, Jet Blue, and US Airways). The 2012 passenger enplanements were down 2 percent compared to calendar year 2011 when passenger enplanements decreased almost 11 percent over Of the Island s five airlines, only Cape Air provides year-round service to Boston Logan, White Plains NY, New Bedford MA, Hyannis MA, and Martha s Vineyard, as well as seasonal service to Providence RI. Delta, JetBlue, and US Airways provide seasonal service to JFK Airport NY, Reagan National Airport, DC, and Newark. This task will: 1) Evaluate Airline Industry Trends and their Impact on Nantucket; 2) Develop Data Base of Current Flight Operations ( ); 3) Evaluate Origin/ Destination Traffic; 4) Assess Drive Fly Traffic Arriving via Hyannis; 5) Estimate International Traffic; 6) Evaluate Future Needs for Schedule Aircraft Facilities; 7) Evaluate General Aviation Demands; and 8) Provide Input to Traffic Forecasts. A detailed description of the approach, methodology and deliverables is contained in Attachment Corporate GA Operations Jacobs will conduct a fleet sampling survey in the ACK Tower during a peak season August weekend to identify actual aircraft types. ACK s aviation activity has increasingly been dominated by larger corporate General Aviation jet aircraft, plus providing the facilities and services to handle their GA passengers. Larger corporate and private jets (G-550 and 650, Cessna Sovereign and Citation Q, Hawker 1000, Boeing BBJ, Global Express, and B-757 s) have been operating into Nantucket during the summer season. At the lower end of the corporate scale, smaller corporate jets such as the Cessna CJ series and Embraer Phenom, among others, as well as turboprops such as the TBM-70 and 850, King Air 200, Pilatus PC-12, Piaggio and Cessna Caravan have seen increased operations. TASK 5 - FORECASTS OF AVIATION DEMAND AND FLEET MIX The 1999 Airport Master Plan forecasts will be updated beginning with 2012 passenger enplanements and aircraft operations database. Three forecast planning periods will be developed, as shown below. The current FAA Terminal Area Forecast (TAF) runs through 2040, however, such a long range is considered to have a confidence level that is too low to be useful in this master plan update. The longterm period shown below ( ) is considered to be an outlook as opposed to a firm forecast. The forecasts developed for this master plan update will be compared with FAA s TAF, and if there is more than a 10% difference (+/-) the discrepancy will be explained and submitted to FAA for approval. Master Plan Forecast Periods Short-term: Intermediate: Long-Term: DRAFT FOR INTERNAL REVIEW-
3 The recent growth of corporate, air charter and non-scheduled air-taxi passenger activity has contrasted with declining trends in small general aviation piston aircraft activity, which needs to be analyzed. The recent introduction of new, private air taxi and charter services will be reviewed for their operational and service needs at ACK. Aircraft operational data from Task 3, as well as discussions with Airport Operations and Control Tower staff, will be used as input to the future fleet mix analysis. DOCUMENTATION AND DELIVERABLES (TASK 5): A technical memo, with graphs, charts and graphics, will be prepared to review and analyze: Aviation Forecasts in 1999 Airport Master Plan FAA Terminal Area Forecast (TAF) for ACK FAA National Aviation Forecasts Air Carrier/ Air Taxi Operations at ACK, annually through 2030 GA & Corporate Operations/ Trends by Type of Aircraft, annually through 2030 Number and Type of Based Aircraft, annually through 2030 Military Aircraft Operations, annually through 2030 Peak Season Activity by Type of Operation and Aircraft Type Peak Month/Average Day/Peak Hour Activity by Type of Operation Air Carrier and Air Taxi Enplanements, annually through 2030 Air Carrier and Air Taxi Operations by type of carrier and aircraft, annually through 2030 GA/ Corporate/ Transient Operations/ Passengers, annually through 2030 Future Critical Design Aircraft and Airport Reference Code (ARC) by Runway -DRAFT FOR INTERNAL REVIEW-
4 APPENDIX B NANTUCKET DEMOGRAPHICS -DRAFT FOR INTERNAL REVIEW-
5 Nantucket and the Local Context for the Master Plan History Nantucket County and the Town of Nantucket includes the islands of Nantucket, Tuckemuck and Muskeget. The islands were originally formed during the Wisconsin Glaciation 11,000 years ago, when the retreating glaciers deposited large mounds of till in the region. The subsequent rise in the ocean left Nantucket as an island, 30 miles south of Cape Cod. Many Wampanoag Native Americans settled on Nantucket after the Europeans moved into Cape Cod. The British began settling Nantucket in earnest in Nantucket developed as a whaling port. In the mid-1800s whaling activity shifted to New Bedford, which had the advantage of rail transportation. A disastrous fire in 1846 contributed to Nantucket s decline. Many inhabitants departed for the mainland. Demographics Nantucket remained neglected and under-developed until the mid-20 th century. It has now been adopted as a summer retreat for the very wealthy. Its proximity to the most populous cities in the nation, its relatively mild climate, the scope it allows for ocean sports and the romantic appeal of an island account for its continuing popularity. The community continues to address the issues of growth and modernization in areas such as controlling the population of cars, control of fast food outlets and big box stores, building codes to preserve its maritime ambiance and environmental safeguards. According to the table, Nantucket County has the lowest population of any in Massachusetts. However, in the summer, seasonal vacationers swell the population to over 50,000. This gives the island and all businesses, including the Nantucket Memorial Airport, a very seasonal economy. All businesses, including the airport, must trade off the problems of insufficient capacity in the summer, and superfluous facilities in the winter. Nantucket experienced by far the strongest population growth of any Massachusetts county between 2000 and The population is well educated, with 42.7 percent holding a university degree, compared to a state average of 38.7 percent. The portion of foreign-born residents is slightly lower than the state average. The county has a very high portion of home ownership, and the median home value is 2.9 times the state average. The average income is 28.8 percent higher than the state average. The median home value for the state is 5.2 times the median household income. This ratio is 11.7 for Nantucket. When combined with high rates of home ownership, these metrics describe a high wealthto-income population that is very dependent on property ownership for financial security. -DRAFT FOR INTERNAL REVIEW-
6 Population County County Seat Growth Massachusetts County Data Proportions of the Population <18 Years University Degree Foreign Born Home Ownership Median Value Homes Massachusetts 6,593, % 21.10% 38.70% 14.70% 63.60% $343,500 $65,981 Barnstable Barnstable 221, % 16.60% 40.50% 6.50% 79.80% $384,200 $60,525 Berkshire Pittsfield 129, % 18.70% 30.20% 4.60% 69.00% $208,100 $48,705 Bristol Taunton 547, % 21.70% 25.10% 12.10% 64.00% $296,400 $55,813 Dukes Edgartown 15, % 18.60% 42.50% 7.50% 81.70% $679,000 $69,760 Essex Salem/ Lawrence 742, % 22.50% 36.40% 14.70% 64.90% $362,300 $65,785 Franklin Greenfield 71, % 18.80% 32.30% 4.10% 69.40% $223,200 $52,246 Hampden Springfield 471, % 23.00% 23.90% 8.60% 63.00% $202,500 $48,866 Hampshire Northampton 156, % 15.70% 42.00% 8.10% 67.20% $263,600 $60,331 Middlesex Cambridge, Lowell 1,505, % 20.90% 49.80% 18.70% 63.40% $410,100 $79,691 Nantucket Nantucket 11, % 21.10% 42.10% 14.00% 70.10% $993,900 $84,979 Norfolk Dedham 666, % 21.90% 48.20% 15.00% 70.40% $398,100 $83,733 Plymouth Plymouth, Brockton 498, % 23.20% 32.90% 8.00% 77.50% $350,700 $74,698 Suffolk Boston 753, % 17.70% 39.20% 27.80% 36.10% $371,300 $51,638 Worcester Worcester 803, % 22.70% 33.30% 10.90% 67.20% $274,900 $65,772 Median Household Income -DRAFT FOR INTERNAL REVIEW-

7 The statistics for Nantucket are most similar to those for nearby Dukes County, Martha s Vineyard. This island also has a small, seasonal population, strong population growth, high educational attainment, very high proportions of home ownership and high property values. Personal incomes for Nantucket are among the highest in the nation. Exhibit 8 summarizes income statistics for the most wealthy counties. $130,000 $120,000 $110,000 $100,000 $90,000 $80,000 $70,000 $60,000 $50,000 $40,000 Per Capita Income Summary for America s Wealthiest Counties, 2011 Source: Bureau of Economic Analysis Table CA1-3 -DRAFT FOR INTERNAL REVIEW- 4-1

8 The wealthiest counties include both sparsely populated entities in the west that have large natural resource deposits, and those neighboring large cities. Only Nantucket belongs to neither group. The high incomes imply a high propensity to travel. Several persons interviewed suggested that Nantucket s demographics were changing. Specifically, it was suggested that the New York-Boston-Washington dominance was shifting and that foreign residents were increasing their presence. The Assessor s Office of the Town and County of Nantucket tracks property sales. A review of property sales for examined the areas of residence of property purchasers. Exhibit 9 shows that residency is still heavily concentrated in the U.S. northeast. There have been very few sales to foreign nationals. 0% 0% Massachusetts 54% Other 1% West 1% New York 9% Tex-Ok-NM 1% South 2% California 2% New England 3% Pennsylvania and Delaware 3% Midwest 4% Florida 4% Connecticut 7% New Jersey 4% Maryland-DC- Virginia 5% Year-round Residence of Recent Property Buyers Source: Town and County of Nantucket Assessor s Office -DRAFT FOR INTERNAL REVIEW- 4-2
9 The Island Economy and Tourism Nantucket owes its prosperity to its unique role as a summer retreat. As an island, it offers the attractions of isolation. However, it lies within one day s driving distance of forty million people. To preserve its ambiance, the county has enforced strict zoning controls, has prevented certain businesses from locating on the island and has considered more aggressive controls on motorized vehicles. It still eschews traffic lights. Many visitors drive to Hyannis and park their cars in airport or ferry lots. A survey of the license plates can reveal their points of origin. A survey of the Hyannis airport parking lot on August 11, 2013 confirmed the Chamber of Commerce information on visitor origins. Of the 442 cars, 321 or 72.6 percent originated in Massachusetts. 65 vehicles or 14.7 percent originated in other New England states. 31 cars or 7.3 percent came from New York and New Jersey. California, Florida, North Carolina, Virginia, Maryland and the District of Columbia accounted for the remainder. Nantucket competes most immediately with Martha s Vineyard, Block Island and parts of Cape Cod. North Carolina s Outer Banks are becoming increasingly popular destinations because of their relative proximity to the Northeast. Florida, the Caribbean and the Mediterranean are also popular alternatives. These resorts do not face the problems of a cold winter season to the same degree as Nantucket. Most visitors stay in homes rented from Nantucket residents, renting accommodation by the week. There are relatively few hotels. This pattern favors relatively long visits (a week or more). Since ferrying vehicles to and from the mainland is expensive, time-consuming and requires advanced reservations, Nantucket is best able to serve visitors who stay more than a few days. The system of home rentals and small bed-and-breakfast businesses is very fragmented. It inhibits gathering tourist data. There are very few statistics on visitor behavior, expenditures, most popular attractions or other elements. Most visitors originate in New York City, Philadelphia and Washington. Canada, particularly Toronto, is a growing market, spurred partly by the depreciation of the U.S. Dollar. The interviews suggested that the United Kingdom, Ireland and France are also growing markets. Japan Air Lines new Boston-Tokyo nonstop flight could stimulate tourism visits from the Far East. Nantucket s tourism has also benefited from the damage caused elsewhere by hurricane Sandy. The island has targeted the lgbt (lesbian, gay, bisexual, transgender) segment. This group tends to be very wealthy and quick to respond to new travel opportunities. The island also experiences some cruise ship activity, although the harbor is shallow and subject to silting. Nantucket has discouraged many economic activities that could conflict with tourism. Many tradespersons must commute to and from the island by ferry or aircraft. This significantly increases the costs of many services. -DRAFT FOR INTERNAL REVIEW- 4-3


10 The most important concern; for the airport, the island and the tourist industry is seasonality. Virtually every activity enjoys a very large peak between June and September. During the other months, tourism visits virtually cease, Cape Air transfers many aircraft to the Caribbean, tourism-focused businesses close and permanent residents return to their homes. The island continues to pursue shoulder-season (May, September-October) activity. Major initiatives include pursuing special events, festivals, a project to rebuild the Dreamland Theater and university research. These initiatives face several challenges, particularly since the home-based accommodation centers on week-long occupancy during the peak. The new Cape Flyer train may permit weekend trips from Boston. When combined with the high speed ferries, it offers attractive options for visiting the island. The train operates from Memorial Day to Columbus Day, thereby creating opportunities for much of the shoulder season. -DRAFT FOR INTERNAL REVIEW- 4-4
11 Summary Nantucket Memorial Airport Master Plan The United States will continue its slow recovery from the financial crisis of While corporate profits have strengthened, employers have not started large scale hiring. Investments in plant and equipment remain weak. Both employment and capital formation must accelerate for any solid recovery. The Federal Reserve will continue its open market operations for the indefinite future until employment strengthens. The United States in the longer term will benefit from a relatively high population growth rate. Major concerns include the government deficit, the trade deficit, the need for a reform of the medical/health system and the growing inequality. However, any depreciation of the U.S. dollar would be highly favorable to manufacturing and tourism. The GDP of the United States will grow more rapidly than those of advanced nations. However, growth rates will be substantially less than those of newly industrializing countries in Latin America, Asia and Africa. Nantucket is Massachusetts smallest county by population. It has among the highest average incomes in the nation. Household wealth is especially high because of the elevated property values. The island s population increases by a factor of four every summer. People from New York, Boston and Washington make recreational visits. They tend to rent homes from residents rather than use hotels. The island s business community is promoting tourism during the spring and fall shoulder seasons. The airline industry in 2013 is slightly profitable. The modest earnings are altogether insufficient to offset the very heavy losses after The inherent nature of the industry its inability to store product in inventory, the intense competition that results from a deregulated market and the airlines inability to react quickly to declining traffic will lead to further losses and industry instability. The recent airline mergers have not reduced the number of carriers serving Nantucket. In all cases, the airline that served Nantucket merged with an airline that did not serve the island. The mergers, by increasing the level of concentration on domestic routes, could lead to higher fares and decreased competition from Nantucket. They reduce the number of candidates that the airport might approach in its efforts to obtain better air services. The declining use of 50-seat regional jets will complicate efforts by many communities to obtain new air services. The 70 seat aircraft has become the de facto minimum size for domestic routes. This raises the volume of traffic that an airport must offer to obtain new services. Nantucket accommodates many business aircraft. These flights primarily serve celebrities and other ultra-high income people who visit Nantucket. These flight operations are relatively insensitive to economic conditions. General aviation faces growing concerns over the supply of aviation gasoline. The tetraethyl lead used in aviation gasoline is a leading source of lead in the environment. -DRAFT FOR INTERNAL REVIEW- 4-5
12 APPENDIX C U.S. ECONOMIC OUTLOOK -DRAFT FOR INTERNAL REVIEW- 4-6
13 Air travel is very sensitive to economic conditions. Between 2007 and 2009, the traffic of U.S. airlines, as measured by passenger-miles, fell by 7.2 percent because of the world financial crisis 1. The forecasts of activity at the Nantucket Memorial Airport should therefore recognize and reflect the most important factors affecting economic growth. C1. U.S. Economic Outlook to 2016 In the short run, the United States continues to recover from the financial crisis of The problems of inflated housing prices, excessive household debt and a severely weakened financial sector have damaged the foundations of the American economy. Shocks that affect household wealth and the solvency of the financial sector tend to cause a stronger contraction and require a longer period of recovery than for a more common cyclical recession. In the second quarter of 2013, the real Gross Domestic Product expanded at an annualized rate of 1.7 percent. This compares to 2.4 percent for and 3.1 percent for By the fall of 2013, the corporate sector had largely recovered from the recession. The severe headcount reductions, combined with strengthening demand, have resulted in very high profits. Company balance sheets are relatively strong, and many companies hold very large quantities of cash. These dynamics have not prompted a strong recovery in the labor market. Businesses have been rehiring staff only tepidly, and the jobless recovery remains a source of widespread social frustration. Despite the strong profits and rebounding demand, most corporations do not expect large investment/growth opportunities. Business investment, a key driver of the economic cycle, remains weak. Many companies are using their expanded cash holdings for dividends and share buybacks rather than for investments in productive plant. The economy will remain sluggish until businesses again make investments in plant and equipment and restore hiring. The very low interest rates, while creating abundant liquidity, have failed to stimulate investment because of the lack of business confidence. The government is no longer initiating large capital investments in infrastructure to stimulate activity directly. The federal deficit, the large stimulation expenditures since 2008, decreased income tax revenues and growing entitlement payments have left the government little room to cut taxes. Fiscal policies therefore offer few opportunities to restore growth. Higher taxes could lead to a slower recovery. The Federal Open Market Committee continues to purchase $85 billion in long term treasuries per month. These expenditures provide liquidity and help keep interest rates low. In the spring of 2013, the Federal Reserve had proposed slowly discontinuing the program. September 2013 saw disappointingly high unemployment rates prevailing and more pessimistic expectations for GDP growth in The Federal Reserve plans to continue the program until unemployment rates decline significantly. The U.S. government budgeting process remains a potential complication. The August 2011 budget ceiling debate and the Sequestration of Spring 2013 highlight the uncertainties inherent in the political process. A further budget discussion looms in October Whatever the outcome, the political brinkmanship could increase any corporate reluctance to invest, raise long term interest rates, and make already nervous financial markets more risk-averse. 1 Source: Bureau of Transportation Statistics, United States Department of Transportation as reproduced by the Air Transport Association of America. 2 Source: Bureau of Economic Analysis -DRAFT FOR INTERNAL REVIEW- 4-7
14 The short term outlook calls for a slow but continuing recovery. As GDP expands, employers will eventually be unable to meet demands by current work forces, and will need to resume hiring. Any such expansion will also encourage new business investment. This will necessitate further hiring. Large corporate cash balances will encourage investment of retained earnings. Real interest rates will remain low, promoting further gains in the housing sector. The rates will encourage broad-based consumption. The low rates could, in the long run, encourage excessive household leverage and permit the appearance of new asset bubbles. The Federal Reserve now (September 2013) expects current GDP growth of between 2 and 2.3 percent for the rest of These forecasts were lower than the outlook of May 2013, and were the basis for its decision to continue a permissive monetary policy will see growth of between 2.9 and 3.1 percent. Unemployment rates for 2013 will range between 7.1 and 7.3 percent. The central bank expects unemployment rates to fall gradually; to percent in 2014 and to percent in The slow recovery will continue in The Conference Board has forecast a 1.6 percent growth in real GDP in 2013, and 2.6 percent in In January 2013, the International Monetary Policy called for 3.0 percent growth in C2. U.S. Economic Outlook to 2035 The Master Plan will include traffic forecasts to The economic conditions include short term, inherently non-forecastable short term concerns such as the debt ceiling debates in Washington, and longer term trends affecting the global reallocation of economic power and the underlying structure of the economy. The long term traffic forecasts depend on the latter variables. The last three decades have seen rapid changes in the global distribution of economic activity. Growth has been especially strong in Africa, the Middle East, Indian Subcontinent and the Far East. Many residents of these areas originally worked at subsistence farming or other primary jobs. Simply redirecting these resources from low productivity agriculture to high productivity manufacturing has stimulated national economic growth. The expansion will continue as long as these reserves of underemployed persons remain. In contrast, the mature economies of the United States, Western Europe have long had sophisticated, highly productive labor forces and abundant capital. They have a long tradition of allowing women to participate in the labor force. Their growth has depended on more productive capital (e.g. superior information processing) and persons shifting to more productive jobs. The shift to a service-oriented economy has tended to suppress growth. Many services have very few opportunities to boost productivity. Among mature economies, the United States has a very favorable outlook in the long term. It is rich in natural resources, and is becoming self-sufficient in energy. It has many of the world s best universities and accounts for far more than its share of new patents. Its corporate sector is strong and resilient, and its financial markets are the most sophisticated and competitive in the world. It faces several key issues a) GDP growth and population; b) government deficits and the national debt: and c) distribution of income. 3 International Monetary Fund, Hopes, Realities and Risks, April DRAFT FOR INTERNAL REVIEW- 4-8
15 a) GDP Growth and Population Nantucket Memorial Airport Master Plan Exhibit 1 shows worldwide trends in GDP growth. The mature economies of the U.S., South Pacific (mostly Australia and New Zealand), and Europe have experienced a progressive slowing of economic growth. Their shares of world economic activity have fallen. Japan has displayed a similar but even stronger leveling. However, Japan s data in the table have been combined with fast growing economies in the remainder of Asia. In contrast, South America, Africa, the Middle East/Subcontinent, and Far East have experienced accelerating growth through the mobilization of underutilized productive assets. Exhibit 1: REAL WORLD GDP BY REGION SHARE OF WORLD TOTAL ANNUAL GROWTH United States 24.80% 23.63% 20.22% 3.11% 1.82% Central America and Caribbean 5.49% 5.18% 4.50% 3.42% 2.26% South America 6.25% 5.73% 5.85% 2.54% 3.45% Europe 31.12% 30.86% 26.76% 2.18% 1.52% Africa 3.92% 3.43% 4.05% 2.41% 4.88% Middle East and Subcontinent 7.12% 8.01% 10.52% 4.93% 5.71% Far East 19.75% 21.69% 26.71% 3.44% 3.81% South Pacific 1.55% 1.47% 1.40% 3.18% 2.98% Sources: World Bank, International Monetary Fund, Bureau of Economic Analysis. Calculations are based Purchasing Power Parity methodology. The United States will likely experience slower GDP growth to 2035 than it has since However, it will benefit from relatively strong population growth. Immigration will contribute to GDP growth. Exhibit 2 compares different population growth rates to Several countries in Western Europe, Japan, South Korea and Russia will see a declining population. Average ages will increase and labor force participation rates will decrease, curtailing economic growth and possibly even leading to social frictions. The very slow population growth in China, partly the product of the government s one child policies, will suppress GDP growth throughout the period. Although it experiences the lower growth rate of a mature economy, the strong population growth in the United States will help it outpace many other developed countries. The U.S. Dollar will likely experience a long term loss of value. The government deficit, current aggressive monetary policies and the large foreign trade deficit will contribute to downward pressures. A lower exchange rate could prove an important stimulus to exports and foreign tourism. U.S. manufacturers of high value goods could particularly benefit. -DRAFT FOR INTERNAL REVIEW- 4-9
16 1.20% 1.00% 0.80% 0.60% 0.40% Population Growth per Year 0.20% 0.00% -0.20% -0.40% -0.60% -0.80% Exhibit 2: Expected Compounded Annual Population Growth Rates to 2030 Source: United States Census Bureau b) U.S. Government Deficits and the National Debt The large government deficit in the United States will be a source of volatility. Much of the newly issued debt has been purchased by Asian countries to help maintain U.S. demands for imported goods. However, the large buildup of U.S. treasuries overseas has caused growing anxieties. Foreign transactors are especially concerned that a depreciation of the dollar will reduce the values of their large holdings. The deficit for 2013, at 4 percent of the GDP, is the lowest since However, a slowly growing economy, extensive unemployment and diminished household wealth will complicate any austerity measures or any initiatives to balance the budget. Any government actions could suppress the recovery. The United States had a government debt of 8.7 percent of GDP in The expected improvement to 2012 reflects tax changes, the end of stimulation payments, stronger employment, economic growth and government austerity measures. Other governments facing debt problems imposed austerity measures, but used the growing GDP to ease the debt to GDP ratio. With the U.S. GDP showing only weak growth, this mechanism is not available. Exhibit 3 compares government deficits and debts for selected countries. The conditions for each country vary extensively. For example, most of the Japanese debt is held by residents. Spain suffers from a particularly severe unemployment problem, making its debt particular difficult to manage. Being on the Euro, it and other European economies do not have the monetary latitude of the United States. -DRAFT FOR INTERNAL REVIEW- 4-10
17 Exhibit 3: National Deficits and Debts Forecast for 2014 Government Deficit as Percent of GDP, Forecast for 2014 Central Government Debt as Percentage of GDP, 2012 Canada France Germany Greece Italy Japan Portugal Spain United Kingdom United States Sources: Organization for Economic Development and Cooperation: Government Deficit/surplus as a Percentage of GDP, International Monetary Fund: Government Debt as Percent of GDP c) Distribution of Income The United States faces a growing problem of economic equity. The nation historically has been very tolerant of large ranges in income. The absence of a class structure, the high economic mobility and the wide availability of opportunities have been substitutes for a more even distribution of income. Technical progress and regulatory reform have made commercial aviation a service of mass consumption. Most studies of air transport demand have focused on GDP and fares. However, it is essential that national income be distributed among households in a manner that promotes air transport consumption. The United States must confront long term issues of personal equity. The society has become less equal over time, as shown by Exhibit 4. The two lowest percentiles received less income in 2010 than in The two highest have benefitted from a rapid growth. In 1970, the lowest percentile received 4.1 percent of national income; this fell to 3.3 percent in This trend is at variance with most other advanced countries. It has many causes, including a limited access to health insurance by casual or part-time workers, and slowly growing economy, high educational expenses and several aspects of the taxation system 4. The equity issue is an important structural problem. It will have a growing impact on crime rates, personal achievement, productivity, savings and economic growth. The distribution of income will also affect all aspects of personal travel. While Nantucket is primarily a haven for very wealthy persons, it will be impacted significantly by any concerns related to the distribution of income. 4 For example, under the Bush Administration tax changes, dividends are taxed at the lowest possible marginal rate. This benefits high income persons, but provides few benefits to persons in the lowest tax brackets. -DRAFT FOR INTERNAL REVIEW- 4-11
18 Exhibit 4: Income Distribution in the United States Average Household Income, $2010 Lowest Fifth 11,034 11, Second 28,636 29,158 27,309 Third 49,309 48,161 43,540 Fourth 79,040 72,613 61,374 Highest Fifth 169, , ,653 Share of Total Income Lowest Fifth Second Third Fourth Highest Fifth Source: United States Bureau of the Census, Table A-3, Selected Measures of Household Income Disparities, 1967 to DRAFT FOR INTERNAL REVIEW- 4-12
19 APPENDIX D AIRLINE SERVICE DEFINITION OF TERMS -DRAFT FOR INTERNAL REVIEW- 4-13
20 Air Carrier An aircraft that has more than 60 passenger seats, and/or more than 60,000 lb. payload. Air Taxi An aircraft that has less than 60 passenger seats, and/or less than 60,000 lb. payload. ASM (Available Seat Mile) one seat (empty or full) flown one mile. Often referred to as the airlines industry s measure of capacity. CASM (Cost per Available Seat Mile) the average cost of flying an aircraft seat (empty or full) one mile. Often referred to as a unit cost measurement. Calculated as Total Operating Expenses/Total Available Seat Miles. Connecting Passenger one passenger that connects from one flight to another flight. DOT (U.S. Department of Transportation) Established by an act of Congress on October 15, 1966, the DOT consists of the Office of the Secretary and eleven individual operating administrations. Leadership of the DOT is provided by the Secretary of Transportation, who is the principal adviser to the President in all matters relating to federal transportation programs. Enplaned Passenger One passenger, originating or connecting, boarded on an air carrier or air taxi aircraft. FAA the Federal Aviation Administration Established by an act of Congress in 1958 (PL ), the FAA is an agency within the U.S. DOT. Federal Aviation Regulation Part 121 Operating Requirements: Domestic, Flag, and Supplemental Operations - FAA regulation governing the operation of certificated air carriers that operate aircraft with more than 9 passenger seats. Federal Aviation Regulation Part 135 Operating Requirements: Commuter and On Demand Operations - FAA regulation governing the operation of certificated air carriers that operate aircraft with more than 9 passenger seats Load Factor The percentage of a plane filled with paying passengers. Calculated as Revenue Passenger Miles (RPM)/Available Seat Miles (ASM). Major Airline a certificated air carrier that generates more than $1 billion in annual revenues. In2013 there were 17 major airlines in the U.S. Origin & Destination Passenger (O&D) One passenger that begins and ends their trip without connecting with another flight. Passenger Yield (Passenger Revenue Yield per Revenue Passenger Mile) The average amount of revenue received per paying passenger flown one mile. Calculated as Passenger Revenues/Revenue Passenger Miles. PRASM (Passenger Revenue per Available Seat Mile) Passenger Revenue per seat (empty or full) flown one mile. Often referred to as a passenger unit revenue measurement. Calculated as Passenger Revenues/Available Seat Miles. RASM (Revenue per Available Seat Mile) Total Operating Revenue per seat (empty or full) flown one mile. Often referred to as a unit revenue measurement. Calculated as Total Operating Revenues/Available Seat Miles. Revenue Passengers Carried The number of Origination and Destination (O&D) paying passengers. (O&D a measure of the point of origination of a passenger to the final destination). RPM (Revenue Passenger Mile) One paying passenger flown one mile. Often referred to as the airline industry s measure of traffic. -DRAFT FOR INTERNAL REVIEW- 4-14
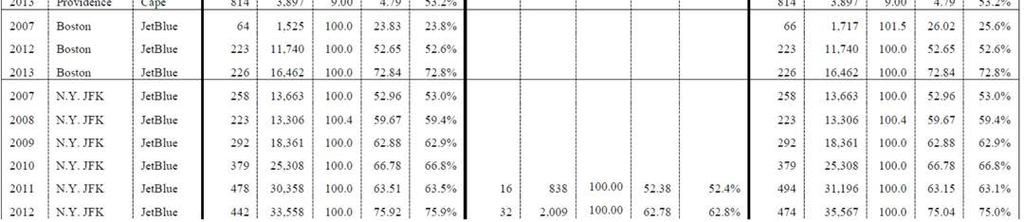
21 APPENDIX E SCHEDULED AIRLINE PASSENGER O&D MARKETS NANTUCKET AIRPORT AND VARIOUS DESTINATIONS DRAFT FOR INTERNAL REVIEW- 4-15


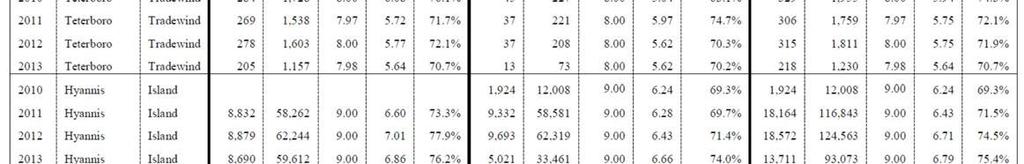
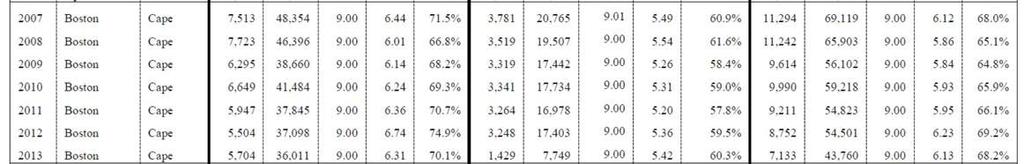
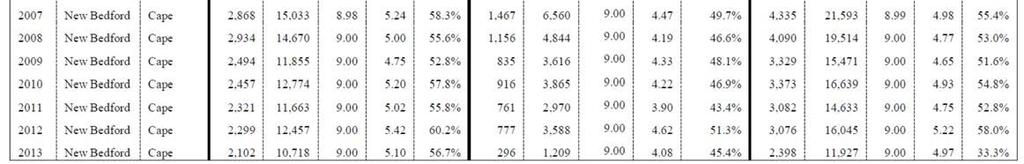
22 -DRAFT FOR INTERNAL REVIEW- 4-16


23 -DRAFT FOR INTERNAL REVIEW- 4-17
24 -DRAFT FOR INTERNAL REVIEW- 4-18
25 APPENDIX F CAPE AIR AND NANTUCKET AIRLINES HISTORY AND OVERVIEW Source: Wikipedia -DRAFT FOR INTERNAL REVIEW- 4-19

26 IATA 9K Founded 1989 ICAO KAP Callsign CAIR AOC # HYIA145B Hubs Focus cities Fleet size 80 Destinations 36 Barnstable Municipal Airport Luis Muñoz Marín International Airport Boston Logan International Airport Lambert-St. Louis International Airport Nantucket Memorial Airport Albany International Airport Martha's Vineyard Airport Company slogan Headquarters Key people Website We're your wings Barnstable, Massachusetts, USA Daniel A. Wolf, CEO Linda Markham, President [from March 18, 2013] capeair.com nantucketairlines.com Hyannis Air Service, Inc., operating as Cape Air, is an airline headquartered at Barnstable Municipal Airport in Barnstable, Massachusetts, United States. It operates scheduled passenger services in the Northeast, Florida, the Caribbean, Midwest, and Micronesia. Flights in Micronesia are operated as United Express flights through a code share partnership with United Airlines. Flights between Hyannis and Nantucket, Massachusetts, are operated under the Nantucket Airlines brand, also operated by Hyannis Air Service, Inc. -DRAFT FOR INTERNAL REVIEW- 4-20

27 A Cape Air ATR 42 in Guam, wearing codeshare colors History The airline was co-founded in 1988 by company pilots Craig Stewart and Dan Wolf, and investor Grant Wilson. Initially, Cape Air flew between Provincetown and Boston in Massachusetts, but throughout the early 1990s new routes were added to destinations across southeastern New England. In 1994, Cape Air and Nantucket Airlines merged and now offer hourly flights between Nantucket and Hyannis.Services in Florida and the Caribbean were added in the late 1990s marked the launch year of FAR Part 121 certification and a new hub of operations in Guam. This included a new fleet type consisting of 3 ATR-42 Turboprop aircraft. The startup team, lead by Pacific Administrator and Captain Russell Price, launched scheduled service in July 2004 with the 3 ATR aircraft and 2 of the C402. Service was as a Continental Connection Carrier, flying from Guam to the Northern Mariana Islands of Saipan and Rota. Due to the International Dateline and the midnight connecting service to/from Japan, it was sometimes referred to as "America's First Flight" i.e.: the first departure daily of any airline flight in the USA. In late 2007, the airline began a new round of expansion in the Northeast and Midwest. On November 1, 2007, the airline began service between Boston and Rutland, Vermont, with three daily round trips. The route is subsidized by the U.S. government under the Essential Air Service (EAS) program. With the help of a government grant, Cape Air expanded into Indiana on November 13, 2007, offering flights from Indianapolis to Evansville and South Bend. The airline did not get the passengers numbers needed to be financially successful once subsidies would come to an end. The last Cape Air flight in Indiana was on August 31, The airline expanded into upstate New York in early 2008, following the sudden demise of Delta Connection carrier Big Sky Airlines. Cape Air began flying three daily round-trips on Essential Air Service routes from Boston to the Adirondack cities of Plattsburgh and Saranac Lake on February 12, The airline continued its expansion into New York when they started to fly the EAS routes out of Albany to Watertown, Ogdensburg, and Massena, and Rutland Airport. Cape Air commenced service from Rockland, Maine, and Lebanon, New Hampshire, to Boston on November 1, Cape Air is currently the only airline offering commercial flights out of Lebanon. Cape Air also flies to/from Westchester County Airport to/from Nantucket and Martha's Vineyard, initially for seasonal summer flights, which has since become year round. The company recently purchased four additional Cessna 402's to assist with the recent growth. -DRAFT FOR INTERNAL REVIEW- 4-21
28 Cape Air was also looking to offer service on the west coast. Cape Air submitted bids to offer service between Newport and Portland in the state of Oregon. The airline was hoping to be selected by the Newport city council to receive a financial grant to jump-start the service. Ultimately they lost out to SeaPort Airlines, which was able to get the service going sooner than the 2010 date that Cape Air had submitted. The airline also operated in the mid-atlantic region. Cape Air provided scheduled flights from both the Hagerstown Regional Airport and the Lancaster Airport to the Baltimore-Washington International Airport. Service out of BWI ended in October In September 2010, the U.S. Department of Transportation selected Cape Air to fly a federally subsidized route connecting Augusta, Maine, and Boston. For serving the route, Cape Air receives an annual subsidy of $1.4 million from the federal Essential Air Service program, commonly known as EAS. Service to/from Augusta began in December Cape Air operates EAS Service from Lambert-St. Louis International Airport to Cape Girardeau, MO; Kirksville, MO; Ft. Leonard Wood, MO; Marion, IL, Quincy, IL; and Owensboro, KY. Cape Air has held discussions with airport officials to offer service between Pittsburgh International Airport and Arnold Palmer Regional Airport in Latrobe, Pennsylvania and Erie International Airport in Erie, Pennsylvania. Cape Air is the largest independent regional airline in the United States and carried almost 700,000 passengers in 2011, with new routes driving steady increases over time. Cape Air offers up to 550 daily flights system wide. Nantucket Airlines Nantucket Airlines, Cape Air's sister airline, operates Cape Air service under the Nantucket Airlines name. Flights depart hourly, and operate between Nantucket (Nantucket Memorial Airport) and Hyannis (Barnstable Municipal Airport). Cape Air also uses Nantucket Airlines planes to transfer passengers between Boston's Logan Intl. Airport and Nantucket Memorial Airport. -DRAFT FOR INTERNAL REVIEW- 4-22
29 Destinations City Airport Notes Northeast Massachusetts Boston Logan International Airport Hub Hyannis Barnstable Municipal Airport Main Hub Martha's Vineyard Nantucket New Bedford Provincetown Maine Martha's Vineyard Airport Nantucket Memorial Airport New Bedford Regional Airport Provincetown Municipal Airport Select service is operated by Cape Air's sister airline, Nantucket Airlines Augusta Augusta State Airport Essential Air Service Bar Harbor Hancock County-Bar Harbor Airport Essential Air Service Rockland Knox County Regional Airport Essential Air Service New Hampshire Lebanon Lebanon Municipal Airport Essential Air Service New York Albany Albany International Airport Focus City Massena Massena International Airport Essential Air Service Ogdensburg Ogdensburg International Airport Essential Air Service Saranac Lake Adirondack Regional Airport Essential Air Service White Plains Rhode Island Westchester County Airport Providence T. F. Green Airport Seasonal service Vermont Rutland Midwest Illinois Rutland Southern Vermont Regional Airport Essential Air Service Marion Williamson County Regional Airport Essential Air Service Quincy Quincy Regional Airport Essential Air Service Kentucky Owensboro Owensboro-Daviess County Regional Airport Essential Air Service -DRAFT FOR INTERNAL REVIEW- 4-23
30 Missouri Nantucket Memorial Airport Master Plan Cape Girardeau Cape Girardeau Regional Airport Essential Air Service Ft. Leonard Wood Waynesville-St. Robert Regional Airport Essential Air Service Kirksville Kirksville Regional Airport Essential Air Service St. Louis Florida & Caribbean Anguilla The Valley Florida Lambert-St. Louis International Airport Hub Clayton J. Lloyd International Airport Fort Myers Southwest Florida International Airport Ends November 4, 2013 [1] Key West Key West International Airport Ends November 4, 2013 [1] British Virgin Islands Tortola Terrance B. Lettsome International Airport Virgin Gorda Virgin Gorda Airport [2] Begins December 17, 2013 Puerto Rico Culebra [3] Benjamín Rivera Noriega Airport Begins December 18, 2013 Mayagüez Eugenio María de Hostos Airport Essential Air Service San Juan Vieques United States Virgin Islands St. Croix St. Thomas Micronesia Guam Guam Northern Mariana Islands Rota Saipan Luis Muñoz Marín International Airport Hub Antonio Rivera Rodríguez Airport Henry E. Rohlsen Airport Cyril E. King Airport Antonio B. Won Pat International Airport Rota International Airport Saipan International Airport operated as an United Express codeshare operated as an United Express codeshare operated as an United Express codeshare Codeshares United Airlines All Cape Air flights in Micronesia are operated as United Express in a codeshare agreement with United Airlines. This service was formerly operated as Continental Connection for Continental Airlines, but when United received a single operating certificate from the FAA on November 30, 2011 it was renamed United Express. Cape Air's Caribbean flights also have a codeshare with United, but are not operated as United Express. -DRAFT FOR INTERNAL REVIEW- 4-24
31 JetBlue Since February 2007 Cape Air and JetBlue Airways have had an interline agreement. The agreement allows Cape Air to carry JetBlue Airways passengers from Boston's Logan Airport and San Juan to Cape Air's destinations throughout the Northeast, Florida and the Caribbean. The agreement allows customers on both airlines to purchase seats on both airlines under one reservation. Customers also get their baggage transferred and Cape Air and JetBlue Airways are located in the same terminal in Boston and San Juan which allows for an easy connection. American Airlines Cape Air and American Airlines announced a codeshare agreement for the Caribbean in February of The cities served by the AA codeshare are Anguilla, Nevis, Tortola, Vieques and Mayaguez. In the Midwest, Cape Air and American have had a codeshare agreement since 2010, which allows passengers from Quincy and Marion, Il; Cape Girardeau, Kirksville, and Fort Leonard Wood, Missouri to connect in St. Louis, Mo. Fleet As of September 2013, Cape Air's fleet consists of the following aircraft: Type Fleet Orders Passengers Notes ATR Operated in Micronesia. Cessna (+1) B-N Islander Operated in the Caribbean. In November 2010, Cape Air announced that it was considering new aircraft types to replace the Cessna 402. On April 18, 2011, Tecnam, an Italian company announced it will be producing the Tecnam P2012 Traveller. The aircraft will be ready for delivery in Accidents and incidents On January 30, 2001, a Cape Air pilot and his only passenger were injured when a Cessna 402C crashed just short of the Martha's Vineyard Airport on a flight from T. F. Green Airport in Warwick, Rhode Island. In June 2007, Cape Air CEO Daniel Wolf announced the grounding of all of Cape Air's 49 Cessna 402C aircraft nationwide, after three in-flight engine failures. The problem was blamed on premature wear on the crankshaft counterweight. All 402 services were canceled for two days while the counterweights were inspected and replaced as necessary. Normal service resumed about four days after the initial fleet grounding. [14] The FAA stated that they were monitoring repairs, but that all action taken by Cape Air was voluntary and not ordered by the FAA. "They elected to do the right thing for safety." [15] On September 26, 2008, a repositioning flight with no passengers on board departed Martha s Vineyard at 8:05 pm en route to Boston. Shortly after takeoff from runway 33, the plane went down about two and a half miles from the airport, killing the pilot, who was the sole occupant. [15] Prior to this date, Cape Air had maintained a fatality-free record over its 18-year history. [16] On January 22, 2009, a Cape Air 402C with six passengers aboard during a night flight from Key West, FL to Fort Myers, FL lost power in both engines as a result of fuel starvation due to faulty maintenance of the fuel selector. The aircraft made a successful emergency landing at Naples Municipal Airport. -DRAFT FOR INTERNAL REVIEW- 4-25
32 APPENDIX G AIRLINE INDUSTRY OVERVIEW -DRAFT FOR INTERNAL REVIEW- 4-26
33 Airline Consolidation Nantucket Memorial Airport Master Plan This century has witnessed a continuing consolidation of the airline industry. Exhibit 6 lists the most important mergers for airlines of the United States. All carriers mentioned in the table are themselves the product of earlier mergers. Recent overseas mergers include Air France-KLM, British Airways-Iberia and Austrian/Swiss/Lufthansa. China, the home of many new and small airlines, has forced a consolidation into several large airlines. Recent U.S. Airline Mergers Surviving Entity Absorbed Entity Year American Airlines Trans World 2001 America West US Airways 2005 Southwest Airlines AirTran 2010 Delta Air Lines Northwest 2008 United Airlines Continental 2012 Republic Airline Holdings Frontier, Midwest Airlines 2009 US Airways American Airlines 2013 Mergers allow airlines to expand their networks rapidly. While U.S. airlines have few formal barriers to entry on existing routes, an airline seeking to expand its network by internal growth must usually proceed slowly, and could experience severe losses if the incumbents retaliate. Several mergers were prompted by the desire to increase ticket prices. The merged entity could rationalize the networks of the two predecessors, eliminating superfluous hubs and flights. By reducing capacity, it could purportedly increase fares and profits. However, there is no strong evidence to support this belief. A newly merged company attempting to raise fares might merely invite new competitors into its key markets. Should the industry as a whole attempt to raise post-merger fares, it might even face a new entrant. Although the environment is very hostile to new airlines, excessive cutbacks by the industry might prompt new airlines to offer service. Several communities have lost their hubs as a result of mergers; Baltimore (US Airways acquired Piedmont), Memphis (Delta, Northwest) and St. Louis (Trans World, American). Other cities are at risk of losing their hubs, include Cleveland (United/Continental) and Cincinnati (Delta, Northwest). No recent or proposed merger has directly reduced the number of airlines serving Nantucket. In all cases, if an airline that served Nantucket participated in the merger, the other party did not serve Nantucket. The merger, if it affected Nantucket at all, led to a much larger network and many new online (no enroute change of airline) travel options. For example, Continental Airline served Nantucket from Newark. When United Airlines assumed control of Continental, Nantucket immediately belonged to a new and much larger network, with hubs at Washington Dulles, Chicago, Denver, Houston, Cleveland and San Francisco, and a superb international network. Since United had not previously served Nantucket, the transaction had no visible anti-competitive effects. A similar pattern governs the Delta/northwest and proposed US Airways/American mergers. -DRAFT FOR INTERNAL REVIEW- 4-27
34 Despite these findings, the merger trend has had adverse effects for many airports, possibly including Nantucket. An airline that does not serve Nantucket can still be important to the island. The fact that it might begin services exerts a pricing discipline on the incumbents. The merger could make the domestic market as a whole less competitive. The higher fares could then suppress traffic growth. The mergers greatly reduce the number of candidates that an airport might pursue for new services. The mergers could reduce competition on many trunk routes. Any reduced competition between New York and San Francisco might result in poorer options for Nantucket-San Francisco passengers. If the mergers succeed in raising domestic fares, the airlines will only assign capacity to Nantucket if its fares rise too. There is no clear evidence that airline mergers lead to higher fares. Airlines have very mobile assets, and any high fare opportunities will quickly receive new capacity, thereby lowering the fares. The problems of unsustainably low fares and excess capacity are inherent in the industry. Consolidation will not remove these obstacles. While the post-consolidation industry could be oligopolistic, and carriers will continue to recognize their interdependence, the temptations to increase capacity in profitable markets will likely overcome any desires to control capacity growth and stabilize fares, A Maturing Industry The past decades have seen air travel evolve from a luxury service enjoyed only by a wealthy jet set into an item of mass consumption. Traffic volumes have shown several decades of strong growth. Between 1970 and 2110, air traffic for the United States has grown at a compound annual rate of 4.7 percent, compared to 3.1 percent for the GDP. A major process driving the growth has been declining real (adjusted for inflation) ticket prices. The 1.4 percent annual decline has been a central factor in making air transport so widely available. Several factors have contributed to the declining price of air travel: Technology Improvements in such as lightweight materials, advanced alloys, improved avionics, a better knowledge of aerodynamics and better information technology. Improved business practices, including contracting out functions such as maintenance, flying of regional services and ground handling at airports to third parties under arm s length contracts. Technological advances in turn have led to the widespread use of two-person cockpit crews, fuelefficient engines, two engines on even very large wide body aircraft, low maintenance components, better aerodynamic surfaces such as blended winglets, carbon composites on large aerodynamic surfaces and internet-based channels of distribution. These advances have significantly lowered the cost of air travel. Higher load factors, which allow airlines to offer low priced tickets and still generate a profit 5 Market liberalization such the 1978 deregulation of domestic markets and the growing adoption of liberal bilateral agreements on international routes. These advances have forced the airlines to pass the savings of technological progress on to passengers in the form of lower fares. Airlines and manufacturers are continually seeking new cost savings. Their quest will continually become more difficult. The lower the current operating costs, the harder it will be to obtain further 5 According to the Department of Transportation statistics as reproduced by the Air Transport Association, the average load factor on U.S. airlines has increased from 72.4 percent in 2000 to 80.8 percent in Total traffic in revenue passenger miles increased by 18.8 percent although capacity grew by only 3.9 percent. -DRAFT FOR INTERNAL REVIEW- 4-28
35 advances. Fares already fully reflect the use of two-person flight crews and two engines on most aircraft. There are no initiatives to use one-person crews or to rely on one-engine aircraft for mainline domestic and international routes. Many factors of aircraft design are governed by theoretical limits in materials strength, aerodynamic performance, thermodynamics and engine efficiency. With each new advance, finding new cost savings will become harder. Costs will not fall as rapidly in the future as they have in the past, and airlines will have correspondingly fewer opportunities to lower their fares. Airlines must then look to an expanding GDP, not lower costs/fares, as the primary engine of traffic growth. This slowing growth is already well evident. Between 1970 and 1990, the airline industry of the United States grew by 247 percent 6. From 1990 to 2010, the industry expanded by only 74 percent. The future will likely see only slow growth, as increasingly mature technologies place upon a sluggishly growing GDP the primary role for driving the expansion of aviation. High Costs of Regional Jets The fifty seat regional jet first appeared in the 1990s. It allowed many airlines to serve long (up to 1,000 miles) low volume routes that could not justify larger aircraft. Regional jets were especially valuable in allowing airlines to serve altogether new markets, and to offer the high frequency flights required by hub-and-spoke operations. The regional jets helped airlines maintain high frequencies dispute a shrinking market in the period following The smallest regional jets are now economically obsolete. They have much higher per passenger fuel consumptions than larger aircraft. Recent increases in the price of fuel have rendered most routes uneconomic for 50 seat regional jets. Contributing factors include growing maintenance costs as these aircraft age. Despite scope clauses and mainline-regional capacity sharing agreements, high labor costs are a growing problem. Most airlines have disposed of the majority of their smallest regional jets. Canadair has abandoned production of 50 seat regional jets. The 70-seat regional jet has become a de facto minimum viable aircraft on domestic routes. Even it can be difficult to operate profitably. Any increases in fuel costs will accelerate the shift to even larger aircraft. The loss of the smallest regional jets has reduced many communities prospects for new services. The aircraft could be considered for routes such as from Nantucket to Washington Dulles, Charlotte, Detroit and Chicago. These potential destinations have been affected by recent mergers. For example, before the merger with Continental, United Airlines might have been a prospect for regional jet services to Washington or Chicago. Once it merged, United obtained an ex-continental route to Newark. The Newark route could eliminate the justification for routes to the other hubs. The mergers may therefore preclude certain new services even in the absence of problems with the regional jets. Corporate and High Net Worth Travel Trends Nantucket Memorial Airport accommodates a large number of privately owned and operated jets, turboprops, and piston-engine aircraft. At other airports, these aircraft serve mostly large corporations. 6 Source: United States Department of Transportation. Industry size is measured by revenue passenger miles. -DRAFT FOR INTERNAL REVIEW- 4-29
36 Private aircraft allow corporate executives and other high net worth individuals more flexible schedules and enjoy a higher standard of comfort and security than is possible on commercial flights. Some corporate jet operations at Nantucket serve executives on company retreats or other activities. However, most of the high-end private flights cannot be classified as corporate or business related, rather, these high net worth individuals s visit Nantucket for personal/recreational purposes. Many use fractional ownership or chartered (air taxi) aircraft. Data on high net worth individual travel is limited since they place a high value on privacy. The high net worth people who use private jets are relatively unresponsive to economic conditions. While some own their own aircraft, most do not travel sufficiently to justify such outlays. Fractional ownership increases the unit cost per flight, but eliminates many fixed costs. Flight cards are particularly popular among those who travel infrequently. Aircraft manufacturers still have slack production capacity, and are willing to discount their products. The strong corporate profits of 2013 will favor increased corporate aviation. Any increase in fractional ownership fleets to accommodate more corporate flying could benefit celebrity aviation. However, if the fleets do not expand, there will be increased competition between celebrity and corporate aviation for scarce aircraft resources. Supply of Aviation Gasoline Island Airlines serves Nantucket with both turboprop Cessna Grand Caravans and piston-engine Cessna 402s. Cape Air and Nantucket Airline s fleet includes both Cessna 402s and ATR-42s. The latter aircraft operate as a United Express service in Micronesia. In order to operate the ATR 42s, Cape Air had to obtain certification as a Part 121 scheduled carrier. The Cessna 402, which is still operated on most scheduled flights at Nantucket, are relatively old; their maintenance costs are increasing with age; and their piston engines burn 100LL avgas, which faces important supply issues. Most piston-engine aircraft burn 100LL aviation gasoline. Aviation gasoline must meet stricter performance requirements than regular automotive gasoline. Aircraft engines must produce a large amount of power in proportion to their weight. They must continually produce approx. 75 percent of their maximum power, with up to 100 percent during takeoff or during unplanned flight incidents. The higher performance requires a very high compression ratio that usually necessitates the use of a tetraethyl lead additive. The lead prevents the fuel from exploding prematurely in the cylinder ( knocking ), which is both destructive and generates minimal energy. With the lead additive, the fuel burns in a slow, continuous pulse that lasts for the full power stroke of the cylinder. This slower burning allows the engine to operate at higher cylinder pressures and produce the maximum power possible. The tetraethyl lead in aviation gasoline can release toxic lead compounds into the environment. Lead is the basis for several cumulative poisons, and can contribute to mental retardation and criminal behavior by exposed persons. Lead combustion products impair the functioning of catalytic converters, which help reduce air pollution from unburned or partially burned hydrocarbons. The United States launched its first initiatives to ban tetraethyl lead from highway vehicles in The Clean Air Act finally banned -DRAFT FOR INTERNAL REVIEW- 4-30
37 the compound from all road vehicles after There is a strong desire to eliminate tetraethyl lead from all aviation gasoline. Aircraft were excluded from the ban on tetraethyl lead because of their unique performance needs. Some general aviation aircraft can use lead-free gasoline. However, there remains no current or proposed substitute for tetraethyl lead for high performance engines. This exemption has made general aviation by far the largest source of lead pollution 7. The transition away from tetraethyl lead therefore can have an important impact on some scheduled services and many general aviation operations. The United States is now seeking new rules for aviation gasoline and new substitutes for tetraethyl lead 8. The lead problem is an immediate concern. However, the future could see new difficulties for all users of aviation gasoline. General aviation has experienced several decades of decline because of its escalating costs. The demand for aviation gasoline has also fallen. Refiners might eventually cease production of aviation gasoline because of the limited use. Engine makers are now attempting to develop small, high performance diesel engines for use in aircraft. Diesels have seen little aviation use because the high compressions require very heavy engine blocks. A diesel engine suitable for aircraft would greatly encourage small aircraft operations. Aviation Forecasts Most air travel forecasts call for a 2-3 percent growth in air travel in the United States over the next two decades. This compares to the 5.1 percent annual growth for The slow growth reflects the slow growth of the U.S. GDP and the maturing aircraft technology. As equipment becomes more efficient, further economies will become increasingly elusive. Costs and fares will fall at lower rates than previously. Many advances, such as market liberalization, are already reflected in the system. Air travel will grow rapidly in many developing nations. Their economic growth will allow their citizens to enjoy air travel to the same extent as those in the United States. Exhibit 6 summarizes the forecasts of several industry leaders. Comparative Forecasts of Commercial Aviation Growth Period U.S. Passengers World Passengers Boeing Airbus Industrie Embraer Federal Aviation Administration EPA National Emissions Inventory Data and Documentation [website]. Research Triangle Park, NC: Office of Air Quality Planning & Standards, U.S. Environmental Protection Agency (updated 28 Aug 2012). Available: 8 U.S. Environmental Protection Agency. 40 CFR Part 87; Advance Notice of Proposed Rulemaking on Lead Emissions From Piston-Engine Aircraft Using Leaded Aviation Gasoline; Proposed Rule. Fed Reg 75(81): (2010) -DRAFT FOR INTERNAL REVIEW- 4-31
38 APPENDIX H FREIGHT AND AIR MAIL TRAFFIC NANTUCKET AIRPORT -DRAFT FOR INTERNAL REVIEW- 4-32
39 Federal Express Courier Traffic (Pounds) Nantucket Airport Summer Winter Total , , , , , , , , , , , , , , , , , , , , , , , , , , , , ,413 1,377, ,176, ,671 1,595, ,053, ,504 1,447,937 Cape Air Mail (Pounds) Nantucket and Hyannis Winter Summer Total , ,443 1,103, , ,200 1,043, , ,378 1,027, , ,763 1,167, , ,834 1,119, , , , , , , , , , , , , , , , , , ,543 Island Airlines - Air Freight (In Pounds) Nantucket and Hyannis Summer Winter Total 2010 Unkn. 91,270 91, , , , , ,126 1,103, , , ,520 Winter months=november-april. Summer months=may-october 2013 are estimates: January-September 2013 actuals plus October-December 2012 actuals. Source: United States Department of Transportation Database 28DM -DRAFT FOR INTERNAL REVIEW- 4-33
40 APPENDIX I STATE OF FRACTIONAL AIRCRAFT OWNERSHIP PROGRAMS Source: Aviation Week and Space Technology January, 2012 Note: this overview is relevant because many of the corporate and fractional aircraft operators discussed in this article fly into Nantucket Airport. Corporate aviation activity at Nantucket has rebounded since 2010, however they have not returned to the levels experienced in DRAFT FOR INTERNAL REVIEW- 4-34
41 Whither Fractional Ownership? The State of the Industry By David Esler Like all segments of business aviation, fractional ownership took a heavy hit during the Great Recession of With the economy in the cellar, travel needs diminished and aircraft values plummeting, cash-hungry shareholders lined up in droves to sell their fractions back to the providers since those were among the few sure instruments of liquidity. To survive the downturn, some fractional companies reinvented themselves, while at least one major player absorbed its losses by drastically reducing its fleet and falling back on the resources of its wealthy parent. Today, it is clear that the original fractional business model conceived by Richard Santulli a quarter century ago, pioneered by his creation NetJets, and copied by competitors large and small has evolved to include an expanded range of services. Furthermore, fleets are smaller, their composition characterized by fewer aircraft types better suited for airline-style utilization in other words, airplanes with which the providers can make money. Fractional ownership is a leaner and meaner industry, but is it still a viable option for the business aviation user? Most industry experts we talked with believe it is but note that, in most cases, it isn t the industry that existed prior to the recession. Mike Riegel believes fractional remains a viable aircraft ownership option but points out that there have been structural problems with the business model that were apparent as early as the last decade. A former executive with Bombardier and Flexjet, and now proprietor of the Aviation IQ consultancy, which publishes the Factional Insider newsletter, Riegel went on to say, If you look at the rate at which shares are sold the core owners that business has been in decline for five years. Same for net share sales and number purchased: The business has been at a break-even point since 2007, Riegel claims. I ve been saying in my commentaries since 2003 that the business model has worked beautifully for the consumer but not for the provider. We re dealing with an industry that has done what the airlines did, expanding at any price, refusing to partner with the manufacturers, and not putting into service aircraft that were designed to make money in the fractional business model. Joe Moeggenberg, president of Aviation Research Group/US, which tracks fractional ownership performance (as well as that of other business aviation segments), maintains that the industry is stagnant. Where we stand right now, comparing January to September 2010 to the same year-on-year period in 2011, is that the total number of fractional flights is fairly flat: 300,564 for 2011 and 291,830 for 2010, he said. -DRAFT FOR INTERNAL REVIEW- 4-35
42 Month over month, August to September, all the major providers were down: NetJets, -7.3%; Flight Options, -7.6%; Executive Air Shares, -6.4%; CitationAir, -2.4%, Flexjet, -8.9%; and AvantAir, -10.5%. While total flights (all providers) were up 2.9%, statistically, that s flat, Moeggenberg said. There were two good months, June and July 2011, during which NetJets jumped 5% and Flight Options 10.2%. In terms of aircraft class, turboprops, month on month, were down 12.69%; light jets, -3.7%, midsize jets, -7.9%; and large-cabin jets -5.1%. Too Large Can Work Against You During good times when the market was strong, the sale of shares made the industry look very attractive, Riegel pointed out, because you could make a margin by buying a share and later selling it. The problem is that over time, the fleet we see out there has been growing little by little so that today the industry has 800 aircraft in service. The problem in economically bad times, though, is that each time you put a new aircraft into service, when it is not making money, the fleet now becomes your worst enemy, as the amount you will lose operating the airplane will get bigger as the fleet gets bigger. This has been especially troublesome for industry giant NetJets, Riegel claimed, which rose to 700 aircraft, but because they were not operating profitable types, as the sale of shares dried up in 2008, they found themselves with huge losses because the operating contracts were losing so much money for them. The cash from shares dried up, but the aircraft had to continue to fly, so the losses continued to mount, he said. So at NetJets, they wound up with a huge fleet, big losses and shares being sold back by customers, Riegel continued, and the losses being accumulated became a significant problem for [NetJets owner] Berkshire Hathaway. Finally, they had to admit they had a problem, got rid of Santulli and parachuted in [David] Sokol. Within a year Sokol was celebrating, claiming he had turned NetJets around in less than 12 months, but here s the catch: You ve got 705 aircraft in service with five- to 10-year contracts.... How do you do that [achieve profitability] in 12 months? It s an impossibility. Riegel claimed his clients who owned shares in NetJets aircraft were approaching him to take a look at their share valuations, and we could see that NetJets was taking the Bluebook numbers and discounting beyond them. Further, he was seeing this across the board with many of the fractional ownership companies. To describe the trend, Riegel coined the phrase provider-induced loss, defining it as where the providers are, in addition to the market loss, laying on discounts over and above. Take a Cessna Excel, a share for which has gone down 35-40%, and in addition to that, the provider is applying a discount. Riegel said he had a lot of very angry people on his hands claiming losses of up to 40%, and I couldn t find justification for those levels of loss. So they were asking What is wrong with this picture? and many of them were ready to bail and look at other options. The things that built the business had gone away. -DRAFT FOR INTERNAL REVIEW- 4-36
43 Meanwhile, the providers were issuing us lovely white papers that claimed that market value loss was responsible for the share devaluations that it was all the market s fault. Like the subprime mortgage debacle and the banks that bundled them, they were saying it was not their fault. Looking under the hood I could see what the providers were doing to the shareholders, and sources told me that the companies were doing this for their own survival, would continue to do it, and it would become a policy... that the discounts were here to stay. I heard this from several sources within the industry. They were losing so much money in the operation of the airplanes that, as their only survival tactic, they had to recover it from their primary source, the share owners. According to a former executive at a fractional provider, the wakeup call from a business perspective for the industry was that its business model was designed so that shareholders had the option of selling their shares back on fairly short notice, and the companies were required to repurchase them. That s where the business model departs from whole aircraft ownership. So clearly that was a shock to the fractional companies which found a surprising number of shares coming back to them, and it was also a rude awakening to customers who felt the same pain that whole aircraft owners did in terms of residual value degradation. What had to be pointed out to them, the executive said, was that they were still experiencing only a fraction of the pain that whole owners were experiencing. These customers chose fractional ownership to begin with because their business travel was limited and they desired a fully managed solution. In the 2008 meltdown, he said, the impact was similar to that in the whole aircraft market you saw a significant number of companies and customers engaged in both whole and fractional ownership exit the field because they couldn t justify it or afford it or their business had changed so it didn t make sense any longer. So the impact wasn t unique from a customer perspective. Rightsizing the Fleets Bill Quinn, chairman and founder of Aviation Management Systems, has advised clients and represented them to fractional ownership providers since the industry was in its infancy. The traditional fractional programs that we were introduced to by NetJets aren t going to go where we thought they would go, he told BCA. They will continue to exist and be a valuable economic generator for our industry but won t be as popular as we once thought, where we would have 10,000 owners and over 1,000 aircraft. Everybody is going through rightsizing. On the other hand, Bill Olsen has worked inside the business, first as a line captain for NetJets, then as president of the NetJets pilots union and finally for the provider s executive management team. In the last capacity, he served as an executive advisor to chairman Santulli. When Santulli resigned and was replaced by Sokol, Olsen was named NetJets president in 2009, a position he held for less than a year. Olsen claims that when Sokol s true intentions to dramatically alter Santulli s safety/service standards and company culture were revealed, he had no choice but to resign the presidency in March He departed the company for good in January 2011 because of Sokol s failure to understand the fractional business model. Today, Olsen works independently as a consultant. -DRAFT FOR INTERNAL REVIEW- 4-37
44 Olsen maintains that a larger fractional fleet with multiple types shouldn t necessarily be seen as a burden or impediment to profitability. At NetJets, the scale or size of the fleet drove efficiency, which reduced deadhead time, he claimed. Now it seems that Berkshire Hathaway is shying away from that scale, demanding that 600 airplanes for maximum efficiency may no longer be as desirable as 200 airplanes offering superiority and service. Under Santulli and [NetJets cofounder] Jim Jacob s leadership, NetJets was set up to offer a 600-aircraft fleet with all its efficiency and superiority and service. But post-sokol and under Sokol s management team, that appears to be history. (Sokol resigned from NetJets and Berkshire Hathaway in March 2011 for alleged insider trading. His management team, however, remains in place at NetJets.) A provider the size of NetJets must shoulder considerable financial and operational liability and risk. But Olsen believes fleet size doesn t define risk as much as overall financial exposure. In fractional ownership, 50 Gulfstreams have a much greater level of financial risk than 50 [Embraer] Phenoms, so I think that going forward the goal will be finding the appropriate level of risk where the operation can still be successful and viable. During his tenure at NetJets, Santulli was often criticized for cutting deep-discount deals with OEMs for huge purchases that brought a plethora of aircraft types into the NetJets stable, leading to high maintenance costs and less business efficiency. Olsen, however, claimed there is another way to look at this policy: customer brand loyalty. So as NetJets is likely to reduce its fleet types, he said, it s also likely to reduce the options available to customers, who will seek solutions elsewhere. A consumer who is loyal to a Gulfstream 450 or [Cessna] Citation X/Ten is most likely going to [continue to] remain loyal to these aircraft. The larger the aircraft type, the more apparent the OEM brand loyalty. While consumers may be more impartial to a CJ3 versus a Phenom 300, they are more partial to Gulfstream versus [Bombardier] Global or even Citation X/Ten versus Challenger 300. Olsen maintains that one of the reasons why Santulli brought so many types into the NetJets fleet was to serve a broader customer base while presenting a larger barrier of entry for new operators. I would expect more competition in the fractional and branded charter marketplace while providers offer fewer brands or aircraft types in their fleet. Fractional companies have made a lot of adjustments since late 2008, Olsen said, resulting in a wider array of product and service offerings. For some, shares in aircraft ownership represent only one option of many, others including charter card memberships, aircraft management and interchange agreements, and share leasing. Flexjet and CitationAir are offering portfolios of options while strategically aligned with OEMs, respectively, Bombardier and Cessna, Olsen pointed out. They are maintaining younger fleets by selling the older aircraft and introducing new ones. -DRAFT FOR INTERNAL REVIEW- 4-38
45 Yet, Olsen claimed, NetJets hasn t introduced one new aircraft into the fleet since Sokol arrived, but they have disposed of a lot of airplanes of varying ages. Sokol announced a purchase of Phenoms more than a year ago and Bombardier Globals early this year, but indeed, NetJets has yet to accept any of these aircraft. In 2008, NetJets U.S. operated over 500 airplanes, and by the end of 2011 they will probably operate fewer than 400, Olsen said. Then there is NetJets Europe with approximately 150 aircraft in the midst of the European financial crisis. Public records clearly reflect both NetJets U.S. and NetJets Europe continue to operate far more aircraft than they have customers for. Meanwhile, used high-time, high-cycle aircraft market pricing continues to decline, and NetJets can t get the prices they are asking for their aircraft. Public data show NetJets encumbered shares represent approximately 325 airplanes, and so NetJets has far more aircraft than they need to meet demand, with the exception of peak periods when they have to use third-party charter to meet their guaranteed availability obligation. Reinventing Yourself as a Survival Tactic Meanwhile, Quinn believes that every program with the exception of NetJets has continuously reinvented itself. CitationAir and Flexjet are examples they have migrated into whole aircraft management and have broken out their card programs to a point where they are easier and less expensive capital-wise. But the big thing is that whole aircraft management will give them something they didn t have before. CitationAir has a jet management program where you can purchase a whole airplane and have them manage it, Quinn continued, and to the extent they give it to charter, it can offset fixed cost. But the unique part of the CitationAir whole aircraft program is that it also allows owners to interchange into the fractional fleet. So if you have a Sovereign, for example, Quinn hypothesized, and need a smaller airplane for a flight, you can tell them to send a Citation CJ3, and you ll be treated just like a fractional owner. You re interchanging, but you re paying them back by giving them time on the Sovereign. Bombardier s Flexjet fractional program pioneered this concept with its Flexjet One program. If you had a Challenger 300, wholly managed, and wanted to use a smaller aircraft like the Learjet 40 for a short trip, then you would pay 0.7 or 0.8 hr. of the Challenger 300 to cover the Lear, Quinn said, and they d get to use your airplane at no cost to them. So you are using your airplane asset for greater flexibility, to interchange into the Flexjet fleet. They refer to it as the virtual flight department. Cessna Aircraft, reeling from the recession and struggling for recovery, has recognized the value of its fractional program as part of a larger survival strategy. CitationAir was originally standalone [a ownership arrangement with TAG], but they have pulled it back in-house, Quinn said. I believe candidly that they are the most progressive program out there today. They now have 77 aircraft total in their stable, of which 25 or 26 are wholly owned. I d put Bombardier s Flexjet side by side with them as an innovator. They wanted to be a boutique player in fractional ownership, focusing on clients who would value the level of attention a fractional customer gets, and -DRAFT FOR INTERNAL REVIEW- 4-39
46 they currently have 81 airplanes in their program. They wanted to focus on the quality of customer rather than just on fleet size or market share. [Fleet statistics are as of late October.] Quinn still sees NetJets as a viable option backed with plenty of Berkshire Hathaway cash, but no one seems to know their direction. We placed some clients with EJM [Executive Jet Management, NetJet s wholly owned charter/management company] for whole-aircraft management, and I ve wondered why they never have put that together with the fractional program, but for some reason they aren t interested. I don t think they get it; they ve lost too much talent. They don t put information out for people like us to know what they re doing. They will continue to provide the service and are apparently rightsizing their fleet but in the process have managed to upset many of the OEMs, which may explain their new relationship with Embraer. As a result, Quinn s AMS is advising its clients that we just don t know what they are going to do with their business model. They built the mousetrap, but from the internal side, it doesn t look like they re doing enough to adjust to changing times. They did acquire [jet card program] Marquis, but they haven t changed it. Meanwhile, the other providers are migrating closer to on-demand charter with preloaded card programs in which the customer is not billed for deadheads. They are breaking that down into hours instead of blocks of hours, making it easier for customers to get access to their fleets, Quinn explained. At some point in time, you will be able to pick up the phone and call a CitationAir or Flexjet and be able to charter an aircraft from them. Those programs will have everything from soup to nuts. The charter card really came into its own during the recession as a substitute for the fractional share, the unnamed former fractional executive said. During the course of the recession, fractional customers like all others utilizing business aircraft transportation began to reevaluate their solutions. Consumers never stop searching for an optimal solution or set of solutions. And for shareholders selling out, the fractional charter card now represented a more cost-effective solution for having nearly the same privileges of fractional ownership but without the capital commitment. Similarly, the executive said, they also began to look more closely at the nature of their travel and recognized that certain trips were more cost effectively served through charter. So you saw companies introducing products that enabled a customer to acquire both types of services so they could maximize the value of their transportation dollar. Card programs, of course, effectively dilute shares, in addition to running up hours and cycles on fractional program aircraft, as the standard 25-hr. card is tantamount to a one thirty-second share. An owner can protest but has no recourse, since all fractional aircraft operate as part of a pool. In other words, the aircraft are fungible, and owners may never ride aboard the airplanes in which they actually own shares. And as Olsen notes, For a provider, the smaller the average share size, the more stress placed on the operation and the more difficult it is for the fractional business model to deliver profitability. By way of example, if an operator had an average share size of one-quarter before the downturn, but the trend -DRAFT FOR INTERNAL REVIEW- 4-40
47 now is one-sixteenth and, for cardholders, even as low as one thirty-second, there is far greater stress on the system during high-demand seasons and peak period days. If I m a fractional operator with 100 airplanes, he continued, it is better that I serve only 400 customers with quarter shares, as it s then much easier to deliver quality service. But with 100 airplanes serving 1,200 customers, you have much more stress on the operation and business model. Aging fleets and diluted share size are the biggest challenges facing a fractional operator... but the other side of that is that smaller share sizes benefit the customers, because if I buy a thirty-second share, I m paying less for roughly the same aircraft availability. The recessionary period also witnessed the introduction of fractional share leasing programs allowing customers to have the fractional experience without being subject to the residual market value fluctuations that have devalued aircraft shares. Many of these users are experienced in business aviation, the unnamed executive said, and when they sense that prices are at exceptional lows, what will happen is that most of them will step back into an ownership position. Sophisticated Users and the True Cost of Ownership Even though the fractional ownership industry is 25 years old, it still conveys an impression that fractional customers are unsophisticated neophytes. Not true, one program executive affirmed. The industry still sees new customers coming in who are beyond charter and looking for a fully managed solution. Fractional continues to serve a population of individuals and companies that numbers in the thousands who have figured out that this is an optimal solution for their travel needs. So the model continues to work but is evolving to address the changing expectations of customers over time. Part of those expectations have to do with economics, the executive observed. The customers want to enjoy the same level of service but have to do it at an effectively lower rate. The costs associated with this are inescapable there is nothing that providers can do to materially lower the cost per hour of what this service costs. In the grand scheme of things, the effective occupied hourly rate of a wholly owned midsize aircraft, for example, folding in all fixed and variable costs, plus cost of capital and depreciation on the asset, can range from $8,000 to $12,000 an hour, depending on how much the owner flies. This is how a CFO looks at whole or fractional aircraft ownership or really at any corporate aviation solution, the anonymous executive said. Thus, a blended solution may in fact be the best answer for the company and aviation department managers who think in this strategic fashion and ultimately want to provide the best service to their companies and shareholders. This is because the typical flight department never owns the right number of aircraft for the trips the company is required to take, he elaborated. Forty or 50% of their requested trips can t be satisfied because the airplane is already booked, but the remaining demand is insufficient to justify another or more aircraft. So one of two things happens: Either they travel by airline and sub-optimize their time or the company charters or uses shares or cards to satisfy the overflow demand. For customers flying between 50 and -DRAFT FOR INTERNAL REVIEW- 4-41
48 100 hr. per year, the total effective occupied hourly rate associated with fractional ownership can be lower than that of whole aircraft ownership. That difference is directly associated with the cost of whole aircraft ownership. Has the industry learned its lesson, finally realizing that growth for the sake of growth is of no value unless the providers offer aircraft that are better suited to the fractional environment? This is the question Riegel claims is being asked of all the providers. He cites Bombardier s Challenger 300 as a midsize business jet actually designed with fractional ownership in mind: It s efficient, reliable and profitable in fractional service. So we see the industry getting religion, Riegel quipped. NetJets has bought Phenom 300s from Embraer and Global Expresses from Bombardier to replace the Gulfstream IVs and Vs, and you can bet your bottom dollar they are in deep negotiation with OEMs for a good super-midsize type, the frontrunners likely being the Embraer Legacy 450 and 500 and Bombardier Learjet 85 and Challenger 300. They need to do this quickly, as every month they delay, they are wasting money with their current aircraft. I predict orders for between two and four midsize types. Looking strictly at NetJets, Riegel said, everything I predicted since 2003 has come true: fewer types, more efficient, reliable, profitable aircraft, and that is the only way for the industry to survive. So we will see a new generation of aircraft for fractional ownership come into service. The providers can t go on making a huge pile of money when the economy is strong and then losing it all during a downturn, which is what they ve been doing. We are going through a step change in the fractional industry. The manufacturers, meanwhile, are being pressured to go through their product lines and design new aircraft suitable for fractional ownership. The new mantra for the fractional industry, then, is operational flexibility, because these flexible airplanes like the Challenger 300 or Falcon 7X can perform a variety of work and still do it profitably, Riegel claimed, unlike the older long-range airplanes or converted airliners, which can be profitable on long-range missions, but that s all. Too many OEMs have made product decisions based on their existing lineup of airplanes, looking for gaps in the lineup but not in the market, and the net result has been that many of the aircraft they ve built have been designed to fit into the existing product lines. They can t do that any more. Embraer in the last two years has taken a 42% market share in the light jet category and still hasn t achieved full production capacity, which is pardon the pun phenomenal. According to Riegel, general aviation manufacturing is seeing the emergence of green-field OEMs, e.g., Embraer, not burdened by existing product lines and so not constrained by what they re already building. They are giving fits to the legacy OEMs, he said. The market has to be considered first when developing a product line. You have to evolve. If that weren t true, Embraer would have not been able to break in the way it has. If the existing OEMs don t start to do their research better, they re going to be eaten alive by the emerging players. You have to talk to the market to know what it wants. -DRAFT FOR INTERNAL REVIEW- 4-42
49 Aircraft buyers, whether whole or fractional, are becoming more savvy about what they want and need, Riegel maintained, and the era in which the OEMs would tell them what they wanted or needed is over. The fractional providers have changed, and they re not going back to the old paradigm. I m fearful for the North American business aviation industry, because I don t think the executives there have gotten the message yet that they have to listen to the market and evolve. Overall, we ll see some of the OEMs go under, and if the new business model in fractional ownership isn t adopted across the board, we ll see some fractional providers go under, too. Fractional Must Differentiate Itself What fractional has to do to survive, Olsen believes, is to differentiate itself from other forms of business aviation such as whole aircraft ownership and both jet cards and traditional on-demand charter in order to preserve its overall market share. There are economic cycles in which fractional makes a lot of sense and downturns like now where people will look for other solutions. Charter availability is up, Olsen pointed out, charter costs are down, and used whole aircraft are less expensive. Fractional got off the ground because, among other reasons, it differentiated itself from a safety standpoint, but now ad hoc safety initiatives like IS-BAO, safety management systems (SMSes) and NATA s Air Charter Safety Foundation not to mention better policing by the FAA in the wake of the 2005 Challenger runway excursion at Teterboro Airport are bringing the same levels of safety and best practices to the wider general aviation industry. Thus, the Santulli Standard differentiation today is less because the overall industry safety standards are much better than a decade ago, Olsen said, and in my opinion, Sokol wrongly dismissed Santulli s standards that always sought to raise the bar. Those safety and service standards were the differentiator. Fractional at the present time is probably no less healthy than other segments of the general aviation industry, Quinn observed. It is alive and well but smaller, and the providers are having to be more creative and use their resources as best as they can to expand their business models and anticipate what the market wants. Hopefully, the 800-lb. gorilla with its 400-plus airplanes will wake up and start thinking out of the box in terms of what the market is looking for. We see no significant changes coming out of NetJets, as the company is living with the same business model [Santulli started with a quartercentury ago]. While there are some new aircraft coming into the fleets, Quinn said, the majority of shares being sold today are pre-owned that is, customers have sold them back to the providers, which are then reselling them. All the providers are extending the five-year limits because they don t want the inventory. Looking into the future, Olsen anticipates more competition among fractional providers, more boutique-like solutions and closely aligned OEM/fractional provider partnerships. On the other hand, the unnamed executive thinks the opportunity for growth or at least the kind of growth the industry saw during the 1990s is somewhat limited. -DRAFT FOR INTERNAL REVIEW- 4-43
50 The industry has matured, and I think that growth will come much more slowly going forward, he said. As the industry further segments itself, there are more travel options open to people, so growth within the fractional industry can end up being fairly low. Fractional ownership is certainly correlated to the economy just as whole ownership is they re in lock step. What I do see. he continued, is that fractional companies are beginning the necessary step of modernizing their fleets, a gradual updating, which is important to their customers. People who are entering the market now and buying shares of older aircraft are taking advantage of terrific values. It s a lousy time to sell but a great time to buy. He believes three factors will characterize the new fractional ownership industry: rightsizing in terms of the number of aircraft, i.e., the inventory; rationalization, which is minimizing the number of types but still satisfying the vast majority of missions, thus controlling operating costs better; and a trend toward acquiring aircraft specifically built for high-cycle usage. -DRAFT FOR INTERNAL REVIEW- 4-44
51 APPENDIX J CORPORATE AND AIR TAXI AIRCRAFT ACTIVITY DESTINATIONS FROM NANTUCKET AIRPORT July, 7, 2013 Source: FlightAware -DRAFT FOR INTERNAL REVIEW- 4-45


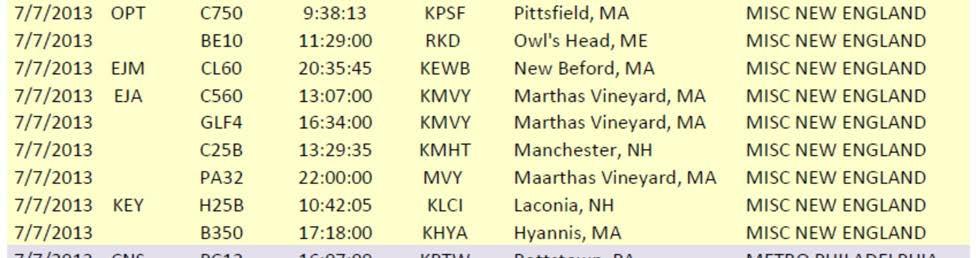

52 -DRAFT FOR INTERNAL REVIEW- 4-46


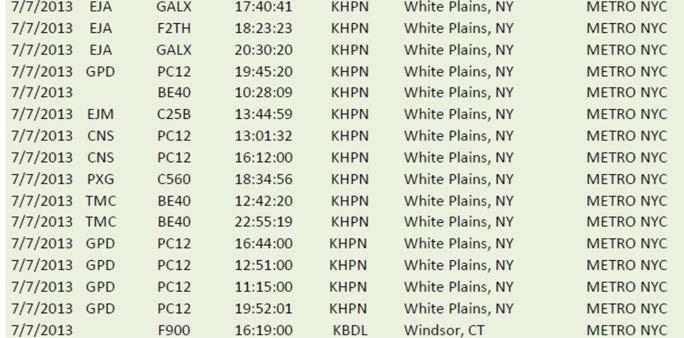
53 -DRAFT FOR INTERNAL REVIEW- 4-47


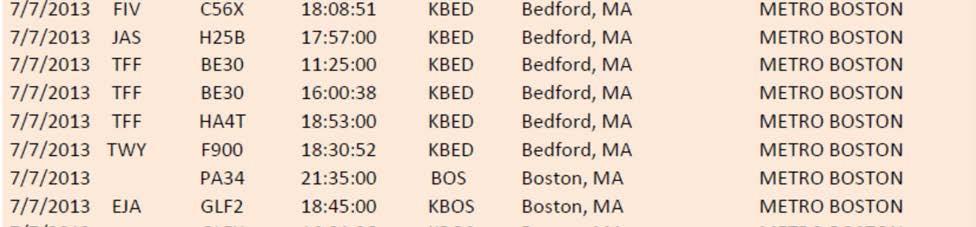
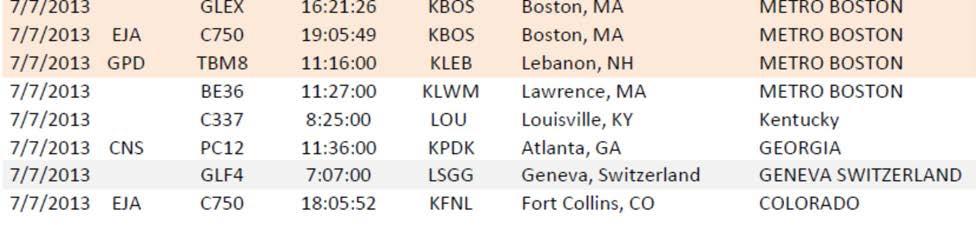
54 -DRAFT FOR INTERNAL REVIEW- 4-48
55 APPENDIX K FEDERAL AVIATION ADMINISTRATION TERMINAL AREA FORECAST (TAF) NANTUCKET AIRPORT Issued January DRAFT FOR INTERNAL REVIEW- 4-49


56 -DRAFT FOR INTERNAL REVIEW- 4-50
57 APPENDIX L FEDERAL AVIATION ADMINISTRATION TEMPORARY FLIGHT RESTRICTION (TFR) NANTUCKET AIRPORT November DRAFT FOR INTERNAL REVIEW- 4-51


58 -DRAFT FOR INTERNAL REVIEW- 4-52
Rutland, Vermont To/From Boston Docket DOT-OST
 Proposal of Hyannis Air Service, Inc. dba Cape Air to provide subsidized Essential Air Service for: Rutland, Vermont To/From Boston Docket DOT-OST-2005-21681 With codeshare of: May 8, 2017 Cape Air is
Non-stop to/from Lambert - St. Louis International Airport 3x Daily
 Proposal of Hyannis Air Service, Inc. dba Cape Air to provide subsidized Essential Air Service for: Kirksville, Missouri Docket DOT-OST-1997-2515 Non-stop to/from Lambert - St. Louis International Airport
Hyannis Air Service, Inc., dba Cape Air Attn: Andrew Bonney, 660 Barnstable Road, Hyannis, MA (508)
") Proposal of Hyannis Air Service, Inc. dba Cape Air to provide subsidized Essential Air Service for: Massena, NY To/From Boston via Albany Docket DOT-OST-2012-0163 Hyannis Air Service, Inc., dba Cape Air
Proposal of Hyannis Air Service, Inc. dba Cape Air to provide subsidized Essential Air Service for: Massena, NY To/From Boston via Albany Docket DOT-OST-2012-0163 Hyannis Air Service, Inc., dba Cape Air
Cape Air Update. Saipan Chamber of Commerce. Andrew Bonney Senior Vice President of Planning
 Cape Air Update Saipan Chamber of Commerce Andrew Bonney Senior Vice President of Planning 0 In 1989 Cape Air began airline service with a single route between Provincetown and Boston Original Cape Air
Ft. Leonard Wood, Missouri
 Proposal of Hyannis Air Service, Inc. dba Cape Air to provide subsidized Essential Air Service for: Ft. Leonard Wood, Missouri DOCKET DOT-OST-1996-1167 Four daily non-stop flights to/from Lambert - St.
ABOUT CAPE AIR. Trish Lorino Vice President of Marketing & PR Cape Air PRESS INQUIRIES:
 ABOUT CAPE AIR Our goal is to get you where you want to be as quickly and easily as possible. Since our first flight between Boston and Provincetown in 1989, has provided year-round service to some of
Augusta/Waterville and Rockland, Maine Docket DOT-OST
 Proposal of Hyannis Air Service, Inc., dba Cape Air to provide subsidized Essential Air Service for: Augusta/Waterville and Rockland, Maine Docket DOT-OST-1997-2784 Each Non-Stop To/From Boston For a two-
OPERATING AND FINANCIAL HIGHLIGHTS SUBSEQUENT EVENTS
 Copa Holdings Reports Net Income of US$6.2 Million and EPS of US$0.14 for the Third Quarter of 2015 Excluding special items, adjusted net income came in at $37.4 million, or EPS of $0.85 per share Panama
Airlines across the world connected a record number of cities this year, with more than 20,000 city pair connections*
 1 Airlines across the world connected a record number of cities this year, with more than 20,000 city pair connections*. This is a 1,351 increase over 2016 and a doubling of service since 1996, when there
Land area 1.73 million km 2 Queensland population (as at 31 December 2017) Brisbane population* (preliminary estimate as at 30 June 2017)
 Brisbane population* (preliminary estimate as at 30 June 2017)") Queensland - 11 Queensland OVERVIEW Queensland is nearly five times the size of Japan, seven times the size of Great Britain, and two and a half times the size of Texas. Queensland is Australia s second
Queensland - 11 Queensland OVERVIEW Queensland is nearly five times the size of Japan, seven times the size of Great Britain, and two and a half times the size of Texas. Queensland is Australia s second
PREMIUM TRAFFIC MONITOR OCTOBER 2015 KEY POINTS
 PREMIUM TRAFFIC MONITOR OCTOBER 2015 KEY POINTS Passenger travel on international markets was up 4.5% in October year-on-year, overall. For economy class travel, passenger numbers were up 4.6% but that
OPERATING AND FINANCIAL HIGHLIGHTS
 Copa Holdings Reports Net Income of US$18.6 Million and EPS of US$0.42 for the Second Quarter of 2010 Excluding special items, adjusted net income came in at $26.3 million, or $0.60 per share Panama City,
OPERATING AND FINANCIAL HIGHLIGHTS SUBSEQUENT EVENTS
 Copa Holdings Reports Financial Results for the Third Quarter of 2016 Excluding special items, adjusted net income came in at $55.3 million, or adjusted EPS of $1.30 per share Panama City, Panama --- November
OPERATING AND FINANCIAL HIGHLIGHTS
 Copa Holdings Reports Net Income of US$32.0 Million and EPS of US$0.72 for the Second Quarter of 2012 Excluding special items, adjusted net income came in at $58.6 million, or EPS of $1.32 per share Panama
Thank you for participating in the financial results for fiscal 2014.
 Thank you for participating in the financial results for fiscal 2014. ANA HOLDINGS strongly believes that safety is the most important principle of our air transportation business. The expansion of slots
OPERATING AND FINANCIAL HIGHLIGHTS. Subsequent Events
 Copa Holdings Reports Net Income of $103.8 million and EPS of $2.45 for the Third Quarter of 2017 Excluding special items, adjusted net income came in at $100.8 million, or EPS of $2.38 per share Panama
3. Aviation Activity Forecasts
 3. Aviation Activity Forecasts This section presents forecasts of aviation activity for the Airport through 2029. Forecasts were developed for enplaned passengers, air carrier and regional/commuter airline
AMERICAN AIRLINES GROUP REPORTS DECEMBER TRAFFIC RESULTS
 Corporate Communications 817-967-1577 mediarelations@aa.com Investor Relations 817-931-3423 investor.relations@aa.com FOR RELEASE: Monday, AMERICAN AIRLINES GROUP REPORTS DECEMBER TRAFFIC RESULTS FORT
Copa Holdings Reports Net Income of $49.9 million and EPS of $1.18 for the Second Quarter of 2018
 Copa Holdings Reports Net Income of $49.9 million and EPS of $1.18 for the Second Quarter of 2018 Panama City, Panama --- Aug 8, 2018. Copa Holdings, S.A. (NYSE: CPA), today announced financial results
IATA ECONOMIC BRIEFING FEBRUARY 2007
 IATA ECONOMIC BRIEFING FEBRUARY 27 NEW AIRCRAFT ORDERS KEY POINTS New aircraft orders remained very high in 26. The total of 1,834 new orders for Boeing and Airbus commercial planes was down slightly from
OPERATING AND FINANCIAL HIGHLIGHTS. Subsequent Events
 Copa Holdings Reports Net Income of US$113.1 Million and EPS of US$2.57 for the First Quarter of 2015 Excluding special items, adjusted net income came in at US$106.0 million, or EPS of US$2.41 per share
AIR TRANSPORT MARKET ANALYSIS JULY 2011
 AIR TRANSPORT MARKET ANALYSIS JULY 2011 KEY POINTS Despite an increasingly gloomy economic outlook, air travel continued to expand at a pace close to trend in July, to a level 5.9% higher than a year earlier.
Copa Holdings Reports Fourth Quarter and Full Year 2007 Results
 Copa Holdings Reports Fourth Quarter and Full Year 2007 Results Panama City, Panama --- February 21, 2008. Copa Holdings, S.A. (NYSE: CPA), parent company of Copa Airlines and Aero Republica, today announced
OPERATING AND FINANCIAL HIGHLIGHTS. Subsequent Events
 Copa Holdings Reports Financial Results for the First Quarter of 2016 Excluding special items, adjusted net income came in at US$69.9 million, or EPS of US$1.66 per share Panama City, Panama --- May 5,
A COMPARISON OF THE MILWAUKEE METROPOLITAN AREA TO ITS PEERS
 KRY/WJS/EDL #222377 (PDF: #223479) 1/30/15 PRELIMINARY DRAFT Memorandum Report A COMPARISON OF THE MILWAUKEE METROPOLITAN AREA TO ITS PEERS EXECUTIVE SUMMARY This memorandum report provides a statistical
Copa Holdings Reports Record Earnings of US$41.8 Million for 4Q06 and US$134.2 Million for Full Year 2006
 Copa Holdings Reports Record Earnings of US$41.8 Million for 4Q06 and US$134.2 Million for Full Year 2006 Panama City, Panama --- March 7, 2007. Copa Holdings, S.A. (NYSE: CPA), parent company of Copa
Aviation Insights No. 8
 Aviation Insights Explaining the modern airline industry from an independent, objective perspective No. 8 January 17, 2018 Question: How do taxes and fees change if air traffic control is privatized? Congress
OPERATING AND FINANCIAL HIGHLIGHTS
 Copa Holdings Reports Financial Results for the Fourth Quarter of 2015 Excluding special items, adjusted net income came in at $31.7 million, or EPS of $0.73 per share Panama City, Panama --- February
AUGUST 2018 MONTHLY STATISTICAL REPORT
 AUGUST 2018 MONTHLY STATISTICAL REPORT Monthly Statistical Report To: Russell J. Handy, Aviation Director From: Brian Pratte, Air Service Administrator Copies: San Antonio Regional Stakeholders Subject:
The Economic Impact of Emirates in the United States. Prepared by:
 Prepared by: www.av-econ.com Alexandria, Virginia July 2017 EXECUTIVE SUMMARY About Emirates Emirates Airline (Emirates), based in Dubai, United Arab Emirates (U.A.E.), was established in 1985 and since
3 Aviation Demand Forecast
 3 Aviation Demand 17 s of aviation demand were prepared in support of the Master Plan for Harrisburg International Airport (the Airport or HIA), including forecasts of enplaned passengers, air cargo, based
Southwest Airlines (LUV) Analyst: Rebekah Zsiga Fall Recommendation: BUY Target Price until (12/31/2016): $62
 Analyst: Rebekah Zsiga Fall Recommendation: BUY Target Price until (12/31/2016): $62") Recommendation: BUY Target Price until (12/31/2016): $62 1. Reasons for the Recommendation After detailed analysis of Southwest Airlines Company I recommend that we move to buy further shares of stock
Recommendation: BUY Target Price until (12/31/2016): $62 1. Reasons for the Recommendation After detailed analysis of Southwest Airlines Company I recommend that we move to buy further shares of stock
IATA ECONOMIC BRIEFING DECEMBER 2008
 ECONOMIC BRIEFING DECEMBER 28 THE IMPACT OF RECESSION ON AIR TRAFFIC VOLUMES Recession is now forecast for North America, Europe and Japan late this year and into 29. The last major downturn in air traffic,
Yakima Air Terminal McAllister Field. Aviation Demand Forecast Workshop October 13, 2011
 Yakima Air Terminal McAllister Field Aviation Demand Forecast Workshop October 13, 2011 Today s Agenda What is happening at YKM that is different from FAA s assumptions? What are the national trends for
20-Year Forecast: Strong Long-Term Growth
 20-Year Forecast: Strong Long-Term Growth 10 RPKs (trillions) 8 Historical Future 6 4 2 Forecast growth annual rate 4.8% (2005-2024) Long-Term Growth 2005-2024 GDP = 2.9% Passenger = 4.8% Cargo = 6.2%
IATA ECONOMICS BRIEFING
 IATA ECONOMICS BRIEFING NEW AIRCRAFT ORDERS A POSITIVE SIGN BUT WITH SOME RISKS FEBRUARY 26 KEY POINTS 25 saw a record number of new aircraft orders over 2, for Boeing and Airbus together even though the
OPERATING AND FINANCIAL HIGHLIGHTS
 Copa Holdings Reports Financial Results for the Fourth Quarter of 2018 Excluding special items, adjusted net profit came in at $44.0 million, or Adjusted EPS of $1.04 Panama City, Panama --- February 13,
AMERICAN AIRLINES GROUP REPORTS RECORD FEBRUARY TRAFFIC AND CAPACITY
 Corporate Communications 817-967-1577 mediarelations@aa.com Investor Relations 817-931-3423 investor.relations@aa.com FOR RELEASE: Tuesday, AMERICAN AIRLINES GROUP REPORTS RECORD FEBRUARY TRAFFIC AND CAPACITY
Good afternoon Chairman Cantwell, Ranking Member Ayotte, and members of the
 Testimony of Doug Parker, CEO of US Airways Senate Committee on Commerce, Science and Transportation Subcommittee on Aviation Operations, Safety and Security Hearing on Airline Industry Consolidation June
AMERICAN AIRLINES GROUP REPORTS RECORD DECEMBER TRAFFIC RESULTS
 Corporate Communications 817-967-1577 mediarelations@aa.com Investor Relations 817-931-3423 investor.relations@aa.com FOR RELEASE: Tuesday, AMERICAN AIRLINES GROUP REPORTS RECORD DECEMBER TRAFFIC RESULTS
Cleveland Hopkins International Airport Preliminary Merger Analysis
 City of Cleveland Frank G. Jackson, Mayor Operational Issues Cleveland Hopkins International Airport Preliminary Merger Analysis As of today, Continental and United have not even admitted that they are
PREMIUM TRAFFIC MONITOR JULY 2014 KEY POINTS
 PREMIUM TRAFFIC MONITOR JULY 2014 KEY POINTS Growth in international air passengers was weak for a second consecutive month with a 2.6% increase in July compared to a year ago premium seat numbers rose
Airline Industry Overview For the Regional Airline Association. December 8, 2010
 Airline Industry Overview For the Regional Airline Association December 8, 2010 Agenda The Airline Industry at Yearend 2010 Financial Recovery Return to Growth Consolidation Alliances Regional Service
INVESTOR PRESENTATION. May 2015
 INVESTOR PRESENTATION May 2015 Forward-looking Statements This presentation contains forward-looking statements within the meaning of the Private Securities Litigation Reform Act of 1995 that reflect the
1Q 2017 Earnings Call. April 18, 2017
 1Q 2017 Earnings Call April 18, 2017 Safe Harbor Statement Certain statements included in this presentation are forward-looking and thus reflect our current expectations and beliefs with respect to certain
PREMIUM TRAFFIC MONITOR AUGUST 2015 KEY POINTS
 PREMIUM TRAFFIC MONITOR AUGUST 2015 KEY POINTS Passenger travel on international markets was up 5.4% in August year-on-year, reflecting strong growth on the Within Europe travel market. Both travel classes
AMR CORPORATION REPORTS THIRD QUARTER 2011 RESULTS. Net Loss of $162 Million; Operating Earnings of $39 Million
 CONTACT: Sean Collins Corporate Communications Fort Worth, Texas 817-967-1577 mediarelations@aa.com FOR RELEASE: Wednesday, REPORTS THIRD QUARTER 2011 RESULTS Net Loss of $162 Million; Operating Earnings
SHORT BUY. Price:$6.04 Target: $4.20. Price: $5.68 Target: $8.00.
 BUY SHORT Price: $5.68 Target: $8.00 Price:$6.04 Target: $4.20 valuehuntr@gmail.com Overview Highest ranked carrier in performance and quality Best safety record (never had a fatal accident in 80 years
American Airlines Group Reports December Traffic
 NEWS RELEASE American Airlines Group Reports December Traffic 1/11/2017 FORT WORTH, Texas, Jan. 11, 2017 American Airlines Group (NASDAQ:AAL) today reported December and full year 2016 traffic results.
Quarterly Aviation Industry Performance
 Quarterly Aviation Industry Performance ALAFCO Aviation Lease and Finance Company K.S.C.P. Quarterly Aviation Industry Performance (March - June 17) Prepared by: Strategic Planning department 1 Quarterly
Financial and Economic Indicators for the Air Transport Industry. NASAO Legislative Conference Washington DC February 2016
 Financial and Economic Indicators for the Air Transport Industry NASAO Legislative Conference Washington DC February 2016 General Aviation Metrics Number of Active General Aviation Aircraft and On-Demand
United States General Accounting Office
 GAO United States General Accounting Office Testimony Before the Subcommittee on Aviation, Committee on Transportation and Infrastructure, House of Representatives For Release on Delivery Expected at 10:00
INVESTOR PRESENTATION. Imperial Capital Global Opportunities Conference September 2015
 INVESTOR PRESENTATION Imperial Capital Global Opportunities Conference September 2015 Forward-looking Statements This presentation contains forward-looking statements within the meaning of the Private
J.P. Morgan Aviation, Transportation and Industrials Conference
 J.P. Morgan Aviation, Transportation and Industrials Conference March 3, 08 Scott Kirby President Safe Harbor Statement Certain statements included in this presentation are forward-looking and thus reflect
US $ 1,800 1,600 1,400 1,200 1,000
 IATA ECONOMIC BRIEFING JULY 9 INFRASTRUCTURE COSTS SUMMARY Historical data indicates that during recession periods infrastructure providers usually increase their prices while other prices are falling
AIR TRANSPORT MARKET ANALYSIS MAY 2011
 AIR TRANSPORT MARKET ANALYSIS MAY 2011 KEY POINTS May saw a renewed expansion in both air travel and freight, after a soft patch during the previous three months. Air travel volumes were 6.8% higher than
Industry Update. ACI-NA Winter Board of Directors Meeting February 3, 2016 Orlando, FL
 Industry Update ACI-NA Winter Board of Directors Meeting February 3, 2016 Orlando, FL U.S. & Canadian GDP 8% 6% 4% U.S.* Canada** Estimate by BEA as of 02/11/16 2% 0% -2% -4% -6% -8% -10% The U.S. economy
DOWNTOWN, CHARLOTTE AMALIE
 TOTAL VISITOR ARRIVALS TO THE USVI : DECEMBER YEAR TO DATE DECEMBER TOTAL VISITOR ARRIVALS 2,85, 2,8, 2,814,257 2,75, 2,7, 2,65, 2,6, 2,642,118 2,71,542 2,648,5 2,55, 212 213 214 215 Visitor arrivals ended
Spirit Airlines Reports First Quarter 2017 Results
 Spirit Airlines Reports First Quarter 2017 Results MIRAMAR, Fla., April 28, 2017 - Spirit Airlines, Inc. (NASDAQ: SAVE) today reported first quarter 2017 financial results. GAAP net income for the first
Copa Holdings Reports Net Income of US$113.9 Million for the Fourth Quarter of 2013
 Copa Holdings Reports Net Income of US$113.9 Million for the Fourth Quarter of 2013 Panama City, Panama --- February 12, 2014. Copa Holdings, S.A. (NYSE: CPA), today announced financial results for the
The Economic Impact of Tourism in Hillsborough County, June 2018
 The Economic Impact of Tourism in Hillsborough County, 2017 June 2018 Table of contents 1) Key Findings for 2017 3 2) Local Tourism Trends 7 3) Trends in Visits and Spending 12 4) The Domestic Market 19
US Airways Group, Inc.
 US Airways Group, Inc. Proposed US Airways/Delta Merger Will Not Reduce Competition November 17, 2006 0 1 Forward-Looking Statements Certain of the statements contained herein should be considered forward-looking
Airline financial performance and longterm developments in air travel markets
 Airline financial performance and longterm developments in air travel markets March 2018 Brian Pearce, Chief Economist, IATA www.iata.org/economics % of invested capital Investor returns falling but above
Investor Update Issue Date: April 9, 2018
 Investor Update Issue Date: April 9, 2018 This investor update provides guidance and certain forward-looking statements about United Continental Holdings, Inc. (the Company or UAL ). The information in
CONTACT: Investor Relations Corporate Communications
 NEWS RELEASE CONTACT: Investor Relations Corporate Communications 435.634.3200 435.634.3553 Investor.relations@skywest.com corporate.communications@skywest.com SkyWest, Inc. Announces Second Quarter 2016
New Market Structure Realities
 New Market Structure Realities July 2003 Prepared by: Jon F. Ash, Managing Director 1800 K Street, NW Suite 1104 Washington, DC, 20006 www.ga2online.com The airline industry during the past two years has
CONTACT: Investor Relations Corporate Communications
 NEWS RELEASE CONTACT: Investor Relations Corporate Communications 435.634.3200 435.634.3553 Investor.relations@skywest.com corporate.communications@skywest.com SkyWest, Inc. Announces Fourth Quarter 2017
AIR CANADA REPORTS FIRST QUARTER RESULTS
 AIR CANADA REPORTS FIRST QUARTER RESULTS As a result of the deconsolidation of Jazz effective May 24, 2007, Air Canada s consolidated results for the first quarter of 2008 are not directly comparable to
AIR TRANSPORT MARKET ANALYSIS APRIL 2011
 AIR TRANSPORT MARKET ANALYSIS APRIL 2011 KEY POINTS From this month we provide an assessment of global scheduled air transport markets, adding domestic to international, and including both IATA and non-iata
Essential Air Service Proposal. Massena, NY DOT-OST
 Essential Air Service Proposal Massena, NY DOT-OST-2012-0163 November 9th, 2016 About Boutique Air Our Story Headquartered in San Francisco, California, Boutique Air has been in operation since 2007. We
Hyannis Air Service, Inc., dba Cape Air Attn: Andrew Bonney, 660 Barnstable Road, Hyannis, MA (508)
") Proposal of Hyannis Air Service, Inc. dba Cape Air to provide subsidized Essential Air Service for: Massena, NY To/From Boston via Albany Docket DOT-OST-2012-0163 Hyannis Air Service, Inc., dba Cape Air
Proposal of Hyannis Air Service, Inc. dba Cape Air to provide subsidized Essential Air Service for: Massena, NY To/From Boston via Albany Docket DOT-OST-2012-0163 Hyannis Air Service, Inc., dba Cape Air
Quarterly Aviation Industry Performance
 Quarterly Aviation Industry Performance ALAFCO Aviation Lease and Finance Company K.S.C.P. Quarterly Aviation Industry Performance 3Q17 (Updated November 17) Prepared by: Strategic Planning department
The Economic Impact of Tourism in Hillsborough County. July 2017
 The Economic Impact of Tourism in Hillsborough County July 2017 Table of contents 1) Key Findings for 2016 3 2) Local Tourism Trends 7 3) Trends in Visits and Spending 12 4) The Domestic Market 19 5) The
Crisis and Strategic Alliance in Aviation Industry. A case study of Singapore Airlines and Air India. Peter Khanh An Le
 Crisis and Strategic Alliance in Aviation Industry A case study of Singapore Airlines and Air India National University of Singapore 37 Abstract Early sights of recovery from the US cultivate hope for
Land area 1.73 million km 2 Queensland population (as at December 2016) Brisbane population* (preliminary estimate as at 30 June 2016)
 Brisbane population* (preliminary estimate as at 30 June 2016)") Queensland - 11 Queensland OVERVIEW Queensland is nearly five times the size of Japan, seven times the size of Great Britain, and two and a half times the size of Texas. Queensland is Australia s second
Queensland - 11 Queensland OVERVIEW Queensland is nearly five times the size of Japan, seven times the size of Great Britain, and two and a half times the size of Texas. Queensland is Australia s second
IATA ECONOMICS BRIEFING AIRLINE BUSINESS CONFIDENCE INDEX OCTOBER 2010 SURVEY
 IATA ECONOMICS BRIEFING AIRLINE BUSINESS CONFIDENCE INDEX OCTOBER SURVEY KEY POINTS Results from IATA s quarterly survey conducted in October show business conditions continued to improve during the third
MIRAMAR, Fla., April 29, 2015 (GLOBE NEWSWIRE) -- Spirit Airlines, Inc. (Nasdaq:SAVE) today reported first quarter 2015 financial results.
 -- Spirit Airlines, Inc. (Nasdaq:SAVE) today reported first quarter 2015 financial results.") April 29, 2015 Spirit Airlines Announces First Quarter 2015 Results; Adjusted Net Income Increases 87.1 Percent to $70.7 Million and Pre-Tax Margin Increases 900 Basis Points to 22.7 Percent MIRAMAR, Fla.,
April 29, 2015 Spirit Airlines Announces First Quarter 2015 Results; Adjusted Net Income Increases 87.1 Percent to $70.7 Million and Pre-Tax Margin Increases 900 Basis Points to 22.7 Percent MIRAMAR, Fla.,
JP Morgan Aviation, Transportation and Industrials Conference MARCH 15, 2017
 JP Morgan Aviation, Transportation and Industrials Conference MARCH 15, 2017 1 1 SAFE HARBOR This presentation contains forward-looking statements within the meaning of the Private Securities Litigation
AIR CANADA REPORTS THIRD QUARTER RESULTS
 AIR CANADA REPORTS THIRD QUARTER RESULTS THIRD QUARTER OVERVIEW Operating income of $112 million compared to operating income of $351 million in the third quarter of 2007. Fuel expense increased 49 per
Investor Relations Update January 25, 2018
 General Overview Investor Relations Update Accounting Changes On January 1, 2018, the company adopted two new Accounting Standard Updates: (ASUs): ASU 2014-9: Revenue from Contracts with Customers (the
Economic Impact of Tourism in Hillsborough County September 2016
 Economic Impact of Tourism in Hillsborough County - 2015 September 2016 Key findings for 2015 Almost 22 million people visited Hillsborough County in 2015. Visits to Hillsborough County increased 4.5%
Economic Impact of Kalamazoo-Battle Creek International Airport
 Reports Upjohn Research home page 2008 Economic Impact of Kalamazoo-Battle Creek International Airport George A. Erickcek W.E. Upjohn Institute, erickcek@upjohn.org Brad R. Watts W.E. Upjohn Institute
Global Airline Trends and Impacts International Aviation Issues Seminar
 Global Airline Trends and Impacts International Aviation Issues Seminar December 2017, Washington D.C. Oliver Lamb Managing Director 1 Around the world in 45 minutes Financial Performance Canada Mexico
CONTACT: Investor Relations Corporate Communications
 NEWS RELEASE CONTACT: Investor Relations Corporate Communications 435.634.3200 435.634.3553 Investor.relations@skywest.com corporate.communications@skywest.com SkyWest, Inc. Announces Second Quarter 2017
Hello everyone, I am Shinichiro Ito, President and CEO of All Nippon Airways.
 ANA2011 1 Hello everyone, I am Shinichiro Ito, President and CEO of All Nippon Airways. Thank you for taking the time to join us today for our two-year corporate plan briefing for fiscal 2011 and 2012.
Westover Metropolitan Airport Master Plan Update
 Westover Metropolitan Airport Master Plan Update June 2008 INTRODUCTION Westover Metropolitan Airport (CEF) comprises the civilian portion of a joint-use facility located in Chicopee, Massachusetts. The
AIR CARGO RECOVERY DRIVERS AND ROADBLOCKS Airports Council International North America Calgary
 AIR CARGO RECOVERY DRIVERS AND ROADBLOCKS Airports Council International North America Calgary DAN MUSCATELLO Landrum & Brown September 9, 0 Metric Tons (in millions) GLOBAL AIR CARGO VOLUMES Global air
Copa Holdings Reports Earnings of US$30.3 Million and EPS of US$0.70 for 3Q08
 Copa Holdings Reports Earnings of US$30.3 Million and EPS of US$0.70 for 3Q08 Panama City, Panama --- November 13, 2008. Copa Holdings, S.A. (NYSE: CPA), parent company of Copa Airlines and Aero Republica,
United Continental Holdings, Inc (NYSE: UAL) ONE YEAR PRICE RANGE : $ LAST PRICE: $ ANALYST RATING: Sell
 ONE YEAR PRICE RANGE : $ LAST PRICE: $ ANALYST RATING: Sell") United Continental Holdings, Inc (NYSE: UAL) ONE YEAR PRICE RANGE : $61.91 68.76 LAST PRICE: $68.39 ANALYST RATING: Sell VALUATION DATE: August 3, 2017 NEXT EARNINGS DATE: October 17, 2017 Investment Thesis:
United Continental Holdings, Inc (NYSE: UAL) ONE YEAR PRICE RANGE : $61.91 68.76 LAST PRICE: $68.39 ANALYST RATING: Sell VALUATION DATE: August 3, 2017 NEXT EARNINGS DATE: October 17, 2017 Investment Thesis:
Copa Holdings Reports Net Income of US$51.9 Million for the Fourth Quarter of 2008 and US$152.2 Million for Full Year 2008
 Copa Holdings Reports Net Income of US$51.9 Million for the Fourth Quarter of 2008 and US$152.2 Million for Full Year 2008 Panama City, Panama --- February 19, 2009. Copa Holdings, S.A. (NYSE: CPA), parent
ANA Reports Record Profits for FY2012
 ANA HOLDINGS NEWS ANA Reports Record Profits for FY2012 TOKYO April 30, 2013 - ANA Holdings today reports consolidated financial for the fiscal year ended March, 2013. Financial and Operational Highlights
Antitrust Law and Airline Mergers and Acquisitions
 Antitrust Law and Airline Mergers and Acquisitions Module 22 Istanbul Technical University Air Transportation Management, M.Sc. Program Air Law, Regulation and Compliance Management 12 February 2015 Kate
FULL YEAR OPERATING PROFIT RISES TO $259 MILLION 25 CENTS SPECIAL DIVIDEND PROPOSED OUTLOOK REMAINS CHALLENGING
 8 May 2014 Page 1 of 5 No. 02/14 8 May 2014 FULL YEAR OPERATING PROFIT RISES TO $259 MILLION 25 CENTS SPECIAL DIVIDEND PROPOSED OUTLOOK REMAINS CHALLENGING GROUP FINANCIAL PERFORMANCE Financial Year 2013-14
2010 ANNUAL GENERAL MEETING. May 4, 2010
 2010 ANNUAL GENERAL MEETING May 4, 2010 FORWARD-LOOKING STATEMENT Certain information in this presentation and statements made during this presentation, including any question and answer session, may contain
TOURISM AS AN ECONOMIC ENGINE FOR GREATER PHILADELPHIA
 TOURISM AS AN ECONOMIC ENGINE FOR GREATER PHILADELPHIA 2015 Visitation and Economic Impact Report FINAL REPORT SUBMITTED TO: VISIT PHILADELPHIA 30 S. 17 th St, Suite 2010 Philadelphia, PA 19103 FINAL REPORT
QANTAS HALF YEAR 2015 FINANCIAL RESULTS 1
 QANTAS HALF YEAR 2015 FINANCIAL RESULTS 1 Key points: Underlying Profit Before Tax: $367 million Statutory Profit After Tax: $206 million Transformation benefits: $374 million Comparable unit cost reduction:
AIR PASSENGER MARKET ANALYSIS
 Monthly RPK (Billions) Monthly FTK (Billions) Index of business confidence % change over year AIR PASSENGER MARKET ANALYSIS NOVEMBER 2013 KEY POINTS Air travel markets increased at a solid rate in November,
State of the Airport Robert S. Bowen, Executive Director October 18, 2018
 Robert S. Bowen, Executive Director October 18, 2018 A Year of Change The last year will be remembered as a period when the airlines, bolstered by a growing national economy, moderate fuel prices and changing
AIR PASSENGER MARKET ANALYSIS
 AIR PASSENGER MARKET ANALYSIS OCTOBER 2014 KEY POINTS Air travel volumes were up 5.7% in October year-on-year, slightly stronger than the September rise of 5.2%, and a continuation of the positive growth
Spirit Airlines Reports First Quarter 2018 Results
 Spirit Airlines Reports First Quarter 2018 Results MIRAMAR, Fla., April 26, 2018 - Spirit Airlines, Inc. (NYSE: SAVE) today reported first quarter 2018 financial results. For the first quarter 2018, Spirit