UBS ASEAN Conference September 2015
|
|
|
- Bryce Sullivan
- 6 years ago
- Views:
Transcription


1 UBS ASEAN Conference September 2015


2 Our Business Food Solutions Airline catering Institutional catering Gateway Services Passenger services and lounge management Ramp and baggage handling Food distribution and logistics Airline linen laundry Airfreight handling and logistics Aviation security Cruise centre management 2
3 Financial Summary $1.8 billion Revenue 1 $195.7 million PATMI 1 $48.1 million Share of results of Associates/JV 1 $2.1 billion Assets % Return on equity 1 $4 billion Market cap 3 1 For the twelve months ended 31 March 2015, 2 As of 30 June 2015, 3 As of 31 August
4 Revenue Growth Beyond Singapore and Aviation FY99 Japan 13% FY15 Others 5% Singapore 100% Geography Singapore 82% Non- Aviation 20% Aviation 100% Industry Aviation 80% Food Solutions 48% Corp 1% Gateway Services 51% Business Gateway Services 40% Food Solutions 60% 4
5 Strong Balance Sheet, Improving Return on Equity $366.6 million Net Cash 1 14 Return on Equity and Debt-Equity Ratio 13.7% % 11.3% 12.7% 12.8% x 0.10x 0.09x 0.08x 0.07x FY11 FY12 FY13 FY14 FY Return on equity Debt-equity ratio 1 As of 30 June
6 Resilient Cash Flows, Growing Ordinary Dividends Free Cash Flow and Dividends Dividend Per Share S$ millions cents FY11 FY12 FY13 FY14 FY15 Free cash flow Dividends FY11 FY12 FY13 FY14 FY15 Ordinary Special 6
 SATS STI Source:")
7 Share Price Performance vs. STI (5 Years) Total return incl. dividends +72% SATS +15% Straits Times Index Total Return (%) SATS STI Source: Bloomberg, As of 31 August
8 Our Vision and Mission Vision SATS is Asia s leading food solutions and gateway services company We operate state-of-the-art facilities to provide food solutions that delight our customers We improve connectivity for our customers through our comprehensive gateway services across the region Mission To be the first-choice provider of food solutions and gateway services by delighting customers with our innovation and passion 8


9 Tailor-Made Food Solutions for Varying Customer Needs Largest inflight and institutional caterer 6 production facilities > 40 international and award winning chefs Range of offerings include cook fresh, cook chill, cook freeze and retort Customer segments include hospitality, healthcare, education, military and retail 9


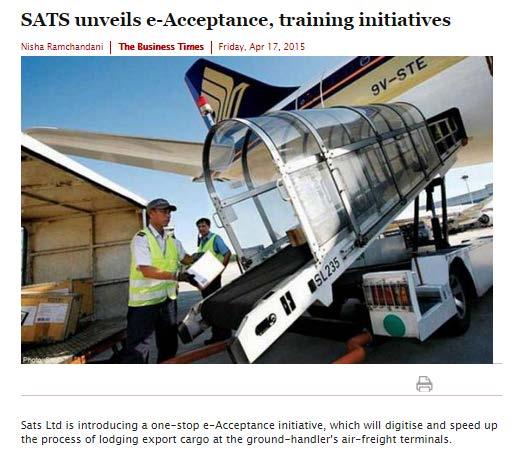
10 Comprehensive Gateway Hub Handling Capabilities Presence in Singapore Passenger services Changi Airport T1-3 Airfreight Terminals 1-6 Marina Bay Cruise Centre Cruise centre Ramp handling management Transshipment freight handling Perishable handling 10
 83 million Passengers 1 84 million Meals 1 4")


11 Asia s Largest Food and Gateway Services Network 43 Airports 11 Countries 638,000 Flights 1 Jilin Beijing Shenyang Tianjin Tokyo (Narita & Haneda) 83 million Passengers 1 84 million Meals 1 4 million Tonnes of cargo 1 Abu Dhabi Male India Mumbai Goa Chennai Mangalore Bangalore Trivandrum Taichung Taipei Hong Kong Kaohsiung Macau Manila Ho Chi Minh City Amritsar Delhi Kolkata Hyderabad Singapore Indonesia Medan Sesayap, Tarakan Pekanbaru Batam Manado Padang Muara Teweh Bontang Palembang Balikpapan Batu Kajang Halim Semarang Asam-Asam Jakarta Makassar Bandung Surabaya Yogyakarta Solo Lombok Denpasar Rockhampton Brisbane Gateway Services Food Solutions Gateway Services and Food Solutions Timika 1 Based on FY15 aviation statistics for Singapore and overseas operations 11 6
12 Growing Asian Demand for Safe, Healthy and Cosmopolitan Food Food Consumption a CAGR % Asia-9 b 7.0 China 8.1 Indonesia 5.9 Philippines 4.1 Singapore 8.0 a DBS Group Research, BMI (assume constant USD) b China, Hong Kong, Taiwan, Korea, Singapore, Malaysia, Indonesia, Thailand, Philippines 12
13 for e-commerce 1200 B2C e-commerce sales (in USD billions) Asia-Pacific 28% CAGR in B2C e-commerce North America 12% CAGR in B2C e-commerce Source: emarketer, January
14 for Travel Air Travel Penetration Rate (%) a Asia 0.4 Europe 3.3 N. America 5.6 Asia Pacific Air Traffic to Grow 6.3% Annually Until 2033 b Within Europe Transpacific Europe - Latam Europe - Asia Pac Within Asia Pac Within China Within Latam Middle East - Asia Pac a Changi Airport Group b Current Market Outlook 2014, Boeing 14
15 Airport Infrastructure Upgrades Across Asia Airport Al Maktoum International Airport, Dubai Current Capacity Planned Capacity (in millions of passengers) Completion Beijing International Airport, China Changi Airport, Singapore mid-2020s Incheon International Airport, South Korea Suvarnabhumi Airport, Thailand Soekarno-Hatta International Airport, Indonesia Chhatrapati Shivaji International Airport, India

16 Power Up Transformation 16
17 1Q FY15/16 Performance Review 17
18 Operating Statistics for Singapore Aviation Business 1Q15/16 1Q14/15 Change (%) Passengers Handled ('M) (6.1) Flights Handled ('000) (9.1) Unit Services Handled ('000) (4.2) Cargo/Mail Processed ('000 tonnes) Gross Meals Produced ('M) Unit Meals Produced ('M) * The above aviation operating data cover Singapore operations only. * Except for unit and gross meals produced, all data include LCC operations. 18
19 1Q15/16 Financials $M 1Q15/16 1Q14/15 Favourable/ (Unfavourable) Change (%) Revenue (4.2) Expenditure (372.9) (395.5) 5.7 Operating Profit EBITDA Share of Results of Associates/JVs, Net of Tax Impairment of Assets Held for Sale Net gain from transfer of business to a JV (0.1) n.m n.m. PBT PATMI Underlying Net Profit* n.m. not meaningful * Underlying net profit refers to profit attributable to owners of the Company excluding one-off items net gain from transfer of business to a JV and impairment loss on carrying value of Assets Held for Sale. 19
20 Financial Indicators % 1Q15/16 1Q14/15 Change (ppt) Operating Margin EBITDA Margin PBT Margin PATMI Margin Underlying Net Margin Q15/16 1Q14/15 Change (%) EPS Based on PATMI (cents) JUN MAR 15 NAV Per Share ($) Debt-to-Equity Ratio Overall, margins and EPS have improved. 20
21 Group Segmental Revenue $M 1Q15/16 1Q14/15 Change (%) By Business: Food Solutions (8.2) Gateway Services Corporate (15.4) Total (4.2) By Industry: Aviation (2.7) Non-Aviation (10.4) Corporate (15.4) Total (4.2) By Geographical Location: Singapore (1.5) Japan (17.8) Others (11.9) Total (4.2) Revenue mix between Food and Gateway unchanged at 60:40. 21
22 Group Expenditure $M 1Q15/16 1Q14/15 Favourable/ (Unfavourable) Change (%) Staff Costs Cost of Raw Materials Licence Fees Depreciation & Amortisation Company Premise & Utilities Expenses (2.4) Other Costs Group Expenditure Group Revenue (4.2) Operating expenditure declined at a faster rate than the drop in revenue. Lower cost of raw materials was due to better sourcing and in line with lower food solutions revenue. 22
23 Associates/JVs Performance by Business $M 1Q15/16 1Q14/15 Change (%) PAT Food Solutions Gateway Services Dividends Received (2.8) AISATS, AAT, BAIK, MIC and PT JAS together contributed approximately 80% of our share of after-tax profits from associates/jvs. Both food and gateway associates/jvs continue to show strength. 23
24 Group Balance Sheet $M As at 30 JUN 15 As at 31 MAR 15 Total Equity 1, ,517.6 Long-term Loans Other Long-Term Liabilities Current Liabilities Total Equity & Liabilities 2, ,019.7 Fixed Assets & Investment Property Associated Companies & JVs Intangible Assets Other Non-Current Assets & Long-Term Investment Current Assets Cash & Short-Term Deposits Debtors & Other Current Assets Total Assets 2, ,019.7 Cash & short-term deposits increased mainly due to higher cash generated from operating activities, dividends from associates/jvs and proceeds from exercise of share options. 24
25 Group Cash Flow Statement $M 1Q15/16 1Q14/15 Difference Net Cash From Operating Activities (18.4) Net Cash From Investing Activities Net Cash From Financing Activities (2.3) Net Increase In Cash & Cash Equivalents (15.8) Cash & Cash Equivalents At End Of Financial Period Free Cash Flow* (10.1) Net cash from investing activities was higher due to lower capital expenditure, partly offset by lower dividends from associates and net investment in SATS BRF Food. * Free Cash Flow refers to net cash from operating activities less cash purchases of capital expenditure. 25
26 Outlook Competition between airlines in Asia continues to be intense amid relatively low growth in air traffic in the near term. Despite slower economic growth and rising manpower costs, the structural growth prospects of Asia remain strong with rapid urbanisation and growth of the middle class. The Group is well-positioned to capture these opportunities. We are progressing well with our strategy of driving productivity through scale and connectivity, and launching new ventures that will support our future growth. 26


27 End 27
An Overview of SATS. Cho Wee Peng, CFO SIAS Corporate Profile & Investment Seminar 30 November 2013
 An Overview of SATS Cho Wee Peng, CFO SIAS Corporate Profile & Investment Seminar 30 November 2013 Forward Looking Statements This presentation may contain forward-looking statements regarding, among other
Air China Limited Annual Results. March Under IFRS
 Air China Limited 21 Annual Results Under IFRS March 211 Agenda Part 1 Highlights Part 2 Business Overview Part 3 Financial Overview Part 4 Outlook 2 Part 1 Highlights Steady Economic Growth; Asia Pacific
FIRST QUARTER OPERATING PROFIT IMPROVES TO $274 MILLION
 1 August 2006 Page 1 of 4 No. 03/06 1 August 2006 FIRST QUARTER OPERATING PROFIT IMPROVES TO $274 MILLION HIGHLIGHTS OF THE GROUP S PERFORMANCE 1st Quarter 2006-07 Year-on-Year % Change Operating revenue
Cathay Pacific Airways
 Cathay Pacific Airways Interim Results for the six months ended 30 th June 2014 13th August 2014 1 Interim Results 1H2014 1H2013 Change Profit attributable to the shareholders of Cathay Pacific HK$ million
Changi Airport registers a record 58.7 million passengers in Strong performance on both the passenger and airfreight fronts
 Media Release Changi Airport registers a record 58.7 million passengers in 2016 Strong performance on both the passenger and airfreight fronts SINGAPORE, 30 January 2017 Singapore Changi Airport recorded
Cathay Pacific Airways Interim Results for the six months ended 30 June 2012
 Cathay Pacific Airways Interim Results for the six months ended 30 June 2012 8 August 2012 1 Interim Result 1H2012 1H2011 Change Group attributable (loss) / profit HK$ million (935) 2,808-133.3% Group
Air China Limited Interim Results. August Under IFRS
 Air China Limited 21 Interim Results Under IFRS August 21 1 Agenda 21 Interim Results Overview Business Overview Financial Overview Outlook 2 2 2 21 Interim Results 3 21 Interim Results Overview 4 4 4
SIA ENGINEERING COMPANY 1 st Half FY17/18 Financial Review
 SIA SIA ENGINEERING ENGINEERING COMPANY COMPANY 11 st st Half Half FY17/18 FY17/18 Performance Performance Review Review 1 2 SIA ENGINEERING COMPANY 1 st Half FY17/18 Financial Review 1H17/18 Financial
Analysts Briefing. 18 March Cathay Pacific Airways Limited
 Analysts Briefing 18 March 2015 Cathay Pacific Airways Limited Annual Results 2014 2013 Change Group attributable profit HK$m 3,150 2,620 +20.2% Group turnover HK$m 105,991 100,484 +5.5% Profit margin
With an excellent Track Record of over 30 years,
 3QFY2010 Results Presentation February 12, 2010 Our Competitive Position With an excellent Track Record of over 30 years, Tat Hong is # 1 crane company in the Australasia Region 1 # 2 in the world in terms
1 st Half FY17/18 FY17/18
 SIA SIA ENGINEERING ENGINEERING COMPANY COMPANY 1 st Half Performance Performance Review Review 1 2 SIA ENGINEERING COMPANY Financial Review Financial Highlights The Group posted a net profit of $184.1M
JAPAN AIRLINES Co., Ltd. Financial Results 1 st Quarter Mar/2018(FY2017)
") JAPAN AIRLINES Co., Ltd. Financial Results Mar/2018(FY2017) July 31, 2017 Today s Topics P.1 P.2 P.3 P.4 P.6 P.15 Overview of Financial Results for (FY2017) 1 st quarter resulted in an increase in both
JAPAN AIRLINES Co., Ltd. Financial Results Mar/2018(FY2017) July 31, 2017 Today s Topics P.1 P.2 P.3 P.4 P.6 P.15 Overview of Financial Results for (FY2017) 1 st quarter resulted in an increase in both
ANA HOLDINGS Financial Results for the Six Months Ended September 30, 2018
 ANA HOLDINGS NEWS ANA HOLDINGS Financial Results for the Six Months Ended September 30, 2018 TOKYO, Nov. 2, 2018 ANA HOLDINGS INC. (hereinafter ANA HD ) today reports its financial results for the six
Thank you for participating in the financial results for fiscal 2014.
 Thank you for participating in the financial results for fiscal 2014. ANA HOLDINGS strongly believes that safety is the most important principle of our air transportation business. The expansion of slots
ANA HOLDINGS Financial Results for the Three Months Ended June 30, 2018
 ANA HOLDINGS NEWS ANA HOLDINGS Financial Results for the Three Months Ended June 30, 2018 TOKYO, July 31, 2018 ANA HOLDINGS INC. (hereinafter ANA HD ) today reports its financial results for the three
Q Fast growth continued, Comparable operating result at record high levels Pekka Vauramo
 2018 Fast growth continued, Comparable operating result at record high levels 17.7.2018 Pekka Vauramo 2 A good - Comparable operating result increased to new seasonal high Revenue Comparable operating
SECOND QUARTER OPERATING PROFIT IMPROVES TO $87 MILLION
 12 November 2013 Page 1 of 5 No. 05/13 12 November 2013 SECOND QUARTER OPERATING PROFIT IMPROVES TO $87 MILLION GROUP FINANCIAL PERFORMANCE Second Quarter 2013-14 The Group earned an operating profit of
ANA HOLDINGS Financial Results for FY2014
 ANA HOLDINGS NEWS ANA HOLDINGS Financial Results for FY2014 TOKYO, April 30, 2015 ANA HOLDINGS (hereafter ANA HD ) today reports its consolidated financial results for fiscal year 2014 (April-March). Highlights
CONSOLIDATED PROFIT AND LOSS ACCOUNT
 CONSOLIDATED PROFIT AND LOSS ACCOUNT for the year ended 31st December Turnover Note Passenger services 26,407 18,663 Cargo services 11,395 9,913 Catering and other services 1,263 1,002 Total turnover 1
Yongnam Holdings Limited
 Yongnam Holdings Limited FY2008 Results Presentation February 27, 2009 Contents Our Business Corporate Updates FY2008 Financial Performance Prospects and Market Outlook Growth Strategies and Plans Key
HALF YEAR REPORT February Leighton Holdings Limited
 HALF YEAR REPORT February 2009 PRESENTATION OUTLINE Results highlights Operational update Financial statements Strategy and outlook 2 Half Year Report I 12 February 2009 I RESULTS HIGHLIGHTS 3 Half Year
Air China Limited 2014 Annual Results Under IFRS
 Air China Limited 2014 Annual Results Under IFRS March 2015 Agenda Part 1 Results Highlights Part 2 Business Overview Part 3 Financial Overview Part 4 Outlook Part 1 Results Highlights Gradual Global Economic
Tiger Airways Holdings Limited FY11 Results
 Tiger Airways Holdings Limited FY11 Results May 2011 Financial Year Ended 31 March 2011 Disclaimer The information contained in this presentation (the "Information") is provided by Tiger Airways Holdings
Asia-Pacific Aviation: Growth and Challenges
 Asia-Pacific Aviation: Growth and Challenges A presentation to the ACI-NA International Aviation Issues Seminar Steve Martin Page 1 Page 2 Defining the Asia Pacific We ll call it GMT +5 GMT +12, minus
HIGH FUEL PRICES DRIVE HALF YEAR PROFIT DOWN 62% AMIDST CHALLENGING ENVIRONMENT
 3 November 2011 Page 1 of 4 No. 06/11 03 November 2011 HIGH FUEL PRICES DRIVE HALF YEAR PROFIT DOWN 62% AMIDST CHALLENGING ENVIRONMENT GROUP FINANCIAL PERFORMANCE First Half 2011-12 The Group made a net
2008/09 Interim Results For the six months ended 31 December 2008
 Bossini International Holdings Limited 2008/09 Interim Results For the six months ended 31 December 2008 Corporate Presentation 18 March 2009 0 0 Disclaimer The information contained in this presentation
Part 1 Performance Highlights. Part 2 Business Overview. Part 3 Financial Review
 August 216 1 Part 1 Performance Highlights Part 2 Business Overview Part 3 Financial Review Part 4 Outlook 2 Under IFRS 3 Part 1 Performance Highlights Performance Highlights - Key Operational Metrics
FIRST QUARTER OPERATING PROFIT RISES TO $281 MILLION
 27 July 2017 Page 1 of 5 No. 03/17 27 July 2017 FIRST QUARTER OPERATING PROFIT RISES TO $281 MILLION Revenue improvement seen for all SIA Group airlines, but pressure on yields remains Earnings supported
FULL YEAR OPERATING PROFIT RISES TO $259 MILLION 25 CENTS SPECIAL DIVIDEND PROPOSED OUTLOOK REMAINS CHALLENGING
 8 May 2014 Page 1 of 5 No. 02/14 8 May 2014 FULL YEAR OPERATING PROFIT RISES TO $259 MILLION 25 CENTS SPECIAL DIVIDEND PROPOSED OUTLOOK REMAINS CHALLENGING GROUP FINANCIAL PERFORMANCE Financial Year 2013-14
Analyst Meeting 1Q/2015
 Analyst Meeting 1Q/2015 DISCLAIMER The presentation is dated the day it is given. The delivery of this presentation shall not, under any circumstances, create any implication that there has been no change
H1 FY2013/14 Performance Review
 H1 FY2013/14 Performance Review 1 H1 FY2013/14 Performance Review (Financial) 2 Summary of Group Results 1HFY1314 1HFY1213 Variance $M $M % Revenue 583.3 585.0-0.3 Expenditure 527.1 519.0 + 1.6 Operating
H1 FY2015/16 Performance Review
 1 H1 FY2015/16 Performance Review 2 Financial Review Summary of Group Results 1H FY1516 1H FY1516 1H FY1415 Variance $M $M % Revenue 543.3 579.3-6.2 Expenditure 495.4 542.7-8.7 Operating profit 47.9 36.6
Financial Results 3 rd Quarter MAR/2016 (FY2015)
") Financial Results MAR/2016 (FY2015) January 29 th, 2016 CONTENTS P.1 P.2 P.3 P.4~ Overview of FY MAR/16 Results Operating Revenue Operating Profit 1,030 1,020 1,010 +1.0Bn 1,022.3 1,023.4 (+0.1%) 180 160
Financial Results MAR/2016 (FY2015) January 29 th, 2016 CONTENTS P.1 P.2 P.3 P.4~ Overview of FY MAR/16 Results Operating Revenue Operating Profit 1,030 1,020 1,010 +1.0Bn 1,022.3 1,023.4 (+0.1%) 180 160
THIRD QUARTER PROFIT DOWN 43% TO $337 MILLION
 THIRD QUARTER PROFIT DOWN 43% TO $337 MILLION GROUP FINANCIAL PERFORMANCE Third Quarter 2008-09 The Group earned a net profit attributable to equity holders of $337 million for the third quarter (October
FY2015 2nd Quarter Business Results
 FY2015 2nd Quarter Business Results Project AH A MAY products Yamaha Corporation and Yamaha Motor Co., Ltd. make products by exchanging the design divisions and their design fields, and present a joint
Financial Results 1 st Quarter Mar/2016 (FY2015) 30 July, 2015
 30 July, 2015") Financial Results Mar/2016 (FY2015) 30 July, 2015 Today s Topics P.2 P.3 P.15 1 Overview of FY Mar/2016 Financial Results Operating Revenue Operating Profit 320 307.0 +4.9Bn (+1.6%) 312.0 50 +17.6Bn (+94.6%)
Financial Results Mar/2016 (FY2015) 30 July, 2015 Today s Topics P.2 P.3 P.15 1 Overview of FY Mar/2016 Financial Results Operating Revenue Operating Profit 320 307.0 +4.9Bn (+1.6%) 312.0 50 +17.6Bn (+94.6%)
Corporate Presentation 2015/16 Interim Results
 Corporate Presentation 2015/16 Interim Results 24 February 2016 0 Disclaimer The information contained in this presentation is intended solely for your personal reference. Such information is subject to
Finnair Group Interim Report 1 January 31 March 2008
 Finnair Group Interim Report 1 January 31 March 2008 1 29/04/2008 Presentation name / Author Outlook for the industry less positive Growth of demand declining due to uncertainty of global economy Growth
ANA HOLDINGS Financial Results for the Year ended March 31, 2016
 ANA HOLDINGS NEWS ANA HOLDINGS Financial Results for the Year ended March 31, 2016 TOKYO, April 28, 2016 ANA HOLDINGS (hereafter ANA HD ) today reports its consolidated financial results for fiscal year
Credit Suisse. 19 th Annual AIC 8 th April Cathay Pacific Airways Limited
 Credit Suisse 19 th Annual AIC 8 th April 2016 Cathay Pacific Airways Limited Annual Results - 2015 Group Financial Statistics 2015 2014 % Var Group Revenue HK$m 102,342 105,991-3.4% Group attributable
JAPAN AIRLINES Co., Ltd. Financial Results 1 st Quarter Mar/2018(FY2017)
") JAPAN AIRLINES Co., Ltd. Financial Results Mar/2018(FY2017) July 31, 2017 Today s Topics P.1 P.2 P.3 P.4~ P.6~ P.15~ Overview of Financial Results for Mar/18 Mar/18 (FY2017) 1 st quarter resulted in an
JAPAN AIRLINES Co., Ltd. Financial Results Mar/2018(FY2017) July 31, 2017 Today s Topics P.1 P.2 P.3 P.4~ P.6~ P.15~ Overview of Financial Results for Mar/18 Mar/18 (FY2017) 1 st quarter resulted in an
Summary of Results for the First Quarter of FY2015/3
 Summary of for the First Quarter of FY2015/3 August 8, 2014 Tokyu Corporation (9005) http://www.tokyu.co.jp/ Contents Ⅰ.Executive Summary 2 Ⅱ.Conditions in Each Business 4 Ⅲ.Details of Financial for the
Summary o f Results for the First Half of FY2018
 Summary o f Results for the First Half of FY2018 November 9, 2018 (9005) https://www.tokyu.co.jp/ Contents Ⅰ.Executive Summary 2 Ⅱ.Conditions in Each Business 6 Ⅲ.Details of Financial Results for the 13
Cathay Pacific Airways 2011 Interim Results 10 August 2011
 Cathay Pacific Airways 2011 Interim Results 10 August 2011 1 Interim Result 1H 2011 1H 2010 Group profit HK$2,808m HK$6,840m Group turnover HK$46,791 HK$41,337m Profit margin 6.0% 16.5% Return on capital
QANTAS HALF YEAR 2015 FINANCIAL RESULTS 1
 QANTAS HALF YEAR 2015 FINANCIAL RESULTS 1 Key points: Underlying Profit Before Tax: $367 million Statutory Profit After Tax: $206 million Transformation benefits: $374 million Comparable unit cost reduction:
RECORD REVENUE AND EFFICIENCY DRIVE SOFTEN IMPACT OF HIGH FUEL COST, ENABLE HALF YEAR PROFIT OF $578 MILLION
 RECORD REVENUE AND EFFICIENCY DRIVE SOFTEN IMPACT OF HIGH FUEL COST, ENABLE HALF YEAR PROFIT OF $578 MILLION HIGHLIGHTS OF THE GROUP S PERFORMANCE First Half 2005-06 2nd Quarter 2005-06 Apr-Sep 2005 Year-on-Year
Finnair Group Interim Report 1 January 30 June 2008
 Finnair Group Interim Report 1 January 30 June 2008 1 08/08/2008 Presentation name / Author Airline industry at a historical turning point Fuel price has a stranglehold on the business Average ticket prices
Analyst Presentation. 9 th June 2006
 Analyst Presentation 9 th June 2006 1 Existing Principal Shareholding Structure CITIC Pacific 46.30% 25.40% 10.00% 68.36% CNAC(HK) 43.29% 7.71% 17.79% 28.50% Dragonair Source: Announcement on 9 th June
Singapore Airlines Group Analyst/Media Briefing HALF YEAR FY RESULTS. 13 November 2013 THE PARENT AIRLINE 1H FY2013/14 RESULTS
 Singapore Airlines Group Analyst/Media Briefing HALF YEAR FY2013-14 14 RESULTS 13 November 2013 THE PARENT AIRLINE 1H FY2013/14 RESULTS THE PARENT AIRLINE COMPANY RESULTS 2Q & 1H FY13/14 2Q/13 $million
$168 MILLION PROFIT FOR FIRST HALF
 2 November 2012 Page 1 of 4 No. 05/12 02 November 2012 $168 MILLION PROFIT FOR FIRST HALF GROUP FINANCIAL PERFORMANCE First Half 2012-13 The SIA Group registered a net profit of $168 million in the first
Finnair Q Result
 17 August 2016 CEO Pekka Vauramo CFO Pekka Vähähyyppä Finnair Q2 2016 Result 1 Highlights of the second quarter The seventh consecutive quarter of profit improvement Fukuoka & Guangzhou route openings
JAPAN AIRLINES Co., Ltd. Financial Results 1 st Quarter Mar/2017(FY2016) July 29, 2016
 July 29, 2016") JAPAN AIRLINES Co., Ltd. Financial Results Mar/2017(FY2016) July 29, 2016 Today s Topics P.1 P.2 P.13 From the first quarter of this fiscal year, figures for Revenue Passengers Carried, ASK, RPK and Load
JAPAN AIRLINES Co., Ltd. Financial Results Mar/2017(FY2016) July 29, 2016 Today s Topics P.1 P.2 P.13 From the first quarter of this fiscal year, figures for Revenue Passengers Carried, ASK, RPK and Load
CATHAY PACIFIC AIRWAYS LIMITED (Incorporated in Hong Kong with limited liability) (Stock Code: 293)
 (Stock Code: 293)") CATHAY PACIFIC AIRWAYS LIMITED (Incorporated in Hong Kong with limited liability) (Stock Code: 293) 2006 Interim Results Financial and Operating Highlights Group Financial Statistics 2006 2005 Change Results
CATHAY PACIFIC AIRWAYS LIMITED (Incorporated in Hong Kong with limited liability) (Stock Code: 293) 2006 Interim Results Financial and Operating Highlights Group Financial Statistics 2006 2005 Change Results
Corporate Presentation 2012/13 Interim Results
 Corporate Presentation 2012/13 Interim Results 26 February 2013 0 Disclaimer The information contained in this presentation is intended solely for your personal reference. Such information is subject to
ANA HOLDINGS Financial Results for the Three Months ended June 30, 2015
 ANA HOLDINGS NEWS ANA HOLDINGS Financial Results for the Three Months ended June 30, 2015 TOKYO, July 29, 2015 ANA HOLDINGS (hereinafter ANA HD ) today reports its financial results for the three months
Crown Resorts Limited
 Crown Resorts Limited Annual General Meeting 20 October 2016 1 Presentation Outline F16 Year in Review 2 Crown Resorts Limited Group Result F16 Normalised $m F15 Normalised $m Variance F/(U) F16 Actual
Cathay Pacific Airways 2010 Annual Results 9 March 2011
 Cathay Pacific Airways 2010 Annual Results 9 March 2011 1 Annual Result 2010 2009 Change Group Profit/(Loss) HK$14,048m HK$4,694m +199.3% Group Turnover HK$89,524m HK$66,978m +33.7% Profit Margin 15.7%
INVESTOR RELATIONS Earnings Release
 INVESTOR RELATIONS 2017 2017 Earnings Release 1 Disclaimer This document contains parent results for 2017 based on K-IFRS. These statements involve risks and uncertainties, and actual results may differ.
JAPAN AIRLINES Co., Ltd. Financial Results 3 rd Quarter Mar/2018(FY2017) January 31, 2018
 January 31, 2018") JAPAN AIRLINES Co., Ltd. Financial Results 3 rd Quarter Mar/2018(FY2017) January 31, 2018 Today s Topics P.1 P.2 P.3 P.12 JAL Corporate Website the CONTRAIL Project Overview of Financial Results for 3
JAPAN AIRLINES Co., Ltd. Financial Results 3 rd Quarter Mar/2018(FY2017) January 31, 2018 Today s Topics P.1 P.2 P.3 P.12 JAL Corporate Website the CONTRAIL Project Overview of Financial Results for 3
Corporate Presentation
 Corporate Presentation 2010/11 Interim Results 22 February 2011 Bossini International Holdings Limited 堡獅龍國際集團有限公司 Disclaimer The information contained in this presentation is intended solely for your
Cathay Pacific Airways Cathay Pacific Airways 2008 Annual Results Investor Relations Meeting 11 March June 2009
 Cathay Pacific Airways Cathay Pacific Airways 2008 Annual Results Investor Relations Meeting 11 March 2009 22 June 2009 Airline Strategy Continue to grow our extensive international network, expand frequencies
THIRD QUARTER NET PROFIT OF $397 MILLION ON RECORD REVENUE
 THIRD QUARTER NET PROFIT OF $397 MILLION ON RECORD REVENUE HIGHLIGHTS OF THE GROUP S PERFORMANCE 3rd Quarter 2005-06 9 Months 2005-06 Year-on-Year Apr-Dec % Change 2005 Oct-Dec 2005 Year-on-Year % Change
2016 HALF YEAR RESULTS. Mandarin Oriental Hotel Group
 2016 HALF YEAR RESULTS Mandarin Oriental Hotel Group 2016 Half Year Results Highlights US $ m June 2016 June 2015 Combined Total Revenue * 644 641 Underlying EBITDA 71 82 * Includes revenue from the Group
PARENT AIRLINE OPERATIONS LIFT GROUP PROFIT
 PARENT AIRLINE OPERATIONS LIFT GROUP PROFIT HIGHLIGHTS OF THE GROUP S PERFORMANCE Financial Year 2006-07 4th Quarter 2006-07 Apr 2006 Mar 2007 Year-on-Year % Change Jan-Mar 2007 Year-on-Year % Change Operating
Changi Airport Group releases FY2011/12 Annual Report
 Media Release Changi Airport Group releases FY2011/12 Annual Report SINGAPORE, 14 September 2012 Changi Airport Group (CAG) today released its annual report for the financial year ended 31 March 2012 (FY11/12).
WEAK FOURTH QUARTER CAPS FULL-YEAR PROFIT AT $1.06 BILLION
 WEAK FOURTH QUARTER CAPS FULL-YEAR PROFIT AT $1.06 BILLION GROUP FINANCIAL PERFORMANCE Financial Year 2008-09 The Group earned a net profit attributable to equity holders of $1,062 million for the financial
Tat Hong Reports 13% Decline in FY2017 Revenue
 FOR IMMEDIATE RELEASE Registration No: 199105392H Tat Hong Reports 13 Decline in FY2017 Revenue - Cash and cash equivalents of S$114.3 million - Cash flow from operations of S$85.2 million - Net gearing
Auckland International Airport FY19 Interim Results: Positive start to year as airport progresses anchor infrastructure projects
 Media Release 22 February 2019 Auckland International Airport FY19 Interim Results: Positive start to year as airport progresses anchor infrastructure projects Auckland Airport today announced its financial
A n n u a l R e s u l t s
 2 0 1 3 A n n u a l R e s u l t s 27 February 2014 Overview Accounting Sales up 3%. Global Brand Sales down 2%. Sales mainly decline in China, Taiwan and Singapore offset by growth in other markets, particularly
Media Release QANTAS RESULTS FOR THE HALF YEAR ENDED 31 DECEMBER 2004 HIGHLIGHTS. Fully franked interim dividend of 10 cents per share
 Media Release QANTAS RESULTS FOR THE HALF YEAR ENDED 31 DECEMBER 2004 HIGHLIGHTS Profit before tax of $601.3 million Net profit after tax of $458.4 million Revenue of $6.4 billion Fully franked interim
THIRD QUARTER OPERATING PROFIT UP 13% TO $330 MILLION
 13 February 2018 Page 1 of 7 ` No. 01/18 13 February 2018 THIRD QUARTER OPERATING PROFIT UP 13% TO $330 MILLION Higher carriage and load factors for all passenger airlines Strong earnings for SIA Cargo
Cathay Pacific Airways 2012 Analyst Briefing 28 June 2012
 Cathay Pacific Airways 2012 Analyst Briefing 28 June 2012 1 Airline Strategy Grow our international network, expand frequencies and further develop Hong Kong as one of the world s leading aviation hubs
ANALYST MEETING 3Q2015
 ANALYST MEETING 3Q2015 November 12, 2015 DISCLAIMER The presentation is dated the day it is given. The delivery of this presentation shall not, under any circumstances, create any implication that there
2007/08 Interim Results
 Bossini International Holdings Limited 2007/08 Interim Results For the six months ended 31 December 2007 Corporate Presentation 19 March 2008 0 Agenda Results Highlights Review of Operations Future Plans
Q Finnair s growth continued Pekka Vähähyyppä
 2018 Finnair s growth continued 25.10.2018 Pekka Vähähyyppä 1 We continued to develop our services and network New route to Los Angeles in 2019, two daily flights to Hong Kong New digital service for exploring
PROFIT OF $1.24b ON STRONG REVENUE GAINS BUT FUEL COSTS REMAIN GREATEST CHALLENGE
 PROFIT OF $1.24b ON STRONG REVENUE GAINS BUT FUEL COSTS REMAIN GREATEST CHALLENGE HIGHLIGHTS OF THE GROUP S PERFORMANCE Financial Year 2005-06 4th Quarter 2005-06 Apr 2005 Mar 2006 Year-on-Year % Change
JAPAC TRAVELLER REPORT. Transit/Carrier. Peak time for engagement. Top engaged audience. Repeat Travellers per month. Tokyo.
 Tokyo JAPAC TRAVELLER REPORT Delhi Mumbai Hong Kong Macau Manila Bangkok Kuala Lumpur Singapore Jakarta Sydney Melbourne Tokyo Hong Kong Delhi Mumbai Macau Bangkok Kuala Lumpur Singapore Jakarta Manila
Cathay Pacific Airways
 Cathay Pacific Airways Annual Results for the year ended 31 st December 2011 14 March 2012 1 Annual Result 2011 2010 Change Group attributable profit HK$5,501m HK$14,048m -60.8% Group Turnover HK$98,406m
Results Presentation 27 May 2008
 Yongmao Holdings Limited Results Presentation 27 May 2008 Agenda About Yongmao FY08 Performance Review Outlook & Strategy 2 Company Overview Leading designer and manufacturer of tower cranes and accessories
Q Earnings Financial Results for the Third Quarter Ended December 31, January 29, 2015 OMRON Corporation
 Q3 2014 Earnings Financial Results for the Third Quarter Ended December 31, 2014 January 29, 2015 OMRON Corporation Contents 1. Summary 2. Q1-Q3 Results P. 2 P. 4 3. Full-Year Forecast P. 13 4. Corporate
Nicco Parks & Resorts Ltd BSE Scrip Code:
 Nicco Parks & Resorts Ltd BSE Scrip Code: 526721 Other Leisure Facilities September 14, 2012 Equity Statistics Current Market Price Rs. 15.9 52 Week High / Low Rs. 24.4/15.2 Market Capitalisation Rs. crores
Information meeting. Third quarter results. March 2011
 Information meeting Third quarter 2010-11 results 1 March 2011 Agenda 2010-11: recovery in activity and return to profitability Current issues Air France-KLM ambitions for the next three years 2 All businesses
Investor Presentation
 Investor Presentation ICR XChange January 17, 2008 Forward-Looking Statements Some of the statements in this presentation constitute forward-looking statements. Forward-looking statements relate to expectations,
Passenger services 7,438 10,550 Cargo services 4,405 4,225 Catering and other services Turnover 1 12,275 15,511
 Cathay Pacific Airways Limited - 2003 Interim Results Consolidated Profit and Loss Account - Unaudited Six months ended 30th June 2003 2002 Note Passenger services 7,438 10,550 Cargo services 4,405 4,225
2016 Half-Yearly Results
 Presentation 29th July 2016 2016 Half-Yearly Review Underlying profit down 6% Commercial portfolio benefited from higher occupancy Steady contribution from mainland China residential business Profit attributable
Emirates Group announces half-year performance for
 Final Emirates Group announces half-year performance for 2018-19 Group: Revenue up 10% to AED 54.4 billion (US$ 14.8 billion), and profit of AED 1.1 billion (US$ 296 million), down 53%. Results impacted
Jet Airways (India) Ltd. Presentation on Financial Results Q3 FY th January 2008
 Ltd. Presentation on Financial Results Q3 FY th January 2008") Jet Airways (India) Ltd. Presentation on Financial Results Q3 FY08 28 th January 2008 1 1 1 Agenda Performance highlights Q3 FY08 Apr - Dec FY08 Outlook JetLite performance highlights 2 2 2 Performance
Jet Airways (India) Ltd. Presentation on Financial Results Q3 FY08 28 th January 2008 1 1 1 Agenda Performance highlights Q3 FY08 Apr - Dec FY08 Outlook JetLite performance highlights 2 2 2 Performance
GECAS is a preeminent aircraft asset manager & financier
 GE Infrastructure Analyst Meeting November 2, 2005 GE Commercial Aviation Services Henry Hubschman President and CEO, GECAS 1 GECAS is a preeminent aircraft asset manager & financier 1,300+ owned and 300
INVEST IN BOUNTIFUL. THE best performing stock exchange for longterm investors
 INVEST IN BOUNTIFUL THE best performing stock exchange for longterm investors the indonesian archipelago: of spice islands and much more more THAN more THAN 17,000 250 ISLANDS MILLION PEOPLE INDONESIA
26 October 2017 Icelandair Group Interim Report NET PROFIT USD 101 MILLION IN THIRD QUARTER
 NET PROFIT USD 101 MILLION IN THIRD QUARTER Total income in Q3 up by 10% between years, to USD 536.0 million Passenger revenue higher than expected EBITDA unchanged year on year, at USD 161.1 million Passenger
Summary of Results for the First Three Quarters FY2015/3
 Summary of Results for the First Three Quarters FY2015/3 February 10, 2015 Tokyu Corporation (9005) http://www.tokyu.co.jp/ Contents Ⅰ.Executive Summary 2 Ⅱ.Conditions in Each Business 5 Ⅲ.Details of Financial
RESULTS RELEASE 20 August GENTING HONG KONG GROUP ANNOUNCES FIRST HALF RESULTS FOR 2015 Highlights
 RESULTS RELEASE 20 August 2015 FOR IMMEDIATE RELEASE INTERNATIONAL GENTING HONG KONG GROUP ANNOUNCES FIRST HALF RESULTS FOR 2015 Highlights The commentary below is prepared based on a comparison of the
Q Earnings Financial Results for the First Quarter Ended June 30, July 28, 2016 OMRON Corporation
 Q1 2016 Earnings Financial Results for the First Quarter Ended June 30, 2016 July 28, 2016 OMRON Corporation Summary Q1 Results Both sales and operating income are in line with internal plan (decreased
PRESS ANNOUNCEMENT JULY 28, 1999 For Immediate Release STAR CRUISES REPORTS RECORD SECOND QUARTER EARNINGS
 PRESS ANNOUNCEMENT JULY 28, 1999 For Immediate Release STAR CRUISES REPORTS RECORD SECOND QUARTER EARNINGS STAR CRUISES PLC announced record net income of US$20.7 million (US 3.3 cents earnings per share)
Cebu Air, Inc. 4 th Quarter and Full Year 2017 Results of Operations. cebupacificair.com
 Cebu Air, Inc. 4 th Quarter and Full Year 2017 Results of Operations cebupacificair.com Disclaimer The information provided in this presentation is provided only for your reference. Such information has
2012 Result. Mika Vehviläinen CEO
 2012 Result Mika Vehviläinen CEO 1 Agenda Market environment in Q4 Business performance and strategy execution Outlook Financials 2 Market Environment According to IATA, Global air travel continues to
Air China Limited 2015 First Quarter Results
 Air China Limited 2015 First Quarter Results April 2015 Under PRC GAAP, unaudited Agenda Part 1 Part 2 Part 3 Results Highlights Business Performance Financial Review Part 1 Results Highlights Results
ANA Holdings Financial Results for the Third Quarter of FY2013
 ANA HOLDINGS NEWS ANA Holdings Financial Results for the Third Quarter of FY2013 TOKYO January 31, 2014 - ANA Holdings (hereafter ANA HD ) today reports its consolidated financial for the third quarter
Finnair Q result. 25 October 2017 CEO Pekka Vauramo
 Finnair Q3 2017 result 25 October 2017 CEO Pekka Vauramo 1 All-time best quarter Revenue up by 15% to record level of 735 M Aircraft flew full, passenger load factor was 87% Asian routes and San Francisco
HK GAAP RESULTS RELEASE 25 February 2008 STAR CRUISES GROUP ANNOUNCES FOURTH QUARTER AND FULL YEAR RESULTS FOR 2007
 HK GAAP RESULTS RELEASE 25 February 2008 FOR IMMEDIATE RELEASE INTERNATIONAL STAR CRUISES GROUP ANNOUNCES FOURTH QUARTER AND FULL YEAR RESULTS FOR 2007 Key points for the quarter in comparison with 4Q