Record revenue Performance led to our 39th consecutive year of profitability a feat unmatched in U.S. aviation history.
|
|
|
- Bennett Ford
- 6 years ago
- Views:
Transcription

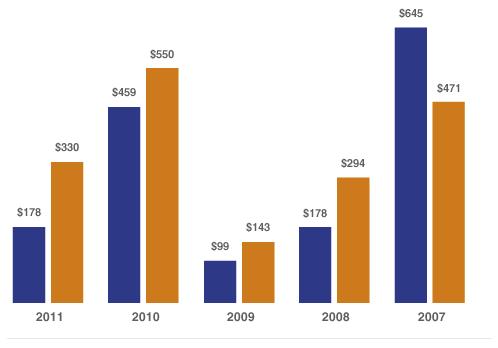
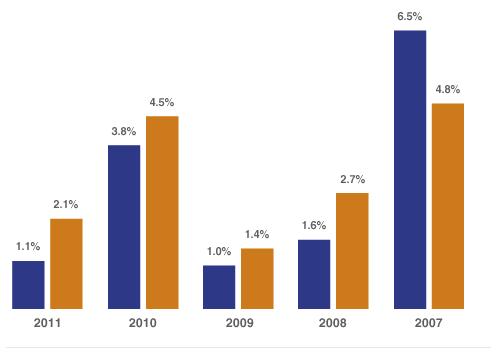
1 PERFORMANCE > 2011 PERFORMANCE Record revenue Performance led to our 39th consecutive year of profitability a feat unmatched in U.S. aviation history. In 2011, we achieved our 39th consecutive year of profitability, led by record operating revenues and load factors all while staying true to our low-fare philosophy. We reached a significant milestone on May 2, 2011, as we welcomed AirTran into the Southwest Family. Our strategic initiatives, including the acquisition of AirTran, contributed to our 29.4 percent year-over-year growth in revenues. Our 2011 earnings, however, declined year-over-year due to a 34.6 percent increase in operating expenses, driven largely by high jet fuel prices. To manage costs, we are focused on improving productivity and eliminating waste. We ended the year in a strong financial position with $3.1 billion in cash and short-term investments. In 2011, we had the following achievements: Earned a net income of $178 million, despite rapidly rising fuel costs Excluding special items, our net income was $330 million G Achieved record operating revenues of $15.7 billion Achieved a record annual load factor 1 of 80.9 percent Generated more than $400 million in free cash flow C Realized $80 million in net pre-tax synergies from the acquisition of AirTran Increased business partner cash sales by approximately $250 million through the All-New Rapid Rewards frequent flyer program Placed first in the industry Customer Satisfaction ranking 2 Expanded domestic market share to 25 percent 3 from 21 percent a year ago Remained the largest U.S. carrier in terms of Passengers carried 3 Realized a 7 percent return on invested capital (ROIC) before taxes and excluding special items 4 15
2 PERFORMANCE > 2011 PERFORMANCE 16
3 PERFORMANCE > 2011 PERFORMANCE 17

4 PERFORMANCE > 2011 PERFORMANCE 18
5 PERFORMANCE > 2011 PERFORMANCE NOTE REGARDING USE OF NON-GAAP FINANCIAL MEASURES The Company s consolidated financial statements are prepared in accordance with accounting principles generally accepted in the United States (GAAP). These GAAP financial statements include (i) unrealized non-cash adjustments and reclassifications, which can be significant, as a result of accounting requirements and elections made under accounting pronouncements relating to derivative instruments and hedging, and (ii) other charges the Company believes are not indicative of its ongoing operational performance. As a result, the Company also provides financial information in this report that was not prepared in accordance with GAAP and should not be considered as an alternative to the information prepared in accordance with GAAP. The Company provides supplemental non-gaap financial information, including results that it refers to as economic, which the Company s management utilizes to evaluate its ongoing financial performance and the Company believes provides greater transparency to investors as supplemental information to its GAAP results. The Company s economic financial results differ from GAAP results in that they only include the actual cash settlements from fuel hedge contracts all reflected within fuel and oil expense in the period of settlement. Thus, fuel and oil expense on an economic basis reflects the Company s actual net cash outlays for fuel during the applicable period, inclusive of settled fuel derivative contracts. Any net premium costs paid related to option contracts are reflected as a component of other (gains) losses, net, for both GAAP and non-gaap (including economic) purposes in the period of contract settlement. These economic results provide a better measure of the impact of the Company s fuel hedges on its operating performance and liquidity since they exclude the unrealized, non-cash adjustments and reclassifications that are recorded in GAAP results in accordance with accounting guidance relating to derivative instruments, and they reflect all cash settlements related to fuel derivative contracts within fuel and oil expense. This enables the Company s management, as well as investors, to consistently assess the Company s operating performance on a year-over-year or quarter-over-quarter basis after considering all efforts in place to manage fuel expense. However, because these measures are not determined in accordance with GAAP, such measures are susceptible to varying calculations and not all companies calculate the measures in the same manner. As a result, the aforementioned measures, as presented, may not be directly comparable to similarly titled measures presented by other companies. Further information on (i) the Company s fuel hedging program, (ii) the requirements and accounting associated with accounting for derivative instruments, and (iii) the causes of hedge ineffectiveness and/or mark-to-market gains or losses from derivative instruments is included in the Company s Annual Report on Form 10-K for the fiscal year ended Dec. 31, 2011, as well as subsequent quarterly filings. In addition to its economic financial measures, as defined above, the Company has also provided other non-gaap financial measures as a result of items that the Company believes are not indicative of its ongoing operations. These include 1) a 2011 charge for an asset impairment related to the Company s decision not to equip its Classic ( /500) aircraft with Required Navigation Performance (RNP) capabilities; 2) 2010 and 2011 charges associated with the Company s acquisition and integration of AirTran; 3) a one-time third quarter 2009 charge associated with Freedom 09, an early retirement option offered to Employees; 4) a first quarter 2008 adjustment to the Company s income tax provision due to a change in Illinois state income tax laws; 5) a third quarter 2007 charge related to the Company s voluntary early-out program; and 6) a third quarter 2007 charge from a change in the Illinois state income tax law resulting in an increase in state income taxes, which increase was subsequently reversed in first quarter 2008 due to the reversal of the August 2007 state income tax law change. The Company believes that evaluation of its financial performance can be enhanced by a presentation of results that exclude the impact of these items in order to evaluate the results on a comparative basis with results in prior periods that do not include such items and as a basis for evaluating operating results in future periods. As a result of the Company s acquisition of AirTran, which closed on May 2, 2011, the Company has incurred and expects to continue to incur substantial charges associated with integration of the two companies. While the Company cannot predict the exact timing or amounts of such charges, it does expect to treat the charges as special items in its future presentation of non-gaap results. 1 Percentage of seats filled by fare-paying Passengers. 2 From the 2011 yearend U.S. Department of Transportation Air Travel Consumer Report issued February Top ranking is for Southwest Airlines only. AirTran ranked fifth in the same report. 3 As measured by the number of originating passengers boarded and based on data available from the U.S. Department of Transportation as of Sept. 30, See reconciliation of reported amounts to non-gaap financial measures. 5 Amounts shown net of profitsharing and taxes. See footnote 6 for explanation of profitsharing on acquisition and integration charges. 6 Amounts shown net of profitsharing on acquisition and integration charges incurred through March 31, Southwest Airlines amended the ProfitSharing Plan during second quarter 2011 to defer the profitsharing impact of acquisition and integration costs incurred from April 1, 2011, through Dec. 31, The profitsharing impact for this time period will be realized in 2014 and beyond. 7 Net income, as reported, divided by total operating revenues. 8 Amounts shown net of profitsharing impact. See footnote 6 for explanation of profitsharing impact relating to acquisition and integration charges. 9 Net adjustment related to presumption that all aircraft in fleet are owned. 10 Average invested capital represents a five quarter average of debt, net present value of aircraft leases, and equity. 11 Calculated as adjusted operating income, non-gaap, divided by adjusted average invested capital. 19


6 PERFORMANCE > 2011 PERFORMANCE > REVENUES Total operating revenues increased by $3.6 billion. We had a strong revenue Performance in Total operating revenues rose by $3.6 billion, or 29.4 percent, largely from the inclusion of AirTran s results beginning May 2, Excluding AirTran s results, operating revenues increased by $1.6 billion, or 12.8 percent, primarily due to a $1.5 billion increase in Passenger revenues resulting from a combination of strong Passenger yields 1 and record load factors. Consolidated freight revenues increased by $14 million, or 11.2 percent, mostly from higher average rates and better economic conditions than the prior year. Southwest Airlines products such as EarlyBird Check-In, Pets Are Welcome on Southwest (PAWS) service, and Unaccompanied Minors charges contributed to other revenues increasing $294 million in
7 PERFORMANCE > 2011 PERFORMANCE > REVENUES Low-Fare Brand At Southwest Airlines, we continue to be the only major U.S. airline that doesn t charge fees for first and second checked bags or for a Customer s change in flight plans. By maintaining our low-fare brand and superior Customer Service, Customers keep coming back to fly Southwest Airlines, contributing to our continued domestic market share growth and long-standing annual profitability streak. Our strategic initiatives helped grow our domestic market share to 25 percent in a four point increase over Southwest Airlines Customer Satisfaction remains the best in the business, as our Employees once again achieved the U.S. Department of Transportation s top ranking in Customer Satisfaction. 5 We were also ranked the top Airline Brand of the Year by the 2011 Harris Poll EquiTrend. Our most recent biennial brand monitoring survey revealed that our low-fare commitment, highlighted by our Bags Fly Free and No Change Fees policies, contributes to business and leisure travelers decisions to choose Southwest Airlines. Continued Revenue Growth Although our acquisition of AirTran contributed to our record operating revenue results in 2011, a number of revenue initiatives were also significant contributors: NETWORK OPTIMIZATION During 2011, we continued to optimize our flight schedules to better match demand. We began the process of aligning the Southwest Airlines and AirTran route networks, setting the stage for long-term growth. For example, during 2011, we determined that high jet fuel prices caused a number of AirTran routes to be unsustainable. In response, we made the tough decision to discontinue these flights and reallocate that capacity in 2012 to other markets with higher demand. We expect that optimizing the joint Southwest Airlines and AirTran networks will be a multi-year undertaking, but we believe these efforts will yield significant synergies and financial benefits. BUSINESS SELECT Our Business Select fare offering contributed approximately $94 million in revenues during 2011, up from $88 million in Business Select Passengers continue to enjoy perks such as priority boarding, bonus frequent flyer credit, priority ticket counter and security access in select airports, and a complimentary adult beverage. EARLYBIRD CHECK-IN Through this popular program, Customers pay $10 one-way to automatically receive an early boarding position before general checkin begins. EarlyBird Check-In produced revenues totaling $142 million in 2011, compared to $98 million in 2010 and surpassing our $100 million annual target. VOLARIS INTERNATIONAL CONNECT Southwest Airlines Customers are able to book international flights with connecting service by Volaris, Mexico s second largest airline. Southwest Airlines offers connecting service opportunities from more than 60 Southwest cities to different Volaris airports in Mexico including: Aguascalientes (AGU), Guadalajara (GDL), Mexico City (MEX), Mexico City-Toluca (TLC), Morelia (MLM), and Zacatecas (ZCL). All-New Rapid Rewards Our All-New Rapid Rewards frequent flyer program debuted March 1, Under the revamped program, Members earn points based on fares. Members can redeem their points for any available seat, any day, on every flight with absolutely no blackout dates or seat restrictions. Points won t expire as long as a Member has earning activity in a 24-month time period. Overall, Members have more flexibility and options for earning and redeeming their rewards than with the previous program. The new program also features enhanced A-List and Companion Pass opportunities for the most active Members and adds a new level of status, A-List Preferred. In 2011, the new program exceeded our expectations with respect to growth in program Members, credit card applications, flights by existing Members, and fares paid by Members. The cash sales from points sold to business partners during 2011 increased approximately $250 million compared to The vast majority of this revenue is initially deferred and then recognized as Passenger revenues when Members redeem their points and fly their trips. We forecasted the new program would drive hundreds of millions in incremental annual revenues, net of any associated program costs, by The progress made in 2011, alone, provides strong evidence that we are well on our way to meeting our goal. 1 Passenger revenues per revenue Passenger mile flown. 2 Includes revenues from southwest.com, swabiz.com (Southwest Airlines business travel reservation web page), and airtran.com. 3 Includes AirTran revenue sourced through online travel agencies. 4 As measured by the number of originating passengers boarded and based on data available from the U.S. Department of Transportation as of Sept. 30, From the 2011 yearend U.S. Department of Transportation Air Travel Consumer Report issued February Top ranking is for Southwest Airlines only. AirTran ranked fifth in the same report. 21

8 PERFORMANCE > 2011 PERFORMANCE > OPERATING COSTS Southwest Airlines is America s leading low-cost air carrier. Southwest Airlines has lower average unit costs, adjusted for average stage length, than virtually all major U.S. carriers. Southwest Airlines lowcost structure has allowed us to profitably charge low fares. We keep costs down through our all-boeing fleet; our efficient, point-to-point route structure; and our highly productive Employees. Excluding fuel and special items, G our cost per available seat mile (ASM) was 7.61 cents, G which was flat relative to As we integrate AirTran into the Southwest Family over the next several years and execute on our fleet modernization program, we believe we have opportunities to further reduce our operating costs. Cost Containment Operating expenses totaled $15.0 billion in 2011, an increase of $3.8 billion, or 34.6 percent, compared to The increase was primarily due to the inclusion of AirTran s 2011 operating expenses following the acquisition. Excluding AirTran s results, operating expenses increased by $1.9 billion, or 17.8 percent, compared to 2010, primarily due to the increase in economic fuel costs. With record-high and volatile fuel costs, we continue to focus on controlling costs. In 2011, we unveiled our fleet modernization plans that included firm orders for the more fuel-efficient Boeing and aircraft. Our revised order with Boeing also included 150 firm orders for the launch of the 737 MAX aircraft, with deliveries expected to begin in As the launch customer for the 737 MAX, we look forward to the benefits of operating what is expected to be the most cost-effective and fuel-efficient, single-aisle airplane. These new aircraft orders with Boeing will provide significant flexibility as we replace our older, less fuel-efficient Classic fleet. We also developed plans to retrofit our s with the lighter-weight Evolve interior, beginning March Overall, we expect our fleet modernization plans to reduce our aircraft unit costs once we complete the Evolve retrofit program and have approximately 100 of the aircraft in our fleet. Fuel Costs G Fuel and oil expense is our largest cost category. Our 2011 economic jet fuel cost averaged a record $3.19 per gallon, a 33.5 percent increase relative to Total economic fuel and oil expense was significantly higher than 2010 at approximately $5.6 billion, a 63.7 percent year-overyear increase. FUEL HEDGING We continue our efforts to conserve fuel. In addition, we strive to buy jet fuel at the lowest possible cost and to reduce volatility in operating expenses through our fuel hedging program. Since 2000, our fuel hedging program has reduced our economic fuel costs by $3.3 billion (net of program costs). REQUIRED NAVIGATION PERFORMANCE We re also working to limit fuel consumption through our innovative implementation of satellite-based Required Navigation Performance (RNP) operations, which generate a more precise, direct flight path. In January 2011, we began flying RNP approaches and completed 6,790 of these approaches throughout the year; however, for reasons outside Southwest Airlines control the total number of new RNP approaches has slowed. Because of the slowdown in the use of RNP, we decided not to equip our Boeing and aircraft with RNP capabilities. Changes in air traffic control by the U.S. Federal Aviation Administration still need to take place before we can realize the full potential for jet fuel conservation and emissions reduction from RNP procedures. 22

9 PERFORMANCE > 2011 PERFORMANCE > FINANCIAL POSITION Through the momentous changes in 2011, our balance sheet remains strong. Our financial position stayed strong in We finished the year with approximately $3.1 billion in unrestricted cash and short-term investments; an $800 million fully available revolving line of credit; an unencumbered asset net book value of approximately $6 billion; balance sheet leverage of approximately 47 percent, including aircraft lease obligations; and an investment grade credit rating. Net cash provided by operations for 2011 was $1.4 billion, and capital expenditures were $968 million, generating more than $400 million in free cash flow C. Net cash used in financing activities was $766 million and includes the repayment of $557 million in debt and capital lease obligations, the repurchase of approximately $225 million of Southwest Airlines outstanding common stock, and the repayment of $81 million to convertible note holders following the acquisition of AirTran. Future capital spending will be carefully monitored with a focus on generating free cash flow. C In 2012, we expect approximately $1.3 billion in capital spending, and we have approximately $560 million in debt repayments, including long-term debt maturities of $385 million paid in March We believe our strong financial position prepares us for the many threats facing the airline industry, including volatile energy prices, economic uncertainty, and vigorous competition. Please see our Investor Relations site at for our most current financial results and outlook. 23


10 PERFORMANCE > 2011 PERFORMANCE > AIRTRAN ACQUISITION We achieved $80 million in net pre-tax synergies in 2011 through our acquisition of AirTran. On May 2, 2011, Southwest Airlines closed on the acquisition of AirTran. Based on the average of Southwest Airlines closing prices for the 20 trading days ending three trading days prior to May 2, 2011, of $11.90, the transaction valued AirTran common stock at approximately $7.57 per share. At the time of purchase, AirTran had nearly 8,000 Employees operating a fleet of 140 Boeing and aircraft serving 69 destinations, including near-international destinations in Mexico and the Caribbean. With primarily hub-and-spoke service, as opposed to point-to-point, approximately half of AirTran s flights originate or terminate at its largest hub in Atlanta. AirTran offers a business class product and charges fees for checking bags and changing flights. We believe the AirTran acquisition supports our goal to achieve a 15 percent pre-tax return on invested capital and represents a unique opportunity for Southwest Airlines to take a significant step toward achieving our strategic goals over the next decade. We firmly believe that both AirTran and Southwest Airlines are stronger together and can accomplish more, faster than either could on its own. Integration Progress We have started the process of integrating AirTran into Southwest Airlines and estimate that it will take two to three years to fully transition AirTran and become one airline. Ultimately, it is our plan that our Customers will only see the Southwest Airlines low-fare brand with one set of policies, our single-class configuration, and combined reservation and ticketing systems, web sites, and frequent flyer programs. Our Southwest Airlines Customers are already experiencing some of the benefits of the AirTran acquisition, as we re able to offer more low-fare destinations, including Atlanta, the largest domestic market Southwest Airlines had previously not served. We are expanding our presence in slotcontrolled markets including New York LaGuardia; beginning service to Washington, D.C., via Ronald Reagan National Airport; and expanding our service in other key domestic markets, including Boston and Baltimore/Washington. Our acquisition of AirTran also provides access to near-international leisure markets in the Caribbean and Mexico. In 2011, we accomplished the following key integration milestones: We moved most of AirTran s headquarters functions to Southwest Airlines Headquarters in Dallas. We took initial steps toward integrating our frequent flyer programs. Southwest Airlines and AirTran Pilots overwhelmingly reached an agreement regarding seniority integration. We began optimizing AirTran s network and released the first coordinated Southwest Airlines and AirTran flight schedules. We merged maintenance facilities in Orlando and Baltimore/Washington. 24
11 PERFORMANCE > 2011 PERFORMANCE > AIRTRAN ACQUISITION The key integration milestones from the first quarter of 2012 include: Flight Attendants and Flight Instructors reached agreement regarding seniority integration. The first group of AirTran Employees officially joined the Southwest Family in January Southwest Airlines began service to Atlanta on Feb. 13, 2012, with an initial schedule of 15 flights to five nonstop destinations. We completed 20 of 31 shared city transitions as of March 2012, co-locating our operations side-by-side. We received our Single Operating Certificate on March 1, We incurred $134 million in pre-tax expenses associated with the acquisition and integration of AirTran during 2011, and we expect total acquisition and integration costs will be approximately $500 million upon completion of the integration. In 2011, $80 million in net pre-tax synergies were attributable to the AirTran acquisition. Upon full integration, we expect to generate approximately $400 million in annual net pre-tax synergies, excluding acquisition and integration costs. Next Steps Now that we have obtained our Single Operating Certificate from the Federal Aviation Administration, we have the green light to work toward full integration. AirTran will begin transferring aircraft to Southwest Airlines in the first half of 2012 to be converted to the Southwest Airlines livery and configuration, including our new Evolve cabin design. In cities served by both carriers, we will continue to in-source below-the-wing operations to Southwest Airlines Ramp personnel, harmonize our Passenger services vendors and our deicing programs, and merge our Maintenance facilities. In 2012, Seattle will be the first joint city to fully be converted to Southwest Airlines operations. We will further integrate the Southwest Airlines and AirTran frequent flyer programs to allow Customers of both Southwest Airlines and AirTran to book flights on either carrier using either southwest.com or airtran.com. Optimizing our joint network remains a priority. With persistently high fuel prices, we have made the difficult decision to close 15 of the smaller AirTran cities by August 2012 and redeploy available aircraft. Based on our joint schedules published through November 2012, we will serve 97 destinations in our combined networks. 25
2012 Performance. ,ċ ĂĊ. %* * % (ƫ +/%0%+*ƫ,ċƫăă. Our profits (excluding special items) of $417 million grew 26 percent as compared to 2011.
 of $417 million grew 26 percent as compared to 2011.") 212 Southwest Airlines One Report // Performance // 212 Performance Our Business Select offering contributed $93 million in Passenger revenues in 212. 212 Performance!2!*1!/ƫ,ċƫăĀ Our profits (excluding
212 Southwest Airlines One Report // Performance // 212 Performance Our Business Select offering contributed $93 million in Passenger revenues in 212. 212 Performance!2!*1!/ƫ,ċƫăĀ Our profits (excluding
MIRAMAR, Fla., April 29, 2015 (GLOBE NEWSWIRE) -- Spirit Airlines, Inc. (Nasdaq:SAVE) today reported first quarter 2015 financial results.
 -- Spirit Airlines, Inc. (Nasdaq:SAVE) today reported first quarter 2015 financial results.") April 29, 2015 Spirit Airlines Announces First Quarter 2015 Results; Adjusted Net Income Increases 87.1 Percent to $70.7 Million and Pre-Tax Margin Increases 900 Basis Points to 22.7 Percent MIRAMAR, Fla.,
April 29, 2015 Spirit Airlines Announces First Quarter 2015 Results; Adjusted Net Income Increases 87.1 Percent to $70.7 Million and Pre-Tax Margin Increases 900 Basis Points to 22.7 Percent MIRAMAR, Fla.,
Spirit Airlines Reports Highest Second Quarter Pre-Tax Margin in Company History
 July 24, 2013 Spirit Airlines Reports Highest Second Quarter Pre-Tax Margin in Company History MIRAMAR, Fla., July 24, 2013 (GLOBE NEWSWIRE) -- Spirit Airlines, Inc. (Nasdaq:SAVE) today reported second
Investor Relations Update January 25, 2018
 General Overview Investor Relations Update Accounting Changes On January 1, 2018, the company adopted two new Accounting Standard Updates: (ASUs): ASU 2014-9: Revenue from Contracts with Customers (the
INVESTOR PRESENTATION. Imperial Capital Global Opportunities Conference September 2015
 INVESTOR PRESENTATION Imperial Capital Global Opportunities Conference September 2015 Forward-looking Statements This presentation contains forward-looking statements within the meaning of the Private
INVESTOR PRESENTATION. May 2015
 INVESTOR PRESENTATION May 2015 Forward-looking Statements This presentation contains forward-looking statements within the meaning of the Private Securities Litigation Reform Act of 1995 that reflect the
OPERATING AND FINANCIAL HIGHLIGHTS. Subsequent Events
 Copa Holdings Reports Financial Results for the First Quarter of 2016 Excluding special items, adjusted net income came in at US$69.9 million, or EPS of US$1.66 per share Panama City, Panama --- May 5,
Spirit Airlines Reports First Quarter 2017 Results
 Spirit Airlines Reports First Quarter 2017 Results MIRAMAR, Fla., April 28, 2017 - Spirit Airlines, Inc. (NASDAQ: SAVE) today reported first quarter 2017 financial results. GAAP net income for the first
CONTACT: Investor Relations Corporate Communications
 NEWS RELEASE CONTACT: Investor Relations Corporate Communications 435.634.3200 435.634.3553 Investor.relations@skywest.com corporate.communications@skywest.com SkyWest, Inc. Announces Fourth Quarter 2017
OPERATING AND FINANCIAL HIGHLIGHTS SUBSEQUENT EVENTS
 Copa Holdings Reports Financial Results for the Third Quarter of 2016 Excluding special items, adjusted net income came in at $55.3 million, or adjusted EPS of $1.30 per share Panama City, Panama --- November
OPERATING AND FINANCIAL HIGHLIGHTS SUBSEQUENT EVENTS
 Copa Holdings Reports Net Income of US$6.2 Million and EPS of US$0.14 for the Third Quarter of 2015 Excluding special items, adjusted net income came in at $37.4 million, or EPS of $0.85 per share Panama
OPERATING AND FINANCIAL HIGHLIGHTS
 Copa Holdings Reports Net Income of US$18.6 Million and EPS of US$0.42 for the Second Quarter of 2010 Excluding special items, adjusted net income came in at $26.3 million, or $0.60 per share Panama City,
AIR CANADA REPORTS 2010 THIRD QUARTER RESULTS; Operating Income improved $259 million or 381 per cent from previous year s quarter
 AIR CANADA REPORTS 2010 THIRD QUARTER RESULTS; Operating Income improved $259 million or 381 per cent from previous year s quarter MONTRÉAL, November 4, 2010 Air Canada today reported operating income
Investor Relations Update October 25, 2018
 General Overview Investor Relations Update Revenue The company expects its fourth quarter total revenue per available seat mile (TRASM) to be up approximately 1.5 to 3.5 percent year-over-year. Fuel Based
Spirit Airlines Reports Fourth Quarter and Full Year 2016 Results
 Spirit Airlines Reports Fourth Quarter and Full Year 2016 Results MIRAMAR, FL. (February 7, 2017) - Spirit Airlines, Inc. (NASDAQ: SAVE) today reported fourth quarter and full year 2016 financial results.
Spirit Airlines Reports Third Quarter 2015 Pre-Tax Margin of 26.9 Percent
 October 27, 2015 Spirit Airlines Reports Third Quarter 2015 Pre-Tax Margin of 26.9 Percent MIRAMAR, Fla., Oct. 27, 2015 (GLOBE NEWSWIRE) -- Spirit Airlines, Inc. (NASDAQ:SAVE) today reported third quarter
Volaris Reports Strong First Quarter 2015: 32% Adjusted EBITDAR Margin, 9% Operating Margin
 Volaris Reports Strong First Quarter 2015: 32% Adjusted EBITDAR Margin, 9% Operating Margin Mexico City, Mexico, April 22, 2015 Volaris* (NYSE: VLRS and BMV: VOLAR), the ultra-low-cost airline serving
Copa Holdings Reports Net Income of $57.7 million and EPS of $1.36 for the Third Quarter of 2018
 Copa Holdings Reports Net Income of $57.7 million and EPS of $1.36 for the Third Quarter of 2018 November 14, 2018 PANAMA CITY, Nov. 14, 2018 /PRNewswire/ -- Copa Holdings, S.A. (NYSE: CPA), today announced
OPERATING AND FINANCIAL HIGHLIGHTS
 Copa Holdings Reports Financial Results for the Fourth Quarter of 2018 Excluding special items, adjusted net profit came in at $44.0 million, or Adjusted EPS of $1.04 Panama City, Panama --- February 13,
Copa Holdings Reports Net Income of $49.9 million and EPS of $1.18 for the Second Quarter of 2018
 Copa Holdings Reports Net Income of $49.9 million and EPS of $1.18 for the Second Quarter of 2018 Panama City, Panama --- Aug 8, 2018. Copa Holdings, S.A. (NYSE: CPA), today announced financial results
American Airlines Group Inc.
 American Airlines Group Inc. Deutsche Bank Leveraged Finance Conference October 4, 2017 Tom Weir Vice President, Treasurer Cautionary Statement Regarding Forward-Looking Statements and Information This
Thank you for participating in the financial results for fiscal 2014.
 Thank you for participating in the financial results for fiscal 2014. ANA HOLDINGS strongly believes that safety is the most important principle of our air transportation business. The expansion of slots
AIR CANADA REPORTS THIRD QUARTER RESULTS
 AIR CANADA REPORTS THIRD QUARTER RESULTS THIRD QUARTER OVERVIEW Operating income of $112 million compared to operating income of $351 million in the third quarter of 2007. Fuel expense increased 49 per
OPERATING AND FINANCIAL HIGHLIGHTS
 Copa Holdings Reports Financial Results for the Fourth Quarter of 2015 Excluding special items, adjusted net income came in at $31.7 million, or EPS of $0.73 per share Panama City, Panama --- February
AMR CORPORATION REPORTS SECOND QUARTER 2012 RESULTS
 CONTACT: Sean Collins Media Relations Fort Worth, Texas 817-967-1577 mediarelations@aa.com FOR RELEASE: Wednesday, REPORTS SECOND QUARTER 2012 RESULTS $6.5 Billion in Quarterly Revenue, Highest in Company
Copa Holdings Reports Record Earnings of US$41.8 Million for 4Q06 and US$134.2 Million for Full Year 2006
 Copa Holdings Reports Record Earnings of US$41.8 Million for 4Q06 and US$134.2 Million for Full Year 2006 Panama City, Panama --- March 7, 2007. Copa Holdings, S.A. (NYSE: CPA), parent company of Copa
Delta Air Lines Reports June 2009 Quarter Financial Results
 CONTACT: Investor Relations 404-715-2170 Corporate Communications 404-715-2554 Delta Air Lines Reports June 2009 Quarter Financial Results ATLANTA, July 22, 2009 Delta Air Lines (NYSE:DAL) today reported
OPERATING AND FINANCIAL HIGHLIGHTS
 Copa Holdings Reports Net Income of US$32.0 Million and EPS of US$0.72 for the Second Quarter of 2012 Excluding special items, adjusted net income came in at $58.6 million, or EPS of $1.32 per share Panama
OPERATING AND FINANCIAL HIGHLIGHTS. Subsequent Events
 Copa Holdings Reports Net Income of US$113.1 Million and EPS of US$2.57 for the First Quarter of 2015 Excluding special items, adjusted net income came in at US$106.0 million, or EPS of US$2.41 per share
OPERATING AND FINANCIAL HIGHLIGHTS. Subsequent Events
 Copa Holdings Reports Net Income of $103.8 million and EPS of $2.45 for the Third Quarter of 2017 Excluding special items, adjusted net income came in at $100.8 million, or EPS of $2.38 per share Panama
American Airlines Group Inc.
 American Airlines Group Inc. Bank of America Merrill Lynch 2018 Transportation Conference Derek Kerr Chief Financial Officer Cautionary Statement Regarding Forward-Looking Statements and Information This
WestJet announces 18th consecutive quarter of profitability Airline reports third quarter net earnings of $31.4 million
 FOR IMMEDIATE RELEASE WestJet announces 18th consecutive quarter of profitability Airline reports third quarter net earnings of $31.4 million CALGARY, ALBERTA. November 4, 2009. WestJet (TSX:WJA) today
Management Presentation. March 2016
 Management Presentation March 2016 Forward looking statements This presentation as well as oral statements made by officers or directors of Allegiant Travel Company, its advisors and affiliates (collectively
Copa Holdings Reports Net Income of US$51.9 Million for the Fourth Quarter of 2008 and US$152.2 Million for Full Year 2008
 Copa Holdings Reports Net Income of US$51.9 Million for the Fourth Quarter of 2008 and US$152.2 Million for Full Year 2008 Panama City, Panama --- February 19, 2009. Copa Holdings, S.A. (NYSE: CPA), parent
Spirit Airlines Reports Second Quarter 2018 Results
 Spirit Airlines Reports Second Quarter 2018 Results MIRAMAR, Fla., July 25, 2018 - Spirit Airlines, Inc. (NYSE: SAVE) today reported second quarter 2018 financial results. GAAP net income for the second
American Airlines Group Reports Second-Quarter Profit
 NEWS RELEASE American Airlines Group Reports Second-Quarter Profit 7/28/2017 FORT WORTH, Texas American Airlines Group Inc. (NASDAQ:AAL) today reported its second-quarter 2017 results, including these
Copa Holdings Reports Net Income of $136.5 million and EPS of $3.22 for the First Quarter of 2018
 Copa Holdings Reports Net Income of $136.5 million and EPS of $3.22 for the First Quarter of 2018 May 9, 2018 PANAMA CITY, May 9, 2018 /PRNewswire/ -- Copa Holdings, S.A. (NYSE: CPA), today announced financial
E190 REPLACEMENT & FLEET UPDATE JULY 11, 2018
 1 E190 REPLACEMENT & FLEET UPDATE JULY 11, 2018 SAFE HARBOR This presentation contains forward-looking statements within the meaning of the Private Securities Litigation Reform Act of 1995, Section 27A
CONTACT: Investor Relations Corporate Communications
 NEWS RELEASE CONTACT: Investor Relations Corporate Communications 435.634.3200 435.634.3553 Investor.relations@skywest.com corporate.communications@skywest.com SkyWest, Inc. Announces Second Quarter 2016
Investor Update September 2017 PARTNER OF CHOICE EMPLOYER OF CHOICE INVESTMENT OF CHOICE
 Investor Update September 2017 PARTNER OF CHOICE EMPLOYER OF CHOICE INVESTMENT OF CHOICE 1 Forward Looking Statements In addition to historical information, this presentation contains forward-looking statements
STAYING TRUE. BofAML Global Transportation Conference. May
 STAYING TRUE BofAML Global Transportation Conference May 19 2011 FORWARD-LOOKING STATEMENT Certain information in this presentation and statements made during this presentation, including any question
Copa Holdings Reports Earnings of US$30.3 Million and EPS of US$0.70 for 3Q08
 Copa Holdings Reports Earnings of US$30.3 Million and EPS of US$0.70 for 3Q08 Panama City, Panama --- November 13, 2008. Copa Holdings, S.A. (NYSE: CPA), parent company of Copa Airlines and Aero Republica,
Media Release. Qantas Group Full Year 2017 Financial Result 1. Sydney, 25 August 2017
 Media Release Qantas Group Full Year 2017 Financial Result 1 Sydney, 25 August 2017 Underlying Profit Before Tax: $1,401 million (second highest in Qantas history) Statutory Profit Before Tax: $1,181 million
Adjusted net income of $115 million versus an adjusted net loss of $7 million in the second quarter of 2012, an improvement of $122 million
 Air Canada Reports Record Second Quarter 2013 Results Highest Adjusted Net Income, Operating Income and EBITDAR Results for Second Quarter in Air Canada s History Adjusted net income of $115 million versus
Bank of America Merrill Lynch Global Transportation Conference. June 16, 2010
 Bank of America Merrill Lynch Global Transportation Conference June 16, 2010 FORWARD-LOOKING STATEMENT Certain information in this presentation and statements made during this presentation, including any
El Al Israel Airlines announced today its financial results for the year 2016 and the fourth quarter of the year:
 El Al Israel Airlines announced today its financial results for the year 2016 and the fourth quarter of the year: The Company's revenues in 2016 amounted to approx. USD 2,038 million, compared to approx.
44th Consecutive Profitable Quarter Fourth Quarter Fully Diluted Earnings per Share of $0.94 Full Year Fully Diluted Earnings per Share of $4.
 Allegiant Travel Company Fourth Quarter and Full Year 2013 Financial Results January 29, 2014 1:00 PM PT 44th Consecutive Profitable Quarter Fourth Quarter Fully Diluted Earnings per Share of $0.94 Full
Copa Holdings Reports Fourth Quarter and Full Year 2007 Results
 Copa Holdings Reports Fourth Quarter and Full Year 2007 Results Panama City, Panama --- February 21, 2008. Copa Holdings, S.A. (NYSE: CPA), parent company of Copa Airlines and Aero Republica, today announced
1Q 2017 Earnings Call. April 18, 2017
 1Q 2017 Earnings Call April 18, 2017 Safe Harbor Statement Certain statements included in this presentation are forward-looking and thus reflect our current expectations and beliefs with respect to certain
CONTACT: Investor Relations Corporate Communications
 NEWS RELEASE CONTACT: Investor Relations Corporate Communications 435.634.3200 435.634.3553 Investor.relations@skywest.com corporate.communications@skywest.com SkyWest, Inc. Announces Second Quarter 2017
Spirit Airlines Reports Third Quarter 2017 Results
 Spirit Airlines Reports Third Quarter 2017 Results MIRAMAR, Fla., October 26, 2017 - Spirit Airlines, Inc. (NASDAQ: SAVE) today reported third quarter 2017 financial results. GAAP net income for the third
Spirit Airlines Reports First Quarter 2018 Results
 Spirit Airlines Reports First Quarter 2018 Results MIRAMAR, Fla., April 26, 2018 - Spirit Airlines, Inc. (NYSE: SAVE) today reported first quarter 2018 financial results. For the first quarter 2018, Spirit
PERFORMANCE 2010 SOUTHWEST AIRLINES ONE REPORT
 PERFORMANCE Our Performance in 2010 marked our 38th consecutive year of profitability a feat unmatched in U.S. aviation history. We experienced industry-leading revenue growth, record load factors, and
Stifel 2017 Transportation & Logistics Conference Tammy Romo, EVP and CFO
 Stifel 2017 Transportation & Logistics Conference Tammy Romo, EVP and CFO Cautionary Statement Regarding Forward-Looking Statements This presentation contains forward-looking statements within the meaning
2018 Annual Meeting of Stockholders
 2018 Annual Meeting of Stockholders Playing the Long Game June 13, 2018 Doug Parker Chairman and Chief Executive Officer American Airlines Group Inc. Cautionary Statement Regarding Forward-Looking Statements
Investor Update Issue Date: April 9, 2018
 Investor Update Issue Date: April 9, 2018 This investor update provides guidance and certain forward-looking statements about United Continental Holdings, Inc. (the Company or UAL ). The information in
SkyWest, Inc. Announces First Quarter 2018 Profit
 NEWS RELEASE CONTACT: Investor Relations Corporate Communications 435.634.3200 435.634.3553 Investor.relations@skywest.com corporate.communications@skywest.com SkyWest, Inc. Announces First Quarter 2018
Southwest Airlines (LUV) Analyst: Rebekah Zsiga Fall Recommendation: BUY Target Price until (12/31/2016): $62
 Analyst: Rebekah Zsiga Fall Recommendation: BUY Target Price until (12/31/2016): $62") Recommendation: BUY Target Price until (12/31/2016): $62 1. Reasons for the Recommendation After detailed analysis of Southwest Airlines Company I recommend that we move to buy further shares of stock
Recommendation: BUY Target Price until (12/31/2016): $62 1. Reasons for the Recommendation After detailed analysis of Southwest Airlines Company I recommend that we move to buy further shares of stock
Copa Holdings Reports Net Income of US$113.9 Million for the Fourth Quarter of 2013
 Copa Holdings Reports Net Income of US$113.9 Million for the Fourth Quarter of 2013 Panama City, Panama --- February 12, 2014. Copa Holdings, S.A. (NYSE: CPA), today announced financial results for the
2010 ANNUAL GENERAL MEETING. May 4, 2010
 2010 ANNUAL GENERAL MEETING May 4, 2010 FORWARD-LOOKING STATEMENT Certain information in this presentation and statements made during this presentation, including any question and answer session, may contain
UNITED STATES SECURITIES AND EXCHANGE COMMISSION Washington, D.C FORM 8-K CURRENT REPORT
 UNITED STATES SECURITIES AND EXCHANGE COMMISSION Washington, D.C. 20549 FORM 8-K CURRENT REPORT Pursuant to Section 13 or 15(d) of The Securities Exchange Act of 1934 Date of Report (Date of earliest event
Citi Industrials Conference
 Citi Industrials Conference June 13, 2017 Andrew Levy Executive Vice President and Chief Financial Officer Safe Harbor Statement Certain statements included in this presentation are forward-looking and
Gerry Laderman SVP Finance, Procurement and Treasurer
 Gerry Laderman SVP Finance, Procurement and Treasurer Safe Harbor Statement Certain statements included in this release are forward-looking and thus reflect our current expectations and beliefs with respect
FORWARD-LOOKING STATEMENT
 CIBC 9th Annual Eastern Institutional Investor Conference September 23, 21 FORWARDLOOKING STATEMENT Certain information in this presentation and statements made during this presentation, including any
Scotia Capital Transportation & Aerospace Conference. June 5, 2007
 Scotia Capital Transportation & Aerospace Conference June 5, 2007 1 2 Changing the Game Changing the Game Canada s #1 domestic, trans-border and international airline Strong brand recognition Innovative
AIR CANADA REPORTS SECOND QUARTER RESULTS
 AIR CANADA REPORTS SECOND QUARTER RESULTS SECOND QUARTER OVERVIEW Passenger revenue increased 5 per cent to $2.5 billion, due to growth in traffic and yield. Excluding fuel expense, unit cost declined
1Q 2018 Earnings Call. April 18, 2018
 1Q 2018 Earnings Call April 18, 2018 Safe Harbor Statement Certain statements included in this presentation are forward-looking and thus reflect our current expectations and beliefs with respect to certain
UAL Corporation Reports Second Quarter 2010 Results. $430 Million 2Q Net Profit Excluding Charges, Largest Since 1999
 News Release Worldwide Press Office: media.relations@united.com UAL Corporation Reports Second Quarter 2010 Results $430 Million 2Q Net Profit Excluding Charges, Largest Since 1999 $273 Million 2Q10 GAAP
Management Presentation. November 2018
 Management Presentation November 2018 Forward looking statements This presentation as well as oral statements made by officers or directors of Allegiant Travel Company, its advisors and affiliates (collectively
Delta Air Lines Announces December Quarter Profit
 CONTACT: Investor Relations 404-715-2170 Corporate Communications 404-715-2554, media@delta.com Delta Air Lines Announces December Quarter Profit ATLANTA, Jan. 22, 2013 Delta Air Lines (NYSE:DAL) today
ABX. Holdings, Inc. BB&T Transportation Conference. February 2008
 ABX Holdings, Inc. BB&T Transportation Conference February 2008 1 Safe Harbor Statement Except for historical information contained herein, the matters discussed in this presentation contain forward-looking
AIR CANADA REPORTS 2010 FIRST QUARTER RESULTS Operating loss narrows; revenue and traffic growth reflect strengthening economy
 AIR CANADA REPORTS 2010 FIRST QUARTER RESULTS Operating loss narrows; revenue and traffic growth reflect strengthening economy MONTRÉAL, May 6, 2010 Air Canada today reported a reduced operating loss of
Air China Limited Announces 2009 Annual Results
 Air China Limited Announces 2009 Annual Results Record Operating Profit in Complex Market Environment Strengthened Position to Capture Growth Opportunities Hong Kong April 22, 2010 Air China Limited (
QANTAS HALF YEAR 2015 FINANCIAL RESULTS 1
 QANTAS HALF YEAR 2015 FINANCIAL RESULTS 1 Key points: Underlying Profit Before Tax: $367 million Statutory Profit After Tax: $206 million Transformation benefits: $374 million Comparable unit cost reduction:
STAYING TRUE. Scotia Capital Transportation & Aerospace Conference. November 15, 2011
 STAYING TRUE Scotia Capital Transportation & Aerospace Conference November 15, 2011 FORWARD-LOOKING STATEMENT Certain information in this presentation and statements made during this presentation, including
For personal use only
 ASX and Media Release QANTAS DELIVERS RECORD FIRST HALF PROFIT, INVESTS IN AIRCRAFT AND TRAINING Sydney, 22 February 2018 Underlying Profit Before Tax: $976 million (up 15%) Record results for Qantas Domestic,
2003/04 Full Year Results Presentation to Investors
 2003/04 Full Year Results Presentation to Investors 19 August 2004 Geoff Dixon Chief Executive Officer Highlights 12 months to June 2004 12 months to June 2003 Increase/ (decrease) % Sales and operating
American Airlines Group Inc.
 American Airlines Group Inc. 2019 J.P. Morgan Global High Yield & Leveraged Finance Conference Tom Weir Vice President and Treasurer February 26, 2019 Cautionary Statement Regarding Forward-Looking Statements
Management Presentation. May 2013
 Management Presentation May 2013 Forward looking statements This presentation as well as oral statements made by officers or directors of Allegiant Travel Company, its advisors and affiliates (collectively
Delta Air Lines Announces First Quarter Results
 FOR IMMEDIATE DISTRIBUTION CONTACT: Investor Relations 404-715-2170 Corporate Communications 404-715-2554, media@delta.com news archive at news.delta.com Delta Air Lines Announces First Quarter Results
Fourth Quarter 2015 Financial Results
 Fourth Quarter 2015 Financial Results AerCap Holdings N.V. February 23, 2016 Disclaimer Incl. Forward Looking Statements & Safe Harbor This presentation contains certain statements, estimates and forecasts
Investor Update: October 25, 2016
 Investor Update: October 25, 2016 This investor update provides JetBlue s investor guidance for the fourth quarter ending December 31, 2016 and full year 2016. Recent Announcements JetBlue has recently
SKYWEST, INC. ANNOUNCES THIRD QUARTER 2014 RESULTS
 NEWS RELEASE For Further Information Contact: Investor Relations Telephone: (435) 634-3203 Fax: (435) 634-3205 FOR IMMEDIATE RELEASE: October 29, 2014 SKYWEST, INC. ANNOUNCES THIRD QUARTER 2014 RESULTS
AIR CANADA REPORTS FIRST QUARTER RESULTS
 AIR CANADA REPORTS FIRST QUARTER RESULTS As a result of the deconsolidation of Jazz effective May 24, 2007, Air Canada s consolidated results for the first quarter of 2008 are not directly comparable to
Delta Air Lines Announces September Quarter Profit
 Page 1 FOR IMMEDIATE DISTRIBUTION CONTACT: Investor Relations 404-715-2170 Corporate Communications 404-715-2554, media@delta.com news archive at news.delta.com Delta Air Lines Announces September Quarter
Q4 Fiscal 2017 Statistics
 Q4 Fiscal 2017 Statistics FedEx Corporation Financial and Operating Statistics Fourth Quarter Fiscal 2017 July 17, 2017 This report is a statistical supplement to FedEx s interim financial reports and
AMR CORPORATION REPORTS THIRD QUARTER 2011 RESULTS. Net Loss of $162 Million; Operating Earnings of $39 Million
 CONTACT: Sean Collins Corporate Communications Fort Worth, Texas 817-967-1577 mediarelations@aa.com FOR RELEASE: Wednesday, REPORTS THIRD QUARTER 2011 RESULTS Net Loss of $162 Million; Operating Earnings
Q1 Fiscal 2018 Statistics
 Q1 Fiscal 2018 Statistics FedEx Corporation Financial and Operating Statistics First Quarter Fiscal 2018 September 19, 2017 This report is a statistical supplement to FedEx s interim financial reports
AIR CANADA REPORTS FULL YEAR AND FOURTH QUARTER 2010 RESULTS
 AIR CANADA REPORTS FULL YEAR AND FOURTH QUARTER 2010 RESULTS Record annual EBITDAR of $1.386 billion, 104 per cent improvement Operating income improvement of $677 million Employees to receive special
Q3 Fiscal 2017 Statistics
 Q3 Fiscal 2017 Statistics FedEx Corporation Financial and Operating Statistics Third Quarter Fiscal 2017 February 28, 2017 This report is a statistical supplement to FedEx s interim financial reports and
CREDIT SUISSE GLOBAL INDUSTRIALS CONFERENCE DECEMBER 4, 2014
 CREDIT SUISSE GLOBAL INDUSTRIALS CONFERENCE DECEMBER 4, 2014 1 1 SAFE HARBOR This presentation contains statements of a forward-looking nature which represent our management's beliefs and assumptions concerning
Air China Limited Announces 2010 Interim Results
 Air China Limited Announces 2010 Interim Results Record High First Half Results Leveraging New Opportunities to Drive Growth Hong Kong August 25, 2010 Air China Limited ( Air China or the Company, together
Joshua Koshy, Executive Vice President & CFO. Changing the Game
 Joshua Koshy, Executive Vice President & CFO Changing the Game Changing the Game Canada s #1 domestic, trans-border and international airline Strong brand recognition Innovative revenue model driving customer
Delta Announces June Quarter Financial Results
 CONTACT: Investor Relations 404-715-2170 Corporate Communications 404-715-2554, media@delta.com Delta Announces June Quarter Financial Results ATLANTA, July 25, 2012 Delta Air Lines (NYSE:DAL) today reported
Southwest Airlines Co. (NYSE: LUV) ONE YEAR PRICE RANGE : $ $73.62 LAST PRICE: $ ANALYST RATING: Long. VALUATION DATE: July 13, 2017
 ONE YEAR PRICE RANGE : $ $73.62 LAST PRICE: $ ANALYST RATING: Long. VALUATION DATE: July 13, 2017") Southwest Airlines Co. (NYSE: LUV) ONE YEAR PRICE RANGE : $69.66 - $73.62 LAST PRICE: $62.08 ANALYST RATING: Long VALUATION DATE: July 13, 2017 NEXT EARNINGS DATE: July 27, 2017 Investment Thesis: Dominant
Southwest Airlines Co. (NYSE: LUV) ONE YEAR PRICE RANGE : $69.66 - $73.62 LAST PRICE: $62.08 ANALYST RATING: Long VALUATION DATE: July 13, 2017 NEXT EARNINGS DATE: July 27, 2017 Investment Thesis: Dominant
2007/08 Full Year Results Investor Briefing
 2007/08 Full Year Results Investor Briefing Highlights of Result Profit before tax up 46% to $1,408 million Up 36% on the reported result Margin improvement $3 billion of Sustainable Future Benefits achieved
Investor Update April 23, 2009
 JetBlue Airways Investor Relations (718) 709-2202 ir@jetblue.com Investor Update April 23, 2009 This investor update provides our investor guidance for the second quarter ending June 30, 2009 and full
2Q 2017 Earnings Call. July 19, 2017
 2Q 2017 Earnings Call July 19, 2017 Safe Harbor Statement Certain statements included in this presentation are forward-looking and thus reflect our current expectations and beliefs with respect to certain
AIR CANADA REPORTS IMPROVED FOURTH QUARTER 2006 AND FULL YEAR 2006 RESULTS
 AIR CANADA REPORTS IMPROVED FOURTH QUARTER 2006 AND FULL YEAR 2006 RESULTS In accordance with Canadian GAAP Accounting Guideline No. 15 Air Canada is required to consolidate the financial statements of
El Al Israel Airlines announced today its financial results for the second quarter and the first half of 2017.
 August 16, 2017 El Al Israel Airlines announced today its financial results for the second quarter and the first half of 2017. The Company's revenues in the second quarter of 2017 amounted to approx. USD