The impact of airports competition and local governments on the efficiency of Italian airports
|
|
|
- Kenneth Quinn
- 6 years ago
- Views:
Transcription
1 The impact of airports competition and local governments on the efficiency of Italian airports Paolo Malighetti, Gianmaria Martini, Davide Scotti 1, Nicola Volta Department of Economics and Technology Management University of Bergamo, Italy January, 2010 Abstract The aim of this paper is to investigate how the impact of airports competition and the influence of local governments affects the efficiency of Italian airports. We develop a model for measuring the competition between airports which is based on estimating the potential demand for each airport. We investigate a dataset composed by 38 airports, for which inputs and outputs have been collected, over the period Efficiency is estimated using a stochastic frontier model with time dependent inefficiency components. We find that the more intense is the airport s competition the lower is its efficiency. Short run rigidities in managing assets may provide an explanation for this evidence. Furthermore, we find that the higher the presence of local governments in airports ownership the greater is the efficiency. This may be due to the impact of local subsidies to influence the airlines network choice. JEL classification: L930, L590, L110 Keywords: Airport efficiency, stochastic frontier, airport competition, local governments. 1 Correspondence to: D. Scotti, University of Bergamo, Viale Marconi 5, DALMINE (BG), Italy, davide.scotti@unibg.it. The authors are grateful to Kenneth Button for the helpful comments in developing this project.
2 1 Introduction European air transportation sector has shown a strong growth during the last decade. In this context the Italian market is one of the most dynamic, where liberalization has induced the entrance of with new airlines (especially low costs carriers) which have exploited the financial and managerial difficulties of the former flag carrier, i.e. Alitalia. Furthermore several changes have been introduced in the Italian market, concerning both the regulatory structure and the privatization process. On the regulatory hand, since 2000, an attempt to introduce a price cap regulation for airports has been done. Concerning privatization, several Italian airports are now managed independently from central government. However only a small percentage of airports can be considered fully private. In fact, most of the airports are under the control of local governments (e.g. municipalities or Regional Governments). The aim of this paper is to estimate how the process of progressive liberalization and privatization have influenced airports technical efficiency. In particular it is estimated the effect of the competition between airports belonging at the same catchment area, in order to understand if airports under competitive pressure result more or less efficient with respect to the others. Furthermore, it is interesting to examine if airports performance are somehow affected by the presence of local governments in the ownership structure. Our last goal is to evaluate the impact of Alitalia on airports efficiency, in consideration of its former dominance in the main Italian airports of its recent downsizing due to poor market performances. We develop a model for measuring the competition between airports which is based on estimating the potential demand for each airport. We investigate a dataset composed by 38 airports, for which inputs and outputs have been collected, over the period Efficiency is estimated using a stochastic frontier model with time dependent inefficiency components. We find that the more intense is the airport s competition the lower is its efficiency. Short run rigidities in managing assets may provide an explanation for this evidence. Furthermore, we find that the higher the presence of local 1
3 governments in airports ownership the greater is the efficiency. This may be due to the impact of local subsidies to influence the airlines network choice. Last we provide some evidence regarding the impact of the Italian dominant carrier, i.e. Alitalia, on airports efficiency. We observe a negative relation, i.e. the former national flag airline has used its first mover advantage to limit the efficient utilization of airports assets. This paper proceeds as follows. In Section 2 we provide a brief review of the literature on airport efficiency analysis. Subsequently, in Section 3, we present the SFA model adopted and the competition index created. Our estimated results about the technical efficiency frontier are reported in Section 4, while concluding comments are highlighted in Section 5. 2 Literature review Previous studies on airport efficiency and productivity (see Table 1 for a summary) can be classified according to some critical parameters: (1) the estimation method that was applied; (2) the choice of output and input variables to be used in the efficiency analysis; (3) the geographical scope. [TABLE 1 ABOUT HERE] As far as the estimation method is concerned, there are two fundamental groups, one using Stochastic Frontier Analysis (SFA), that is a parametric method, and the other using Data Envelopment Analysis (DEA), that is a non-parametric method. The most common approach is DEA. Since DEA is an extreme point technique, noise such as measurement error can cause significant problems; at the same time, statistical issues as inference and hypothesis testing are difficult. However they are actually possible even if, for general case with p inputs and q outputs, bootstrap methods remain the only useful approach for inference (Simar and Wilson, 2007). Otherwise SFA is able to manage random shocks and measurement errors and it can be used to conduct conventional test of hypotheses; moreover it allows easily the utilization of panel 2
4 data and the incorporation of exogenous variables, which are neither inputs to the production process nor output of it, but which nonetheless exert an influence on producer s performance (Kumbhakar and Lovell, 2000). However, SFA presents some disadvantages connected with the need to specify (potentially erroneous) functional relationship between inputs and outputs and distributional assumptions for the one-side error term associated with technical efficiency. Concerning the variables considered by different researchers, both parametric and non-parametric studies are very various, but the most common outputs are definitely those related to passengers, aircraft movements and cargo. Monetary outputs are also used in performance studies. Furthermore some recent studies consider undesirable outputs such as delays (e.g. Pathomsiri et al. 2008) or aircraft noise (e.g. Yu 2004; Yu et al. 2008). On the input side, there are two common approaches: some studies consider factors such as capital, capital stock, labour and other operational costs and others consider physical infrastructure such as airport surface, runways, terminal building area, aircraft parking positions, check-in desks, boarding gates and baggage claims. Looking carefully at the studies in which DEA was applied, different common approaches should be noted related to (1) the Returns to Scale (RTS), (2) the choice of the orientation and (3) the metrics used to measure the distance to the efficient frontier. In fact there is no consensus on the use of Constant Returns to Scale (CRS) rather than Variable Returns to Scale (VRS). As far as the orientation is concerned, some studies use an input orientation, others an output orientation and the rest a mixed orientation. Finally the two metrics commonly used to measure the distance to the efficient frontier are the Farrell efficiency measure and the directional distance function. However in a recent contribution Lozano and Gutierrez (2009) applied a VRS, non-radial DEA model to compute the Russell measure of Spanish airports technical efficiency. Furthermore some studies often use different extensions of the DEA model (as cross efficiency and super efficiency 3
5 models) in order to better discriminate among efficient units. Other studies, however, use panel data and compute total factor productivity using either Malmquist productivity indexes or Luenberger productivity indicators. The studies that deal with the estimation of a parametric frontier function are much less common in the literature regarding airports efficiency. The main aspect that differentiates them is the estimation of a production function rather than a cost function. Concerning this, the estimation of a production function deals mainly with the concept of technical efficiency, whereas the estimation of a cost function refers to a concept of cost efficiency. However several further differences should be noted between the estimation of technical and cost efficiency. Firstly the estimation of technical efficiency requires information on input use and output provision, whereas the estimation of cost efficiency requires information on input prices, output quantities and total expenditure. Furthermore the estimation of a stochastic production frontier, unlike the cost frontier, provides an output oriented efficiency measurement and so no distinction is usually made between variable inputs and quasi-fixed inputs (Kumbhakar and Lovell, 2000). Finally technical efficiency cannot be decomposed, whereas cost efficiency has two potential sources: technical efficiency and allocative efficiency. Note that most of the studies about technical efficiency and production function ignore the multi output nature of airport activity: the first recent attempts at using a stochastic distance function to measure airports technical efficiency considering multiple outputs were done by Chow and Fung (2009) and Martín-Cejas and Tovar (2009). Another interesting aspect is the approach to inference by which the estimation of the stochastic frontier model is done: the two alternatives are maximum likelihood estimation, that is the most common technique, and the more recent Bayesian approach applied in the estimation of a cost frontier by Oum et al. (2008) and Martín et al. (2009). In term of geographical scope the literature regarding efficiency studies is very heterogeneous. Most of the contributions concern a single country (US, but also Brazil, Taiwan, Japan, Australia, Italy, Portugal, Spain and UK). 4
6 There are also some studies at a European level and a few that benchmark airports from different countries. Anyway only few contributions have focused on Italian airports. In particular Barros and Dieke (2007) and Malighetti et al. (2007) performed an analysis by a DEA model and found different results: Italian airports resulted efficient for the most part in the first study and inefficient in the second one. Barros and Peypoch (2008) stated that some Italian and Portuguese airports are efficient, but there is room for improvement in the management of some Italian and almost all Portuguese airports. Barros and Dike (2008) and Curi et al. (2009) applied a two-stage procedure in order to estimate the efficiency determinants of Italian airports bootstrapping the DEA scores with a truncated regression as in Simar and Wilson (2007). The second analysis indicated that airports with a majority public holding are on average more efficient and that the presence of two hubs is source of inefficiency. However none of the existing studies on Italian airports apply the SFA model in order to measure Italian airports technical efficiency, which is the main aim of this study. This contribution differs from the previous ones also because it is based on data regarding physical inputs and not on monetary input/output (as in Barros and Dieke, 2007,2008 and Curi et al., 2009) and it covers a longer, more comprehensive and more recent dataset. Furthermore we intend to explain the obtained inefficiency scores by a set of novel variables in order to investigate the impact of airports competition, airlines dominance and local public ownership on airports efficiency. 3 Methodology 3.1 The distance function model for multi output stochastic frontier In this study we use an output oriented distance function estimated by a SFA. The first step is the definition of the production technology of the airport 5
7 using the output set P (x), that represents the output vectors y R+ M can be obtained using the input vector x R+ K. That is that P (x) = {y R M + : x can produce y} (1) Then we assume that the technology satisfies the axioms listed in Fare et al. and we introduce the Shepard (1970) distance function whose definition is D O (x, y) = min{θ : (y/θ) P (x)} (2) As noted in Lovell et al.(1994) the distance function is nondecreasing, positively linearly homogeneous and convex in y and decreasing in x. D O (x, y) is less or equal to one if y P (x) : the value of unity means that y is located on the outer boundary of the production possibility set. So D O (x, y) = 1 if y IsoqP (x) = {y : y P (x), ωy P (x), ω > 1}. In this study we specify a translog functional form for the distance function because this form is (1) flexible, (2) easy to calculate and (3) allows the imposition of homogeneity. 2 The translog distance function for the case of M outputs and K inputs is specified as lnd Oit = α 0 + M m=1 α m ln y mit + M m=1 Mn=1 α mn ln y mit ln y nit + K k=1 β k ln x kit + K k=1 Kl=1 β kl ln x kit ln x lit + K k=1 Mm=1 ζ km ln x kit ln y mit (3) i = 1, 2,..., N t = 1, 2,..., T Where i represents the ith airport and t represents the tth period in our sample. Note that in order to obtain the frontier surface one would set D i = 1, which implies the left hand of Equation 3 is equal to zero (Coelli 2 The choice of a Cobb - Douglas form is not satisfactory with respect to the first point because of its elasticity of substitution and scale properties. Furthermore Klein (1953) underlines that the Cobb - Douglas form is not an acceptable model of a firm in a purely competitive industry because it is not concave in the output dimensions. 6
8 and Perelman, 2000). The restrictions required for homogeneity of degree + 1 in outputs are and M α m = 1 (4) m=1 and M α mn = 0 m = 1, 2,..., M (5) n=1 M ζ km = 0 k = 1, 2,..., K (6) m=1 and those required for symmetry are and α mn = α nm m, n = 1, 2,..., M (7) β kl = β lk k, l = 1, 2,..., K (8) The homogeneity condition upon Equation 3 implies that D O (x, ωy) = ωd O (x, y) (9) Hence if you choose arbitrarily one of the outputs (for example the Mth output), you can set ω = 1/yM and obtain So the translog form of our function becomes D O (x, y/y M ) = ωd O (x, y)/y M (10) 7
9 ln(d Oit /y Mit ) = α 0 + M m=1 α m ln y mit + M m=1 Mn=1 α mn ln y mit lny nit + K k=1 β k ln x kit + K k=1 Kl=1 β kl ln x kit ln x lit + K k=1 Mm=1 ζ km ln x kit lny mit i = 1, 2,..., N t = 1, 2,..., T where ymit = y mit /y Mit. Equation 11 can be rewritten as (11) ln(d Oit /y Mit ) = T L(x it, y it /y Mit, α, β, ζ) i = 1, 2,..., N t = 1, 2,..., T (12) So ln(d Oit ) ln(y Mit ) = T L(x it, y it /y Mit, α, β, ζ) Hence i = 1, 2,..., N t = 1, 2,..., T (13) ln(y Mit ) = T L(x it, y it /y Mit, α, β, ζ) ln(d Oit ) i = 1, 2,..., N t = 1, 2,..., T (14) In Equation 14, the ln(d Oit ) is non observable and can be interpreted as an error term. Then we replace the ln(d Oit ) with a term (v it u it ) which represent a composed error term: v it are random variables which are assumed to be iid, N(0, σv) 2 and independent of the u it ; u it are assumed to be independently distributed as truncations at zero of the N(m it, σu) 2 distribution and represent technical inefficiency. Hence we can estimate Equation 14 by maximum likelihood following the stochastic frontier approach as in Aigner et al (1977). So following Coelli and Perelman (1999) we obtain ln(y Mit ) = T L(x it, y it /y Mit, α, β, ζ) + v it u it i = 1, 2,..., N t = 1, 2,..., T (15) 8
10 Therefore, we estimate the following stochastic trans logarithmic input distance function ln(y Mit ) = α 0 + M m=1 α m ln y mit + M m=1 Mn=1 α mn ln y mit ln y nit + K k=1 β k ln x kit + K k=1 Kl=1 β kl ln x kit ln x lit + K k=1 Mm=1 ζ km ln x kit ln y mit + v it u it (16) Furthermore, in order to investigate the determinants of inefficiency, we apply a single stage estimation procedure following Coelli (1996). This issue was addressed by Kumbhakar et al (1991) and Reifschneider and Stevenson (1991) who propose stochastic frontier models in which the inefficiency effects are expressed as an explicit function of a vector of firm specific variables and a random error. Battese and Coelli (1995) propose a model which is equivalent to the Kumbhakar et al(1991) specification, with the exceptions that allocative efficiency is imposed, the first-order profit maximizing conditions removed, and panel data is permitted. According to this model we apply the method of maximum likelihood for simultaneous estimation of the parameter of the stochastic frontier and the model for technical efficiency effects. In particular the mean of the truncated normal that represents the distribution of the inefficiency term u it in the Equation 16 can be expressed by Equation 17 m it = p δ p z it (17) where z it is a p x 1 vector of variables which may influence the efficiency of a firm; and δ is an 1 x p vector of parameters to be estimated. Note that not including an intercept parameter, δ 0, in the mean m it may imply the fact that the δ parameters associated with the z variables are biased and the shape of the distributions of the inefficiency effects are unnecessarily restricted (Battese and Coelli, 1995). 3 According to the parameterization 3 This model specification also encompasses a number of other model specifications as special cases. If we set T = 1 and z it contains the value one and no other variables (i.e. 9
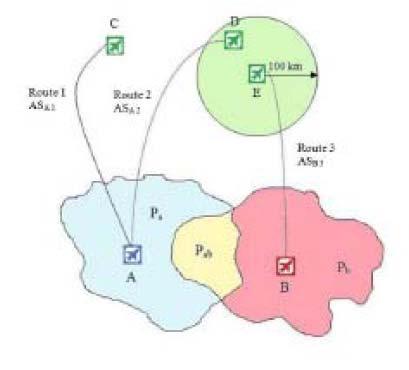
11 from Battese and Corra (1977), the likelihood function is expressed in term of σ 2 = σ 2 v + σ 2 u and γ = σ 2 u/(σ 2 v + σ 2 u). 3.2 The Indirect Competition Index The empirical evidence on the impact of inter airport competition on airports technical efficiency is limited. In order to understand the relationship between competition and efficiency we firstly tried to create an index that allowed to measure the competitive pressure. Our measure of competition is geographically based since the departure from an airport requires the physical presence of the passenger at the airport. Clearly the first step is to define the Catchment Area (CA) for each airport. Let s consider the ith airport: according to the approach of Propper et al. (2008) we draw a boundary around airport i that defines all the Zip codes within T minutes drive from the airport. 4 Then we compute P i that is the sum of the populations of the Zip codes belonging to CA i. Furthermore we compute the share of the population in all the Zip codes belonging to CA i that have a choice between different numbers of airports. In order to do so, we must take into account the fact that in air transportation each origin-destination route defines a separate market. This means that an airport is subject to competition on a specific route if the same connection is available at other nearby airports. For this reason the population of a particular Zip code, that belongs to both airport i CA and airport j CA, can choose between i and j only if both airports provide the same route. 5 Hence concerning an airport i with N different routes, we compute the equivalent population of its Catchment Area only a constant term), then the model reduces to the truncated normal specification in Stevenson (1980), where δ 0 (the only element in δ) will have the same interpretation as the µ parameter in Stevenson (1980). 4 We set T equal to 60, 75, 90, 105 and 120 minutes in order to study the behavior of the index at different time distance. 5 Concerning this, we consider airport i and airport j providing the same route if their destinations are close enough. Following Malighetti et al. (2008) this happens when the geographic distance from the two arrival airports is no more than 100 km. 10
12 (CA i ) for each single route n as P eq i n = P i n + Σ j (1/2)P ij + Σ k (1/3)P ijk + Σ h (1/4)P ijkh +... (18) Where P i n is the population, for the route n, that only belongs to the CA of airport i. P ij is the population that, for the route n, belongs both to the CA of airport i and airport j; P ijk is the population that, for the route n, belongs to the CA of airport i, airport j and airport k; and so on. So, (1) if airport i has a part of CA that is in common with an airport j and both of the airports provide the same route n, we compute this part of equivalent population as (1/2)P ij. Similarly,(2) if airports i has a part of its CA that is common with both airport j and airport k, and all these three airports provide the same route n, we compute this part of equivalent population as (1/3)P ijk ; (3) if airports i has a part of its CA that is common with other three airports, j, k and h, and all these four airports provide the same route n,we compute this part of equivalent population of airport i as (1/4)P ijkh ; and so on. In this way we can compute our index of competition for each of the N routes that airport i provides as C i n = 1 (P eq i n /P i ) n = 1, 2,..., N (19) In order to aggregate the N indexes for airport i in a single index, we need to weight them for the relative importance of the route n in the airport i. We can assume that the ratio between the number of Available Seat (AS) offered for the route n in airport i and the total number of Available Seat offered (AS tot ) in the same airport is a good proxy for the importance of the route, so we compute the index as C i = Σ N n=1[(as i n /AS i tot ) C i n ] (20) i. The higher is this index, the greater is the competitive pressure on airport 11
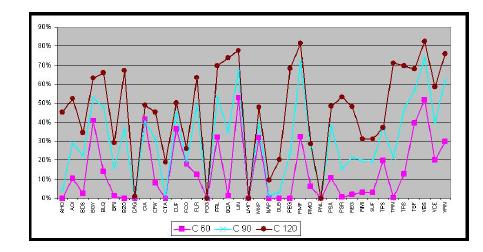
13 Figure 1 shows an example. Suppose to compute the competition index for airport A: its CA A is the sum of the yellow and the blue areas (note that the yellow one is shared with airport B). The route 1 is not in competition and so the P eq A 1 corresponds to the entire CA A population (blue and yellow area). Hence the index of competition according to route 1 is: C A 1 = 1 (P eq A 1 /P A ) = 0 (21) The route 2 is in competition with route 3 because the distance between the two destination airports is less than 100 km and the airports A and B have a part of their catchment areas in common. Hence for the route 2 the P eq A 2 correspond to: by: P eq A 2 = P A + (1/2)P AB (22) Therefore, according to route 2 the index of competition can be expressed C A 2 = 1 (P eq A 2 /P A ) (23) In order to aggregate the two indexes for airport A, it is necessary to weight them for the relative importance of each route with respect to the total airport s offer. Hence airport A aggregated index of competition is: C A = [(AS A 1 /AS tot A ) C A 1 ] + [(AS A 2 /AS tot A ) C A 2 ] (24) [FIGURE 1 ABOUT HERE] This index is computed for all the airports and for each year considered in our data set. Even if we assumed that population for each the Zip code is fixed for the 4 years we analyze, our index is time variant because it is based on the number of available seats offered by each airport. 6 Figure 2 puts in 6 The number of AS is time variant; the Zip codes populations are assumed to be fixed and refer to 2008 (source ISTAT). 12
14 comparison the competition indexes computed for the time distances of 60, 90 and 120 minutes (i.e. the minimum, the medium and the maximum time distance considered) for each airport of the dataset in [FIGURE 2 ABOUT HERE] 4 Data Airport output is not homogeneous even if it is not hard to identify. It is usually defined in terms of aircraft movements, passengers and freight movements. We do not consider freights in this contribution. Since we only take into account aircraft movements and passengers, an airport can be regarded as an interface between airlines and passengers as in Gillen and Lall (1997) and Pels et al. (2003). Moreover each of these output measurements is mainly related to a part of the infrastructure and, at the same time, each part of the infrastructure is basically related to only one of the two outputs: for instance runways are related to the number of aircrafts landing, while terminal building size depends upon the amount of passengers processed. Anyway as Yoshida (2004) pointed out, airport industry is the typical example of joint production: airports share the same set of inputs in order to yield different kinds of outputs. These joint production characteristics make complicated the evaluation of the efficiency in one all embracing measure. Therefore the approach of Coelli and Perelman (1999 and 2000) applied to our dataset allows the utilization of a distance function in order to solve the multi output problem. Italian airport system is composed by 101 airports of different size; among them only 45 airports are open to commercial aviation, while the others are small airports only for general aviation (private aircrafts and air taxi). The inputs of the main 38 airports have been collected with direct investigation, over the period For each airport we got information about two output variables: the yearly number of aircraft movements (ATM) and the yearly number of passenger movements (APM). The inputs used in the es- 13
15 timation are the runways capacity (CAP) in term of maximum number of flights per hour 7, the total number of aircraft parking positions (PARK), the terminal surface area (TERM), the number of check-in desks (CHECK) and the number of not handling employees in term of full time equivalent (FTE). The descriptive statistics are summarized in Table 2. 8 [TABLE 2 ABOUT HERE] Note that the Pearson correlation coefficients (Table 3) between all the inputs and the two outputs considered are significant (at a level of 1%) and positive. Table 3 also shows the correlation coefficients among the different inputs. They are all significant and very high, and this shows again that the different resources and facilities are generally dimensioned jointly to avoid bottlenecks (Lozano, 2009). Moreover we have considered some exogenous variables that influence the performance of each airport and that cannot be considered as inputs. fact these are conditioning variables beyond the direct control of the airport managers and capture characteristics of the environment in which production takes place. Four of these variables are assumed to influence the efficiency with which producers approach the production frontier but not the structure of the production frontier. The first covariate influencing efficiency is the indirect competition index (C) that we have already introduced in the previous section and whose effect on airports efficiency is one of the main interests of this contribution. Considering that the origin-distribution surveys carried out by airports and national authorities (CAA for example) point out that, in general, the higher number of passengers comes from areas which are within hour distance 7 We prefer this variable with respect to the runway length because CAP takes into account also other important features of airport infrastructure such as ground control radar and runway lighting systems. 8 Note that we have not included in our inputs the total surface area because this should introduce a bias due to the fact that a relevant part of many Italian airports surface is usually dedicated to military or external private companies activities. In 14
16 of the airport, we have chosen the competition index based on a time distance T = 90 min. A second variable included in our analysis is dominance (DOM), that is the percentage of AS 9 offered by the main airline in a specific airport with respect to the total volume of AS offered during the year in the same airport. This variable is interesting because it can be considered as a proxy of the degree of airports dependence on their main airline. A high dependence on a single carrier is a situation of increased risk for an Italian airport, as the recent events regarding Alitalia and Malpensa airport have shown. 10 The third exogenous variable is the degree of airports dependence on Italian flag carrier, Alitalia (AZ). Similarly to the dominance, it has been computed for each airport as the ratio between the annual offer in term of AS of Alitalia and the total volume of AS offered by the airport. By taking into account this variable, we intend to understand whether Alitalia may have transferred part of its inefficiency especially to those airports in which it held a relevant position in term of AS offered. The fourth covariate regards the airport ownership. More precisely we look at the impact of Public Local Organization (PLO) involved in the airport ownership on the efficiency. Hence we consider the municipalities or local governments stakes in each airport. 11 Among the 38 airports considered, only two airports, Lampedusa and Pantelleria, are managed directly by the government, through the Italian air transport public authority ENAC. The other 36 airports are run by independent (from the national government) companies: some of them are controlled by local governments and others by private agents. So the ownership structure of Italian airports is extremely heterogeneous. By considering PLO we can identify the impact of privatization and local interests on the efficiency. 9 AS means Available Seat 10 Alitalia has incurred in losses in several years. Consequently it has implemented restricting plans, involving a reduction of flights in some airports, especially Milan Malpensa. 11 In Italy there are two levels of local government: provinces and regions. Each region may include more than one province. 15
17 The only variable that we assume to influence directly the output is the seasonality (S); clearly airports more affected by tourist flows should have ceteris paribus fewer yearly aircraft movements and passenger. S is a dummy variable that is constant for the four years covered by our dataset: it assumes value of 1 if the airport belongs to a region whose monthly tourist flows are strongly seasonal and correlated with airports monthly passengers flows Results Estimation results for our model are given in Table 3. Maximum likelihood estimates of the parameter are obtained using FRONTIER 4.1 (Coelli, 1996). The estimated multi output stochastic production function is ln(ap M it ) = T L(AT M it /AP M it, T ERM it, CHECK it, F T E it, P ARK it, CAP it, α, β, ζ) + λs + v it u it (25) It can be seen that all the first order parameters are statistically significant. Moreover, most of the second order parameter are highly significant and this confirms the multi output nature of airports production function. The variance parameters, σ 2 and γ, are statistical significant respectively at 5% and 1% level and the estimated value of parameter γ is 0.708; this shows that technical efficiency have an important role to play in explaining the distance from the frontier (i.e. the variance of the inefficiency term is large compared to the variance of the disturbance term). However the significance of γ is confirmed by the generalized likelihood-ratio (LR) test. 13 Hence, there is a distinct inefficiency effect. 12 In order to obtain a proxy for the Seasonality we firstly computed the Gini index of the ISTAT monthly regional indexes of gross use of hotel facilities (as a proxy for regional tourist flows). Then airports belonged to regions with Gini coefficient below the average were assumed to have S = 0; those belonged to regions with Gini coefficient above the average were assumed to have S = 1 if the Pearson correlation between monthly regional tourist flows and airport passenger flows was significantly high, an S = 0 otherwise. 13 In our case the LR statistic is greater than 30, well above the critical value (at a signif- 16
18 [TABLE 3 ABOUT HERE] Concerning the estimates of the inefficiency model, we get that inefficiency is higher, (1) the higher is the inter airports competition index, (2) the smaller is the stake of local government in the airports ownership and (3) the lower is the presence of Alitalia in a specific airport Airports that suffer less competitive pressure seem to reach better performances. In other words, in the short run natural monopoly is better off. Anyway this is not surprising because it is probably due to the fact that airports under competition need a certain amount of time in order to reorganize their strategy and react in an appropriate way. However this reaction can not be apart from the capability to make effective strategic investments and this capability is in turn intrinsically connected to the issue of airport charges regulation. In fact blocking rates, decided several years ago, has meant that Italian airports charges are the lowest in Europe. 14 Furthermore the incomplete process of introduction of an incentive regulation scheme has produced a significant difference in comparison to the main European airports (see the evidence provided by Malighetti et al., 2009) and could have threshold the ability of reaction by airports managers. Anyway the issue of airports charges is a living matter for Italian central government. Obviously it would be desirable the introduction of simple rules and of a regulation scheme that induces greater efficiency in airports, in order to foster air transport market development. But according to the inter ministerial decree under approval, the rate increases seem to have a somewhat quirky structure: 1 euro for small airports, 2 euros for medium and 3 euros for larger scales. This scheme does not seem to respond to any economic criterion and nonetheless to create an incentive scheme in order to encourage a greater efficiency in managing airports. icance level equal to 5%). This means that most of the variance of the estimated residual is then attributed to variations in the degree of efficiency, rather than to a stochastic disturbance. 14 Only Spain has a lower level, but this is due to the fact that the Iberian airports are all managed by a single and central public authority (AENA). 17
19 Furthermore we point out that the lower is the stake of local governments in airports ownership structure, the lower is its efficiency in managing aircraft movements. Curi et al. (2009) have already found evidence of a positive link between performance and public presence in airports ownership structure. And, considering the fact that only two airports in Italy (Lampedusa and Pantelleria) are managed directly by central government, in many cases public means local public government. At a first sight a possible explanation could be that local public institutions have the greatest interest in maximizing the utilization of airport infrastructure in order to foster local economic development. In this sense it can be beneficial both their knowledge of local context (in term of potential and needs) and their influence in determining the quality of inter modal connections, which contribute to define the potential of a scale. Anyway this result is not so easy to explain. In fact in Italy there are a lot of regional airports in which controlling local governments have subsidized by public contributions the arrival of low cost airlines, producing on one hand an increase in the level of airport asset utilization (e.g. technical efficiency) but, on the other hand, a distortion of the competition. Surely privatization of airports would leave to the market the power to select airports which are efficient and able to grow without any political and artificial intervention. The third result is quite interesting in order to evaluate the impact of Alitalia on airports efficiency, also considering its recent downsizing because of its past poor performances. It seems that the inefficiency of the Italian flag carrier has not been transferred to the airports. On the contrary the stronger is Alitalia position, the higher results the technical efficiency of the airport. Moreover airport efficiency seems not to be influenced by the dominance of the main airline: the variable DOM is not significant. Anyway this doesn t mean that an high dependence on a single carrier is a situation free of risk for an airport, as the recent events regarding Alitalia and Malpensa airport have shown. [TABLE 4 ABOUT HERE] 18
20 Looking at the efficiency scores summarized in Table 4, the most efficient airports in the average are Bolzano, Cagliari, Lamezia Terme, Alghero, Perugia and Reggio Calabria (all with an efficiency score greater than 0.95). Note that among the first nine airports only Milan Malpensa has an average competition index greater than On the other hand, between the last nine airports only one, Rome Ciampino, has an average competition index lower than Note also that, even if (1) the volume of freight are not particularly relevant for most Italian airports and (2) aircraft movements include those relating to freights, some airports (e.g. Bergamo and Brescia) may have been penalized for the fact that in this evaluation we have not considered along with the number of passengers and movements also the tons of freights. 6 Conclusion This paper has investigated the efficiency of 38 Italian airports, by applying a stochastic frontier model with time dependent inefficiency components to a panel dataset regarding the period The sample covers the 84% of the commercial Italian airports, but more than the 95% of total movements and passengers. The estimation of the frontier has been made using a distance function approach to apply a stochastic frontier approach to a multiple output framework. We find that the greater is the airport s competitive pressure, the lower is its efficiency. We believe that this is due to short run rigidities in managing airports assets, since, as a consequence of an increasing competition, airport managers need to design new market strategies to attract both passengers and carriers and they have to plan new investments to improve the airport s infrastructures and the access to it. In this sense, an efficient regulation of airports charges is a strong policy recommendation, since it may increase private investments in this sector. Second, we find that the greater is the presence of public local organi- 19
21 zations in airports ownership structure, the higher is their efficiency. This result must be interpreted carefully: even if it is true that one of public organizations targets is undoubtedly the economic development of local areas under their jurisdiction (and in this sense airport is a key factor), our finding seems to be related to the widespread practice by many regional airports managers to provide subsidies (using public money) to some airlines (especially low cost carriers) in order to foster the exploitation of their airports. This practice may distorts competition by not providing carrier incentives to select the airports efficiently. Last, we find that the higher is Alitalia s market share in a given airport, the greater is its efficiency. This may be due to the presence of a network effect, being, up to now, Alitalia the only carrier covering the all country. We can infer some policy recommendations from the above evidence. First, Italy needs a regulation scheme that induces greater efficiency in airports. It is necessary to start a process of reallocation of the available slots, so that the entrance of new carriers, especially in the routes linking the regional airports to the main ones (Rome Fiumicino, Milan Malpensa and Venice) will be possible. Secondly, it is necessary to boost the privatization process. Up to now in Italy we only observe a pullback of the central government, but local governments seems to prefer to subsidize airlines rather then to adopt efficiencyoriented management strategies. 20
22 References Abbott, M., Wu, S., 2002, Total factor productivity and efficiency of Australian airports, Australian Economic Review, 35, Adler, N., Berechman, J., 2001, Measuring airport quality from the airlines viewpoint: an application of data envelopment analysis. Transport Policy, 8, doi: /s x(01) Barros, C.P., Sampaio A., 2004, Technical and allocative efficiency in airports. Journal of Transport Economics, 31, International Barros, C.P., Dieke, P.U.C., 2007, Performance evaluation of Italian airports: A data envelopment analysis. Journal of Air Transport Management, 13, Barros, C.P., Dieke, P.U.C., 2008, Measuring the economic efficiency of airports: A Simar Wilson methodology analysis. Transportation Research Part E, 44, Barros, C.P., Peypoch, N., 2008, A comparative analysis of productivity change in Italian and Portuguese airports. International Journal of Transport Economy, 35(2), Battese, G.E. and Coelli, T.J., 1995, A Model for Technical Inefficiency Effects in a Stochastic Frontier Production Function for Panel Data. Empirical Economics, 20, Battese, G.E. and Corra, G.S., 1977, Estimation of a Production Frontier Model: with Application to the Pastoral Zone of Eastern Australia. Australian Journal of Agricultural Economics, 21, Chow, C.K.W., Fung, M.K.Y., 2009, Efficiencies and scope economies of Chinese airports in moving passengers and cargo. Journal of Air Transport Management, 15, Coelli, T., A guide to FRONTIER Version 4.1: a computer program for stochastic frontier production and cost function estimation. Centre for Efficiency and Productivity Analysis. University of New England. Coelli, T., Perelman, S., A Comparison of Parametric and Non-Parametric Distance Functions: with Application to European Railways. European Journal of Operational Research, 117, Coelli, T., Perelman, S., Technical Efficiency of European Railways: a Distance Function Approach. Applied Economics, 32, Curi, C., Gitto, S., Mancuso, P., The Italian airport industry in transition: a performance analysis. Journal of Air Transport Management, doi: /j.jairtraman
23 Fernandes, E., Pacheco, R.R., 2002, Efficient use of airport capacity. Part A, 36, Transportation Research Fung, M.K.Y., Wan, K.K.H., Hui, Y.V. and J.S. Law, 2008, Productivity changes in Chinese airports Transportation Research Part E, 44, Gillen, D., Lall A., 1997, Developing measures of airports productivity and performance: application of data envelopment analysis.transportation Research Part E, 33, an Gillen, D., Lall, A., 2001, Non Parametric Measures of Efficiency of US Airports. Economics, 28, Transport Lin L.C., Hong, C.H., 2006, Operational performance evaluation of international major airports: an application of data envelopment analysis. Journal of Air Transport Management, 12, , doi: /j.jairtraman Lozano, S., Gutirrez, E., 2009, Efficiency Analysis and Target Setting of Spanish Airports. Networks and Spatial Economics, doi: /s Malighetti, P., Martini, G., Paleari, S. and R. Redondi, 2009, The Impact of Airport Centrality in the EU Network and Inter Airport Competition on Airport Efficiency. Martin, J.C., Roman, C., 2001, An application of DEA to measure the efficiency of Spanish airports prior to privatization. Journal of Air Transport Management, 7, Martin, J.C., Roman, C., Voltes-Dorta, A., 2009, A stochastic frontier analysis to estimate the relative efficiency of Spanish airports. J Prod Anal, 31, , doi: /s Martin Cejas, R.R., 2002, An approximation to the productive efficiency of the Spanish airports network through a deterministic cost frontier. Journal of Air Transport Management, 8, Martin Cejas, R.R., Tovar, B.,2009, Technical efficiency and productivity changes in Spanish airports: A parametric distance functions approach. Transportation Research Part E: Logistics and Transportation Review, Volume 46, Issue 2, March 2010, Pages Murillo Melchor, C., 1999, An analysis of technical efficiency and productivity changes in 32 Spanish airports using the Malmquist index. International Journal of Transport Economics, 26, Oum, T.H., Yu, C., 2004, Measuring airports operating efficiency: a summary of the ATRS Global Airport Benchmarking Report. Transportation Research Part E, 40, Oum, T.H., Yan, J. and C. Yu, 2008, Ownership forms matter for airport efficiency: A stochastic frontier investigation of worldwide airports. Journal of Urban Economics, 64, Pacheco, R., Fernandes, E.,Sequeira Santos, M., 2006, Management style and airport performance in Brazil. Journal of Air Transport and Management, 12, Parker, D., 1999, The performance of BAA before and after privatisation: A DEA study. Journal of Transport Economics and Policy, 33,
24 Pathomsiri, S., Haghani, A., Dresner, M.,Windle, R.J., 2008, Impact of undesirable outputs on the productivity of US airports. Transp Res Part E Logistics and Transp Rev, 44, , doi: /j.tre Pels, E., Nijkamp, P. and P. Rietveld, 2001, Relative efficiency of European airportstransport Policy, 8, Pels, E., Nijkamp, P. and P. Rietveld, 2003, Inefficiencies and scale economies of European airport operations. Transportation Research Part E, 39, Propper, C., Burgess, S. and K. Green, 2004, Does competition between hospitals improve the quality of care?: Hospital death rates and the NHS internal market. Journal of Public Economics, Volume 88, Issues 7-8, July 2004, Pages Sarkis, J., 2000, An analysis of the operational efficiency of major airports in the United States. Journal of Operations Management, 18, Sarkis, J., Talluri, S., 2004, Performance based clustering for benchmarking of US airports. Transportation Research Part A, 38, Simar, L., Wilson, P.W., Estimation and inference in two-stage, semiparametric models of productive efficiency. Journal of Econometrics, 136, Yoshida, Y., 2004, Endogenous weight TFP measurement: Methodology and its application to Japanese airport benchmarking. Transportation Research Part E, 40, Yoshida, Y., Fujimoto, H., 2004, Japanese airport benchmarking with the DEA and endogenous weight TFP methods: Testing the criticism of overinvestment in Japanese regional airports. Transportation Research Part E, 40, Yu, M.M., 2004, Measuring physical efficiency of domestic airports in Taiwan with undesirable outputs and environmental factors. J Air Transp Manag, 10, , doi: /j.jairtraman Yu, M.M., Hsu, S.H., Chang, C.C., Lee, D.H., 2008, Productivity growth of Taiwans major domestic airports in the presence of aircraft noise. Transp Res Part E Logistics and Transp Rev, 44(3), doi: /j.tre
25 24 Table 1: Summary of airport performance studies AUTHORS METHODOLOGY DATA INPUT OUTPUT Gillen and Lall DEA CRS - VRS US (21) Terminal services model: Terminal services model: (1997) Output (1) number of runways, (2) number of gates (1) APM, (2) cargo Farrell (3) terminal area, (4) n of baggage collection belts (5) number of public parking spots (%). Movements model: Movements model: (1) airport area, (2)number of runways, (1) aircraft operations (3) runway area, (4) number of employees (2) commuter movements Parker DEA VRS First Model (1) number of employees, (2) capital input (1) turnover, (1999) Input UK (32) (3) other inputs defined as (2) passenger handled Farrell 1979/ /1996 the residual of total operating costs (3) cargo and mail business Second Model UK (22) 1988/ /1997 Murillo Melchor DEA - CRS Spain (33) (1) number of workers, (1) number of passengers (1999) Output (2) accumulated capital stock proxied by amortization, Malmquist (F) (3) intermediate expense Sarkis DEA CRS - VRS US (43) (1) operating costs, (2) employees, (1) operating revenues, (2) aircraft movements, 2000 Input (3) gates, (4) runways (3) general aviations, (4) total passengers, Farrell - CE - SE (5) total freight Gillen and Lall DEA US (22) Terminal services model: Terminal services model (2001) Malmquist (1) number of runways, (2) number of gates, (1) number of passengers, (2) number of pounds (3) terminal area, (4) number of employees, (5) number of baggage collection belts,
26 25 (6) numbers of public parking places. Movements model: Movements model: (1) airport area, (2) number of runways, (1) air carrier movements, (3) runway area, (4) number of employees (2) commuter movements Pels et al. (1) DEA VRS European Union (34) Dea model: Terminal model: (2001) Input (1) terminal size, (1) APM, Farrell (2) parking positions at the terminal, (2) movement model, (3) remote parking positions, (3) ATM (4) check in desks, (5) baggage claims Stochastic frontier model: (2) SFA (1) baggage claim units, production function (2) parking positions at the terminal, MLE (3) remote parking positions Martin and Romn DEA VRS Spain (37) (1) labor, (2) capital, (1) ATM, (2) APM, (2001) Output 1997 (3) materials (3) cargo tonnes Farrell Adler and Berechman DEA VRS Worldwide airports (26) (1) terminal area, (2)runways (1) Principal components (2001) Input 1996 (3) distance to city centers, (obtained from questionnaire on airlines) SuperE (PCA - DEA) (4) minimum connecting times Abbott and Wu DEA - Malmquist Australia (12) (1) staff employed, (1) APM, (2002) 1989/1990 (2) capital stock, (2) cargo 1999/2000 (3) runway length Fernandes and Pacheco DEA VRS Brazil (16) (1) surface, (1) domestic APM (2002) Output 1998 (2) departure lounge, Farrell (3) check-in counters, (4) curb frontage, (5) vehicle parking spaces,
27 26 (6) baggage claim area Bazargan and Vasigh DEA CRS US (45) (1) operating expenses, (1) passenger, (2) air carrier operations, (2002) Input (2) non operating expenses, (2) other operations, Farrell (3) number of runways, (4) boarding gates (4)-(5) aeronautical and non aeronautical revenues Pels et al. (1) DEA VRS European Union (33) Terminal model Terminal model (2003) Input (1) airports surface, (1) ATM Farrell (2) parking positions at terminal (2) SFA (3) remote parking positions, production function (4) runways, MLE (5) dummy slot-coordinated (Z), (6) dummy time restrictions (Z) Movement model Movement model (1) check-in-desks, (1) APM (2) baggage claims, (3) ATM Oum and Yu Variable factor productivity (VFP) Asia Pacific, Europe (1) FTE employees, (1) APM, (2) cargo, (2004) and North America (76) (2) Soft cost input index (3) ATM, (4) non aeronautical output index Sarkis and Talluri DEA CRS US (43) (1) operating costs, (2) employees, (1) operating revenues, (2) ATM, (2004) Input (3) gates, (3) general aviations, ( Farrell CrossE (4) runways 4) APM, (5) total freight Barros and Sampaio DEA VRS Portugal (10) (1) employees, (1) number of planes, (2004) Allocative model (Farrell) (2) capital (2) APM, (3) price of capital, (3) general cargo, (4) price of labour, (4) mail cargo, (5) sales to planes, (6) sales to passengers
28 27 Yoshida Endogenus - weight method Japan (43) (1) runway length, (2) terminal size (1) passenger loading, (2) cargo handling (2004) 2000 (3) ATM Yoshida and Fujimoto DEA VRS Japan (43) (1) runway length, (2) terminal size, (1) passenger loading, (2004) Input 2000 (3) monetary access cost, (4) time access cost, (2) cargo handling, Farrell (5) employees in terminal building (3) ATM Lin and Hong Multiple DEA models World (20) (1) employees, (2) check in counters, (1) APM, (2006) (CRS, VRS e FDH) ?? (3) runways, (4) parking spaces, (2) cargo, Farrell, Crossefficiency, (5) baggage collection belts, (6) aprons, (3) ATM Superefficiency (7) gates, (8) terminal area Pacheco et al. DEA VRS Brazil (58) (1) payroll, (2) operating and other expenses, (1) operating revenues, (2) commercial revenues, (2006) Input (3) other revenues, (2) cargo, (4) passengers, (5) cargo Barros and Dieke DEA CCR, DEA BCC Italy (31) (1) labour cost, (2) capital invested, (1) number of planes, (2) APM, (2007) DEA Crossefficiency (3) operational costs (excluding wage costs) (3) general cargo, (4) handling receipts, DEA A8P, U-test (5) aeronautical sales, (6) commercial sales Fung et al. DEA CRS China (25) (1) runway length, (1) APM, (2007) Output (2) terminal area (2) cargo, Malmquist (Farrell) (3) ATM Malighetti et al. DEA CRS - VRS Italy (34) Air Side Air Side (2007) Malmquist (1) airport area, (2) total runways length, (1) ATM Tobit Model (3) parking positions Terminal Side Terminal Side (1) terminal area, (2) check in desk, (1) APM (3) parking positions, (4) lines for baggage claim Barros and Dieke DEA VRS Italy (31) (1) labor cost, (2) capital invested, (1) number of planes, (2) APM, (2008) Output (3) operational costs (excluding wage costs) (3) general cargo, (4) handling receipts, Farrel (5) aeronautical sales, (6) commercial sales
29 28 Barros and Peypoch DEA VRS Italy and (1) operational costs; (1) APM, (2) ATM, (3) Cargo (2008) (-Input, Output) Portugal (40) (3) capital invested, (4) commercial revenue, Luenberger (5) handling receipts, (6) aeronautical revenue directional distance Fung et al DEA CRS China (25) (1) total runway length, (1) APM (2008) Output (2) terminal area (2) ATM, Malmquist (Farrell) (3) cargo Pathomsiri et al DEA CRS US (56) (1) land area, (1) APM, (2) not delayed ATM, (2008) directional distance (2) number of runways (3) cargo, (4) delayed aircrafts (undesirable), (5) flights delays (undesirable) Tapiador et al. DEA CRS Spain (42) (1) leisure services ind., (2) total population, (1) passengers (2008) Input 2006 (3) economic activity ind., (4) commercial activity ind., Farell (5) tourism activity ind., (6) intermodality ind., (7) European resident pop., (8) industrial activity ind. Yu et al. DEA CRS Taiwan (4) (1) labour costs, (2) capital stock (1) APM, (2) ATM, (3) revenue, (2008) Luenberger (3) operating expenditures (4) noise (undesirable) directional distance Oum et al. SFA major world (1) labor, (1) APM, (2008) cost frontier airports (2) non-labor variable input (2) ATM Bayesian estimation (3) revenues (non-aeronautical) Chow and Fung SFA China (46) ATM (1) APM (2009) production frontier 2000 (1) airports surface, (2) ATM MLE (2) runways length, (3) parking positions APM (3) cargo (1) ATM*, (2) terminal area,
30 (3) car-park area ACM (1) ATM*, (2) cargo handling facilities Martn-Cejas and Tovar SFA (SDA) Spain (26) (1) labor, (2) area, (1) ATM, (2009) production frontier (3) gates revenue (2) average size of aircraft, MLE + TFP (3) non-aeronautical Martn et al. SFA Spain (37) (1) capital, (1) ATM, (2009) cost frontier (2) material, (2) WLU Bayesian estimation (3) personnel Curi et al. DEA VRS Italy (36) (1) labor cost, (2) capital invested, (1) number of planes, (2) APM, (2009) Output (3) operational costs (no labor), (4) labour capital composition (Z), (3) general cargo, (5) capital accumulation (Z), (6) dummy private (Z), (4) handling receipts, (7) dummy total concession (Z), (8) dummy partial concession (Z), (5) aeronautical sales, (9) dummy hub (Z) (6) commercial sales 29
31 Table 2: Descriptive statistics of input (I) and output (O) variables Average Median Std. Dev. Max Min CHECK (I) FTE (I) PARK (I) CAP (I) TERM (I) ATM (O) APM (O) Table 3: Pearson correlations of input (I) and output (O) variables CHECK (I) FTE (I) PARK (I) CAP (I) TERM (I) ATM (O) APM (O) CHECK (I) FTE (I) PARK (I) CAP (I) TERM (I) ATM (O) APM (O)
32 Table 4: Final maximum likelihood estimates Parameter Estimate Std. Error Constant (***) AT M (***) T ER (***) CHECK (***) F T E (***) P ARK (***) CAP (***) AT M (***) AT M x T ER (***) AT M x CHECK AT M x F T E (**) AT M x P ARK (**) AT M x CAP T ER (**) T ER x CHECK (**) T ER x F T E (***) T ER x P ARK (**) T ER x CAP (**) CHECK (**) CHECK x F T E (**) CHECK x P ARK (**) CHECK x CAP (*) F T E (*) F T E x P ARK (*) F T E x CAP (**) P ARK P ARK x CAP (*) CAP (**) DS (***) Intercept z C (***) P T ER (***) AZ (**) DOM σ (**) γ (***) LR log likelihood value Note that *,**,*** denote significance at 10%, 5% and 1% respectively. 31
33 Table 5: Technical efficiency scores Airport IATA Alghero AHO Ancona AOI Bari BRI Bergamo BGY Bologna BLQ Bolzano BZO Brescia VBS Brindisi BDS Cagliari CAG Catania CTA Crotone CRV Cuneo CUF Firenze FLR Foggia FOG Forli` FRL Genoa GOA Lamezia T. SUF Lampedusa LMP Milan Linate LIN Milan Malpensa MXP Naples NAP Olbia OLB Palermo PMO Pantelleria PNL Parma PMF Perugia PEG Pescara PSR Pisa PSA Reggio Calabria REG Rimini RMI Rome Ciampino CIA Rome Fiumicino FCO Torino TRN Trapani TPS Treviso TSF Trieste TRS Venice VCE Verona VRN
34
35
October, Abstract. Department of Economics and Technology Management. University of Bergamo, Italy
 Department of Economics and Technology Management University of Bergamo, Italy October, 2010 Abstract We investigate how the intensity of competition among airports affects their technical efficiency by
An Assessment on the Cost Structure of the UK Airport Industry: Ownership Outcomes and Long Run Cost Economies
 An Assessment on the Cost Structure of the UK Airport Industry: Ownership Outcomes and Long Run Cost Economies Anna Bottasso & Maurizio Conti Università di Genova Milano- IEFE-Bocconi 19 March 2010 Plan
Impact of Landing Fee Policy on Airlines Service Decisions, Financial Performance and Airport Congestion
 Wenbin Wei Impact of Landing Fee Policy on Airlines Service Decisions, Financial Performance and Airport Congestion Wenbin Wei Department of Aviation and Technology San Jose State University One Washington
NOTES ON COST AND COST ESTIMATION by D. Gillen
 NOTES ON COST AND COST ESTIMATION by D. Gillen The basic unit of the cost analysis is the flight segment. In describing the carrier s cost we distinguish costs which vary by segment and those which vary
Airport Monopoly and Regulation: Practice and Reform in China Jianwei Huang1, a
 2nd International Conference on Economics, Management Engineering and Education Technology (ICEMEET 2016) Airport Monopoly and Regulation: Practice and Reform in China Jianwei Huang1, a 1 Shanghai University
Exploratory analysis on LCC potential to influence airport efficiency Sérgio Domingues. AIRDEV Seminar Lisbon, October 20th 2011
 Exploratory analysis on LCC potential to influence airport efficiency Sérgio Domingues AIRDEV Seminar Lisbon, October 20th 2011 1 Contents Introduction Drivers of airport efficiency Data Collection Discussion
Empirical Studies on Strategic Alli Title Airline Industry.
 Empirical Studies on Strategic Alli Title Airline Industry Author(s) JANGKRAJARNG, Varattaya Citation Issue 2011-10-31 Date Type Thesis or Dissertation Text Version publisher URL http://hdl.handle.net/10086/19405
Prof. Tae H. Oum The Air Transport Research Society (ATRS)
") Key Results of the 2010 ATRS Global Airport Performance Benchmarking Project Prof. Tae H. Oum The Air Transport Research Society (ATRS) www.atrsworld.org The ATRS Global Airport Benchmarking Task Force
Key Results of the 2010 ATRS Global Airport Performance Benchmarking Project Prof. Tae H. Oum The Air Transport Research Society (ATRS) www.atrsworld.org The ATRS Global Airport Benchmarking Task Force
WHEN IS THE RIGHT TIME TO FLY? THE CASE OF SOUTHEAST ASIAN LOW- COST AIRLINES
 WHEN IS THE RIGHT TIME TO FLY? THE CASE OF SOUTHEAST ASIAN LOW- COST AIRLINES Chun Meng Tang, Abhishek Bhati, Tjong Budisantoso, Derrick Lee James Cook University Australia, Singapore Campus ABSTRACT This
Performance and Efficiency Evaluation of Airports. The Balance Between DEA and MCDA Tools. J.Braz, E.Baltazar, J.Jardim, J.Silva, M.
 Performance and Efficiency Evaluation of Airports. The Balance Between DEA and MCDA Tools. J.Braz, E.Baltazar, J.Jardim, J.Silva, M.Vaz Airdev 2012 Conference Lisbon, 19th-20th April 2012 1 Introduction
Abstract. Introduction
 COMPARISON OF EFFICIENCY OF SLOT ALLOCATION BY CONGESTION PRICING AND RATION BY SCHEDULE Saba Neyshaboury,Vivek Kumar, Lance Sherry, Karla Hoffman Center for Air Transportation Systems Research (CATSR)
THE PERFORMANCE OF DUBLIN AIRPORT:
 THE PERFORMANCE OF DUBLIN AIRPORT: THE FINDINGS OF THE COMPARATIVE REPORTS OF THE TRL AND THE ATRS MAY 2005 TABLE OF CONTENTS 1 INTRODUCTION...2 2 MAIN TRL FINDINGS ON THE RELATIVE OPERATING COSTS OF DUBLIN
Efficiency and Environment in the Aviation Sector
 UNIVERSITY OF BERGAMO Faculty of Engineering Ph.D. course in Economics and Management of Technology XXV Cohort Efficiency and Environment in the Aviation Sector Doctoral Dissertation Supervisor: Prof.
Efficiency and Automation
 Efficiency and Automation Towards higher levels of automation in Air Traffic Management HALA! Summer School Cursos de Verano Politécnica de Madrid La Granja, July 2011 Guest Lecturer: Rosa Arnaldo Universidad
De luchtvaart in het EU-emissiehandelssysteem. Summary
 Summary On 1 January 2012 the aviation industry was brought within the European Emissions Trading Scheme (EU ETS) and must now purchase emission allowances for some of its CO 2 emissions. At a price of
Regulation, Privatization, and Airport Charges: Panel Data Evidence from European Airports. forthcoming in Journal of Regulatory Economics
 Regulation, Privatization, and Airport Charges: Panel Data Evidence from European Airports forthcoming in Journal of Regulatory Economics Volodymyr Bilotkach, Northumbria University; Joseph Cloughterty,
Measuring performance and profitability of regional European airports and implications for financial break even
 Measuring performance and profitability of regional European airports and implications for financial break even Branko Bubalo, Volodymyr Bilotkatch, Juergen Mueller, Gordana Savic, Tolga Ülkü Measuring
Foregone Economic Benefits from Airport Capacity Constraints in EU 28 in 2035
 Foregone Economic Benefits from Airport Capacity Constraints in EU 28 in 2035 Foregone Economic Benefits from Airport Capacity Constraints in EU 28 in 2035 George Anjaparidze IATA, February 2015 Version1.1
A Guide to the ACi europe economic impact online CALCuLAtoR
 A Guide to the ACI EUROPE Economic Impact ONLINE Calculator Cover image appears courtesy of Aéroports de Paris. 2 Economic Impact ONLINE Calculator - Guide Best Practice & Conditions for Use of the Economic
Measure 67: Intermodality for people First page:
 Measure 67: Intermodality for people First page: Policy package: 5: Intermodal package Measure 69: Intermodality for people: the principle of subsidiarity notwithstanding, priority should be given in the
PREFERENCES FOR NIGERIAN DOMESTIC PASSENGER AIRLINE INDUSTRY: A CONJOINT ANALYSIS
 PREFERENCES FOR NIGERIAN DOMESTIC PASSENGER AIRLINE INDUSTRY: A CONJOINT ANALYSIS Ayantoyinbo, Benedict Boye Faculty of Management Sciences, Department of Transport Management Ladoke Akintola University
Predicting Flight Delays Using Data Mining Techniques
 Todd Keech CSC 600 Project Report Background Predicting Flight Delays Using Data Mining Techniques According to the FAA, air carriers operating in the US in 2012 carried 837.2 million passengers and the
An Exploration of LCC Competition in U.S. and Europe XINLONG TAN
 An Exploration of LCC Competition in U.S. and Europe CLIFFORD WINSTON JIA YAN XINLONG TAN BROOKINGS INSTITUTION WSU WSU Motivation Consolidation of airlines could lead to higher fares and service cuts.
Modeling Air Passenger Demand in Bandaranaike International Airport, Sri Lanka
 Journal of Business & Economic Policy Vol. 2, No. 4; December 2015 Modeling Air Passenger Demand in Bandaranaike International Airport, Sri Lanka Maduranga Priyadarshana Undergraduate Department of Transport
Schedule Compression by Fair Allocation Methods
 Schedule Compression by Fair Allocation Methods by Michael Ball Andrew Churchill David Lovell University of Maryland and NEXTOR, the National Center of Excellence for Aviation Operations Research November
The efficiency of UK airports
 Loughborough University Institutional Repository The efficiency of UK airports This item was submitted to Loughborough University's Institutional Repository by the/an author. Additional Information: A
Project Coordinator: Research Director: North America: (United States of America) Asia Pacific: (Japan) Hankuk Aviation University.
 Asia Pacific: (Japan) Hankuk Aviation University.") 2012 Airport Benchmarking Team 2012 Information Package Project Coordinator: Professor Tae H. OUM Research Director: Professor Chunyan Yu Dr. Yapyin Choo North America: Professor Bijan VASIGH (United States
2012 Airport Benchmarking Team 2012 Information Package Project Coordinator: Professor Tae H. OUM Research Director: Professor Chunyan Yu Dr. Yapyin Choo North America: Professor Bijan VASIGH (United States
strategic transportation & tourism solutions
 strategic transportation & tourism solutions Guidelines for Benchmarking Airports Dr. Michael Tretheway Sauder School of Business, Univ of British Columbia & Ian Kincaid InterVISTAS Consulting Inc. 20
Aviation contribution to trade
 Aviation contribution to trade Gianmaria Martini University of Bergamo ATC 3rd December 2015 Trade and Aviation: reality spot Aviation is essential for people and frieght mobility...... and its importance
Quantile Regression Based Estimation of Statistical Contingency Fuel. Lei Kang, Mark Hansen June 29, 2017
 Quantile Regression Based Estimation of Statistical Contingency Fuel Lei Kang, Mark Hansen June 29, 2017 Agenda Background Industry practice Data Methodology Benefit assessment Conclusion 2 Agenda Background
ELEVENTH AIR NAVIGATION CONFERENCE. Montreal, 22 September to 3 October 2003
 4/8/03 English, French, Russian and Spanish only * ELEVENTH AIR NAVIGATION CONFERENCE Montreal, 22 September to 3 October 2003 Agenda Item 3: 3.1 : Air traffic management (ATM) performance targets for
1 Replication of Gerardi and Shapiro (2009)
") Appendix: "Incumbent Response to Entry by Low-Cost Carriers in the U.S. Airline Industry" Kerry M. Tan 1 Replication of Gerardi and Shapiro (2009) Gerardi and Shapiro (2009) use a two-way fixed effects
Appendix: "Incumbent Response to Entry by Low-Cost Carriers in the U.S. Airline Industry" Kerry M. Tan 1 Replication of Gerardi and Shapiro (2009) Gerardi and Shapiro (2009) use a two-way fixed effects
Overview of the Airline Planning Process Dr. Peter Belobaba Presented by Alex Heiter
 Overview of the Airline Planning Process Dr. Peter Belobaba Presented by Alex Heiter Istanbul Technical University Air Transportation Management M.Sc. Program Network, Fleet and Schedule Strategic Planning
AN ANALYTIC NETWORK PROCESS COMBINED DATA ENVELOPMENT ANALYSIS METHODOLOGY TO EVALUATE THE PERFORMANCE OF AIRPORTS IN TURKEY
 AN ANALYTIC NETWORK PROCESS COMBINED DATA ENVELOPMENT ANALYSIS METHODOLOGY TO EVALUATE THE PERFORMANCE OF AIRPORTS IN TURKEY Berna ULUTAS * Eskisehir Osmangazi University, Department of Industrial Engineering
LCC Competition in the U.S. and EU: Implications for the Effect of Entry by Foreign Carriers on Fares in U.S. Domestic Markets
 LCC Competition in the U.S. and EU: Implications for the Effect of Entry by Foreign Carriers on Fares in U.S. Domestic Markets Xinlong Tan Clifford Winston Jia Yan Bayes Data Intelligence Inc. Brookings
ESTIMATING REVENUES AND CONSUMER SURPLUS FOR THE GERMAN AIR TRANSPORT MARKETS. Richard Klophaus
 ESTIMATING REVENUES AND CONSUMER SURPLUS FOR THE GERMAN AIR TRANSPORT MARKETS Richard Klophaus Worms University of Applied Sciences Center for Aviation Law and Business Erenburgerstraße 19 D-67549 Worms,
ScienceDirect. Prediction of Commercial Aircraft Price using the COC & Aircraft Design Factors
 Available online at www.sciencedirect.com ScienceDirect Procedia Engineering 67 ( 2013 ) 70 77 7th Asian-Pacific Conference on Aerospace Technology and Science, 7th APCATS 2013 Prediction of Commercial
An Econometric Study of Flight Delay Causes at O Hare International Airport Nathan Daniel Boettcher, Dr. Don Thompson*
 An Econometric Study of Flight Delay Causes at O Hare International Airport Nathan Daniel Boettcher, Dr. Don Thompson* Abstract This study examined the relationship between sources of delay and the level
REGIONAL ASPECTS OF AGRICULTURAL INCOME LEVEL IN VOJVODINA PROVINCE IN FUNCTION OF BASIC PRODUCTION FACTORS
 REGIONAL ASPECTS OF AGRICULTURAL INCOME LEVEL IN VOJVODINA PROVINCE IN FUNCTION OF BASIC PRODUCTION FACTORS KATARINA ČOBANOVIĆ Faculty of Agriculture Novi Sad, Novi Sad, Serbia. E-mail: katcob@polj.ns.ac.yu
Airline Fuel Efficiency Ranking
 Airline Fuel Efficiency Ranking Bo Zou University of Illinois at Chicago Matthew Elke, Mark Hansen University of California at Berkeley 06/10/2013 1 1 Outline Introduction Airline selection Mainline efficiency
Gold Coast: Modelled Future PIA Queensland Awards for Planning Excellence 2014 Nomination under Cutting Edge Research category
 Gold Coast: Modelled Future PIA Queensland Awards for Planning Excellence 2014 Nomination under Cutting Edge Research category Jointly nominated by SGS Economics and Planning and City of Gold Coast August
Hydrological study for the operation of Aposelemis reservoir Extended abstract
 Hydrological study for the operation of Aposelemis Extended abstract Scope and contents of the study The scope of the study was the analytic and systematic approach of the Aposelemis operation, based on
The Economic Impact of Tourism Brighton & Hove Prepared by: Tourism South East Research Unit 40 Chamberlayne Road Eastleigh Hampshire SO50 5JH
 The Economic Impact of Tourism Brighton & Hove 2014 Prepared by: Tourism South East Research Unit 40 Chamberlayne Road Eastleigh Hampshire SO50 5JH CONTENTS 1. Summary of Results 1 1.1 Introduction 1 1.2
CRITICAL FACTORS FOR THE DEVELOPMENT OF AIRPORT CITIES. Mauro Peneda, Prof. Rosário Macário AIRDEV Seminar IST, 20 October 2011
 CRITICAL FACTORS FOR THE DEVELOPMENT OF AIRPORT CITIES Mauro Peneda, Prof. Rosário Macário AIRDEV Seminar IST, 20 October 2011 Introduction Airports are becoming new dynamic centres of economic activity.
Time-Space Analysis Airport Runway Capacity. Dr. Antonio A. Trani. Fall 2017
 Time-Space Analysis Airport Runway Capacity Dr. Antonio A. Trani CEE 3604 Introduction to Transportation Engineering Fall 2017 Virginia Tech (A.A. Trani) Why Time Space Diagrams? To estimate the following:
Proceedings of the 54th Annual Transportation Research Forum
 March 21-23, 2013 DOUBLETREE HOTEL ANNAPOLIS, MARYLAND Proceedings of the 54th Annual Transportation Research Forum www.trforum.org AN APPLICATION OF RELIABILITY ANALYSIS TO TAXI-OUT DELAY: THE CASE OF
AIR TRANSPORT MANAGEMENT Universidade Lusofona January 2008
 AIR TRANSPORT MANAGEMENT Universidade Lusofona Introduction to airline network planning: John Strickland, Director JLS Consulting Contents 1. What kind of airlines? 2. Network Planning Data Generic / traditional
The limitation of ramp handling licenses at Rome Fiumicino Airport 1 Workshop Legal Survey Barcelona Dec. 8, 2016
 Ground Handling Social Dialogue Support The limitation of ramp handling licenses at Rome Fiumicino Airport 1 Workshop Legal Survey Barcelona Dec. 8, 2016 2 A quick look at history After year 2000 the ground
THE ECONOMIC IMPACT OF NEW CONNECTIONS TO CHINA
 THE ECONOMIC IMPACT OF NEW CONNECTIONS TO CHINA A note prepared for Heathrow March 2018 Three Chinese airlines are currently in discussions with Heathrow about adding new direct connections between Heathrow
STANSTED AIRPORT LIMITED REGULATORY ACCOUNTS PERFORMANCE REPORT FOR THE YEAR ENDED 31 MARCH Financial Review...1. Performance Report...
 PERFORMANCE REPORT CONTENTS Page Financial Review...1 Performance Report...3 Notes to the Performance Report...4 Stansted Regulatory Accounts PERFORMANCE REPORT Financial Review General overview Stansted
Draft Proposal for the Amendment of the Sub-Cap on Off-Peak Landing & Take Off Charges at Dublin Airport. Addendum to Commission Paper CP4/2003
 Draft Proposal for the Amendment of the Sub-Cap on Off-Peak Landing & Take Off Charges at Dublin Airport Addendum to Commission Paper CP4/2003 26 th November 2003 Commission for Aviation Regulation 3 rd
THIRTEENTH AIR NAVIGATION CONFERENCE
 International Civil Aviation Organization AN-Conf/13-WP/22 14/6/18 WORKING PAPER THIRTEENTH AIR NAVIGATION CONFERENCE Agenda Item 1: Air navigation global strategy 1.4: Air navigation business cases Montréal,
Hotel Investment Strategies, LLC. Improving the Productivity, Efficiency and Profitability of Hotels Using Data Envelopment Analysis (DEA)
") Improving the Productivity, Efficiency and Profitability of Hotels Using Ross Woods Principal 40 Park Avenue, 5 th Floor, #759 New York, NY 0022 Tel: 22-308-292, Cell: 973-723-0423 Email: ross.woods@hotelinvestmentstrategies.com
Improving the Productivity, Efficiency and Profitability of Hotels Using Ross Woods Principal 40 Park Avenue, 5 th Floor, #759 New York, NY 0022 Tel: 22-308-292, Cell: 973-723-0423 Email: ross.woods@hotelinvestmentstrategies.com
SIM Selection and peer-review under responsibility of SIM 2013 / 12th International Symposium in Management.
 Available online at www.sciencedirect.com ScienceDirect Procedia - Social and Behavioral Scien ce s 124 ( 2014 ) 292 300 SIM 2013 Study regarding the profitability of Timisoara International Airport Marian
MAXIMUM LEVELS OF AVIATION TERMINAL SERVICE CHARGES that may be imposed by the Irish Aviation Authority ISSUE PAPER CP3/2010 COMMENTS OF AER LINGUS
 MAXIMUM LEVELS OF AVIATION TERMINAL SERVICE CHARGES that may be imposed by the Irish Aviation Authority ISSUE PAPER CP3/2010 COMMENTS OF AER LINGUS 1. Introduction A safe, reliable and efficient terminal
I n t e r m o d a l i t y
 Innovative Research Workshop 2005 I n t e r m o d a l i t y from Passenger Perspective PASSENGER MOVEMENT SIMULATION PhD Candidate EUROCONTROL Experimental Centre (France) and University of ZILINA (Slovakia)
1.2 Some of the figures included in this publication may be provisional and revised in later issues.
 FOREWORD 1 CONTENT 1.1 "UK Airlines - Operating and Traffic Statistics" is published by the Civil Aviation Authority with the co-operation of the United Kingdom airline operators. 1.2 Some of the figures
Air Connectivity and Competition
 Air Connectivity and Competition Sainarayan A Chief, Aviation Data and Analysis Section, ATB Concept of Connectivity in Air Transport Movement of passengers, mail and cargo involving the minimum of transit
Analysis of Air Transportation Systems. Airport Capacity
 Analysis of Air Transportation Systems Airport Capacity Dr. Antonio A. Trani Associate Professor of Civil and Environmental Engineering Virginia Polytechnic Institute and State University Fall 2002 Virginia
Estimates of the Economic Importance of Tourism
 Estimates of the Economic Importance of Tourism 2008-2013 Coverage: UK Date: 03 December 2014 Geographical Area: UK Theme: People and Places Theme: Economy Theme: Travel and Transport Key Points This article
PERFORMANCE AND EFFICIENCY EVALUATIONS OF INTERNATIONAL HOTELS IN TAIWAN: A COMPARISON OF TAIPEI AND SCENIC AREA
 PERFORMANCE AND EFFICIENCY EVALUATIONS OF INTERNATIONAL HOTELS IN TAIWAN: A COMPARISON OF TAIPEI AND SCENIC AREA Lung-Tan Lu Department of Management Fo Guang University, Taiwan Abstract - The aim of this
Cross-sectional time-series analysis of airspace capacity in Europe
 Cross-sectional time-series analysis of airspace capacity in Europe Dr. A. Majumdar Dr. W.Y. Ochieng Gerard McAuley (EUROCONTROL) Jean Michel Lenzi (EUROCONTROL) Catalin Lepadatu (EUROCONTROL) 1 Introduction
HOW TO IMPROVE HIGH-FREQUENCY BUS SERVICE RELIABILITY THROUGH SCHEDULING
 HOW TO IMPROVE HIGH-FREQUENCY BUS SERVICE RELIABILITY THROUGH SCHEDULING Ms. Grace Fattouche Abstract This paper outlines a scheduling process for improving high-frequency bus service reliability based
2009 Muskoka Airport Economic Impact Study
 2009 Muskoka Airport Economic Impact Study November 4, 2009 Prepared by The District of Muskoka Planning and Economic Development Department BACKGROUND The Muskoka Airport is situated at the north end
The Economic Impact of Tourism Eastbourne Prepared by: Tourism South East Research Unit 40 Chamberlayne Road Eastleigh Hampshire SO50 5JH
 The Economic Impact of Tourism Eastbourne 2016 Prepared by: Tourism South East Research Unit 40 Chamberlayne Road Eastleigh Hampshire SO50 5JH CONTENTS Page 1. Summary of Results 1 1.1 Introduction 1 1.2
Technical Efficiency in International Air Transport
 MPRA Munich Personal RePEc Archive Technical Efficiency in International Air Transport Panayotis G. Michaelides and Athena Belegri-Roboli and Theocharis Marinos National Technical University of Athens
UNDERSTANDING TOURISM: BASIC GLOSSARY 1
 UNDERSTANDING TOURISM: BASIC GLOSSARY 1 Tourism is a social, cultural and economic phenomenon related to the movement of people to places outside their usual place of residence pleasure being the usual
The Future of Aviation in Northern Europe
 The Future of Aviation in Northern Europe IC Aviation, March 11-12, 2014 State Aid to Airports and Airlines: The European Commission s new Aviation Guidelines George Metaxas Partner, Oswell & Vahida www.ovlaw.eu
REAUTHORISATION OF THE ALLIANCE BETWEEN AIR NEW ZEALAND AND CATHAY PACIFIC
 Chair Cabinet Economic Growth and Infrastructure Committee Office of the Minister of Transport REAUTHORISATION OF THE ALLIANCE BETWEEN AIR NEW ZEALAND AND CATHAY PACIFIC Proposal 1. I propose that the
Measuring Airline Networks
 Measuring Airline Networks Chantal Roucolle (ENAC-DEVI) Joint work with Miguel Urdanoz (TBS) and Tatiana Seregina (ENAC-TBS) This research was possible thanks to the financial support of the Regional Council
American Airlines Next Top Model
 Page 1 of 12 American Airlines Next Top Model Introduction Airlines employ several distinct strategies for the boarding and deboarding of airplanes in an attempt to minimize the time each plane spends
Airline Operating Costs Dr. Peter Belobaba
 Airline Operating Costs Dr. Peter Belobaba Istanbul Technical University Air Transportation Management M.Sc. Program Network, Fleet and Schedule Strategic Planning Module 12: 30 March 2016 Lecture Outline
7. Demand (passenger, air)
") 7. Demand (passenger, air) Overview Target The view is intended to forecast the target pkm in air transport through the S-curves that link the GDP per capita with the share of air transport pkm in the
7. Demand (passenger, air) Overview Target The view is intended to forecast the target pkm in air transport through the S-curves that link the GDP per capita with the share of air transport pkm in the
The Economic Impact of Tourism on Scarborough District 2014
 The Economic Impact of Tourism on Scarborough District 2014 Prepared by: Tourism South East Research Unit 40 Chamberlayne Road Eastleigh Hampshire SO50 5JH CONTENTS 1. Summary of Results 1 2. Table of
Performance monitoring report for 2014/15
 Performance monitoring report for 20/15 Date of issue: August 2015 Gatwick Airport Limited Summary Gatwick Airport is performing well for passengers and airlines, and in many aspects is ahead of the performance
Paper presented to the 40 th European Congress of the Regional Science Association International, Barcelona, Spain, 30 August 2 September, 2000.
 Airline Strategies for Aircraft Size and Airline Frequency with changing Demand and Competition: A Two-Stage Least Squares Analysis for long haul traffic on the North Atlantic. D.E.Pitfield and R.E.Caves
International Journal of Hospitality Management
 International Journal of Hospitality Management 29 (2010) 99 107 Contents lists available at ScienceDirect International Journal of Hospitality Management journal homepage: www.elsevier.com/locate/ijhosman
1-Hub or 2-Hub networks?
 1-Hub or 2-Hub networks? A Theoretical Analysis of the Optimality of Airline Network Structure Department of Economics, UC Irvine Xiyan(Jamie) Wang 02/11/2015 Introduction The Hub-and-spoke (HS) network
A Macroscopic Tool for Measuring Delay Performance in the National Airspace System. Yu Zhang Nagesh Nayak
 A Macroscopic Tool for Measuring Delay Performance in the National Airspace System Yu Zhang Nagesh Nayak Introduction US air transportation demand has increased since the advent of 20 th Century The Geographical
The Economic Impact of Tourism on Calderdale Prepared by: Tourism South East Research Unit 40 Chamberlayne Road Eastleigh Hampshire SO50 5JH
 The Economic Impact of Tourism on Calderdale 2015 Prepared by: Tourism South East Research Unit 40 Chamberlayne Road Eastleigh Hampshire SO50 5JH CONTENTS 1. Summary of Results 1 2. Table of Results Table
CRUISE ACTIVITY IN BARCELONA. Impact on the Catalan economy and socioeconomic profile of cruise passengers (2014)
") CRUISE ACTIVITY IN BARCELONA Impact on the Catalan economy and socioeconomic profile of cruise passengers (2014) 2 CRUISE ACTIVITY IN BARCELONA 2014 Impact on the Catalan economy and socioeconomic profile
CRUISE ACTIVITY IN BARCELONA Impact on the Catalan economy and socioeconomic profile of cruise passengers (2014) 2 CRUISE ACTIVITY IN BARCELONA 2014 Impact on the Catalan economy and socioeconomic profile
THE EFFICIENCY MODEL OF THE AIRPORT INDUSTRY CASE STUDY OF AENA. Ane Elixabete Ripoll Zarraga. Beques Convocatòria 2008
 THE EFFICIENCY MODEL OF THE AIRPORT INDUSTRY CASE STUDY OF AENA Ane Elixabete Ripoll Zarraga Beques Convocatòria 2008 Papers EURAM Institut d economia i empresa Ignasi Villalonga Abstract This paper focuses
The Economic Impact of Tourism Brighton & Hove Prepared by: Tourism South East Research Unit 40 Chamberlayne Road Eastleigh Hampshire SO50 5JH
 The Economic Impact of Tourism Brighton & Hove 2013 Prepared by: Tourism South East Research Unit 40 Chamberlayne Road Eastleigh Hampshire SO50 5JH CONTENTS 1. Summary of Results 1 1.1 Introduction 1 1.2
ASSESSMENT OF EFFICIENCY OF GREEK AIRPORTS
 ASSESSMENT OF EFFICIENCY OF GREEK AIRPORTS Voula Psaraki -Kalouptsidi Sofia Kalakou Faculty of Civil Engineering, National Technical University of Athens, 5 Iroon Polytechniou Street, Zografou Campus,
A COMPARITIVE ANALYSIS OF AIRLINES EFFICIENCY: EVIDENCE FROM MIDDLE EAST AND NORTH AFRICA
 A COMPARITIVE ANALYSIS OF AIRLINES EFFICIENCY: EVIDENCE FROM MIDDLE EAST AND NORTH AFRICA Mostafa Kazemi Associate Prof. Department of Management, Ferdowsi University of Mashhad Iran kazemi@um.ac.ir Amirhossein
Statistical Evaluation of Seasonal Effects to Income, Sales and Work- Ocupation of Farmers, the Apples Case in Prizren and Korça Regions
 Abstract Statistical Evaluation of Seasonal Effects to Income, Sales and Work- Ocupation of Farmers, the Apples Case in Prizren and Korça Regions PhD. Eriona Deda Faculty of Economics and Agribusiness,
Performance Indicator Horizontal Flight Efficiency
 Performance Indicator Horizontal Flight Efficiency Level 1 and 2 documentation of the Horizontal Flight Efficiency key performance indicators Overview This document is a template for a Level 1 & Level
Report on Geographic Scope of Market-based Measures (MBMS)
") Report on Geographic Scope of Market-based Measures (MBMS) Analysis of proposed approaches for the coverage of international aviation emissions under a market-based measure This report is intended to address
Report on Geographic Scope of Market-based Measures (MBMS) Analysis of proposed approaches for the coverage of international aviation emissions under a market-based measure This report is intended to address
Measuring the Business of the NAS
 Measuring the Business of the NAS Presented at: Moving Metrics: A Performance Oriented View of the Aviation Infrastructure NEXTOR Conference Pacific Grove, CA Richard Golaszewski 115 West Avenue Jenkintown,
FLIGHT SCHEDULE PUNCTUALITY CONTROL AND MANAGEMENT: A STOCHASTIC APPROACH
 Transportation Planning and Technology, August 2003 Vol. 26, No. 4, pp. 313 330 FLIGHT SCHEDULE PUNCTUALITY CONTROL AND MANAGEMENT: A STOCHASTIC APPROACH CHENG-LUNG WU a and ROBERT E. CAVES b a Department
Congestion. Vikrant Vaze Prof. Cynthia Barnhart. Department of Civil and Environmental Engineering Massachusetts Institute of Technology
 Frequency Competition and Congestion Vikrant Vaze Prof. Cynthia Barnhart Department of Civil and Environmental Engineering Massachusetts Institute of Technology Delays and Demand Capacity Imbalance Estimated
Analysis of ATM Performance during Equipment Outages
 Analysis of ATM Performance during Equipment Outages Jasenka Rakas and Paul Schonfeld November 14, 2000 National Center of Excellence for Aviation Operations Research Table of Contents Introduction Objectives
Directional Price Discrimination. in the U.S. Airline Industry
 Evidence of in the U.S. Airline Industry University of California, Irvine aluttman@uci.edu June 21st, 2017 Summary First paper to explore possible determinants that may factor into an airline s decision
Appraisal of Factors Influencing Public Transport Patronage in New Zealand
 Appraisal of Factors Influencing Public Transport Patronage in New Zealand Dr Judith Wang Research Fellow in Transport Economics The Energy Centre The University of Auckland Business School, New Zealand
Draft Concept Alternatives Analysis for the Inaugural Airport Program September 2005
 Draft Concept Alternatives Analysis for the Inaugural Airport Program September 2005 Section 3 - Refinement of the Ultimate Airfield Concept Using the Base Concept identified in Section 2, IDOT re-examined
MEASURING ACCESSIBILITY TO PASSENGER FLIGHTS IN EUROPE: TOWARDS HARMONISED INDICATORS AT THE REGIONAL LEVEL. Regional Focus.
 Regional Focus A series of short papers on regional research and indicators produced by the Directorate-General for Regional and Urban Policy 01/2013 SEPTEMBER 2013 MEASURING ACCESSIBILITY TO PASSENGER
I R UNDERGRADUATE REPORT. National Aviation System Congestion Management. by Sahand Karimi Advisor: UG
 UNDERGRADUATE REPORT National Aviation System Congestion Management by Sahand Karimi Advisor: UG 2006-8 I R INSTITUTE FOR SYSTEMS RESEARCH ISR develops, applies and teaches advanced methodologies of design
UC Berkeley Working Papers
 UC Berkeley Working Papers Title The Value Of Runway Time Slots For Airlines Permalink https://escholarship.org/uc/item/69t9v6qb Authors Cao, Jia-ming Kanafani, Adib Publication Date 1997-05-01 escholarship.org
Peter Forsyth, Monash University Conference on Airports Competition Barcelona 19 Nov 2012
 Airport Competition: Implications for Regulation and Welfare Peter Forsyth, Monash University Conference on Airports Competition Barcelona 19 Nov 2012 1 The Issue To what extent can we rely on competition
SHIP MANAGEMENT SURVEY. January June 2018
 CENTRAL BANK OF CYPRUS EUROSYSTEM SHIP MANAGEMENT SURVEY January June 2018 INTRODUCTION The Ship Management Survey (SMS) is conducted by the Statistics Department of the Central Bank of Cyprus and concentrates