Safety 2010: A marginal average year in global Aviation Safety
|
|
|
- Nicholas Jackson
- 5 years ago
- Views:
Transcription
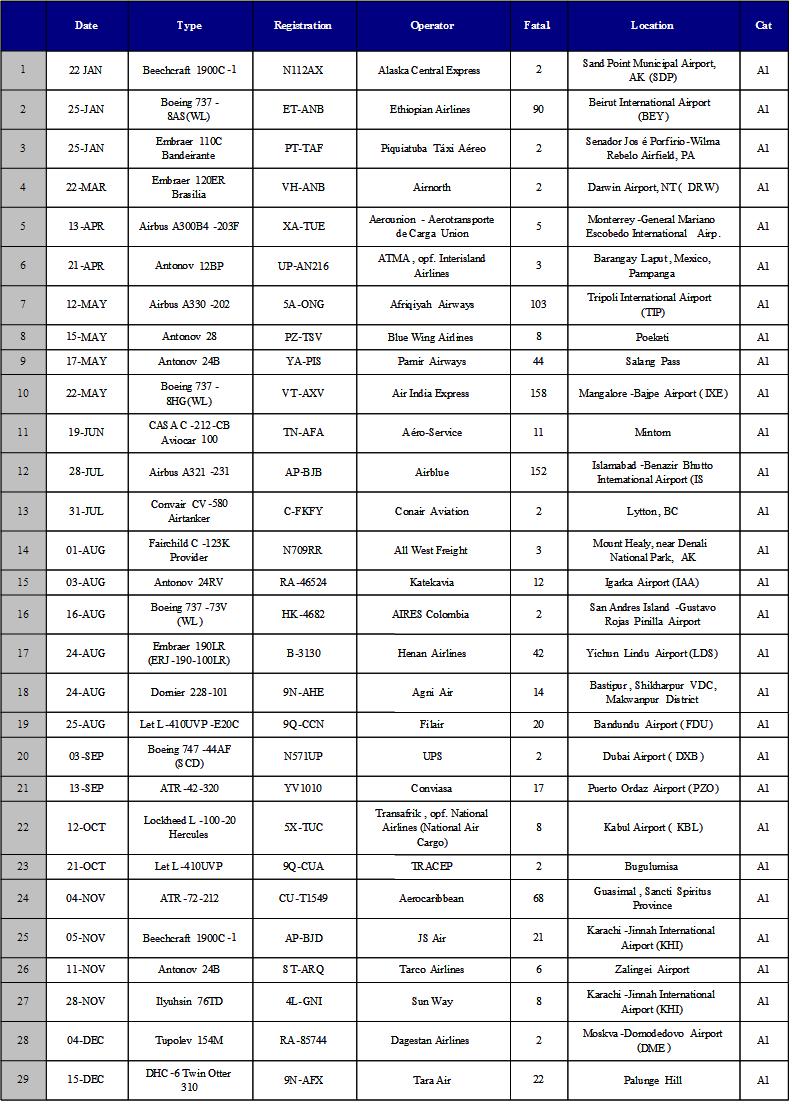
1 Safety 2: A marginal average year in global Aviation Safety The year 2 was one of the best in aviation in terms of safety; however, as shown by the Safety Survey 2 data, runway safety remains a top priority. Runway excursion was the most common type of accident last year and the cause of the worst accident in terms of fatalities. ICAO has teamed up with key players to tackle runway safety issues and further improve the industry's already impressive safety record. Overview Nancy J. Graham, Director, Air Navigation Bureau, ICAO The following report presents a global Aviation Safety Analysis for calendar year 2 1. In absolute IATA numbers more than 2.4 billion people flew safely on 36.8 million flights 2. However, according to Flight Safety Foundation (FSF), during 2 a total of 134 hull loss multi-engine civil airlines accidents/occurrences (fatal and non fatal) were recorded. In particular, 29 fatal accidents were confirmed accompanied by 831 fatalities plus 6 casualties on ground. The following Table 1 presents the 29 fatal accident s breakdown with some additional general remarks: TABLE 1 Year 2 3 : A fatal hull loss multi engine civil airlines accident s breakdown and additional remarks Fatal accidents according to flight phase Fatal accidents according to flight nature Additional General Remarks 4 Take off 15 Scheduled passenger 5 fatal corporate jet accidents/18 fatalities 5 Initial Climb 2 Non scheduled passenger 85 Rwy excursions / 3 fatal Enroute 8 Cargo 1 attempted hijacking 9 Approach 1 Ferry/Positioning criminal occurrences 5 Landing Training About 2. bird strikes 3 Other Lowest ever accident rate for Western-built jet a/c 5 Worst fatal hull loss accident for 2 The worst accident for 2 occurred on 22 May 2 when a B737-8 of Air India Express overran the runway at Mangalore Bajpe Airport (IXE), India. In total 158 people were killed. This accident was rated as the worst ever accident involving a B737-8 and the 4th in severity global accident in the landing phase. 6 Compared to the ten year worldwide average 9 (i.e. 31 fatal accidents / 8 fatalities), in the year 2 there has been a marginal - close to average - stability for aviation safety (i.e. 29 fatal accidents / 831 fatalities). The following chapters I, II and III present a more detailed FSF s statistical analysis of the year 2 mirrored with last decade s fatal accidents/occurrences while chapter IV adds an IATA s fruitful perspective. I. Statistical Information regarding the global aviation safety data 1 Military accidents, corporate jets, hijackings (and/or other criminal occurrences) are not included in the retrieved data. 2 IATA, News press release No, 23 February 21, available at 3 Data s Source: Aviation Safety Network, an exclusive service of Flight Safety Foundation, available at accessed at 4- March, 2. 4 Data based on NLR- Air Transport Safety Institute s database and includes military accidents, corporate jets, hijackings (and/or other criminal occurrences). 5 IATA, ibid. 6 Including criminal occurrences and excluding ground fatalities/collision fatalities.
2 Moving Average Moving Average loss Fatalities 2 has been another short of average safety year. This is not bad but it s a bit of a concern. We started a trend of improvement and we need to pay attention and see why we get better and how we need to continue to get better, at the same time. a. Overall Data for years -2 William R. Voss, President and CEO, Flight Safety Foundation The following table and charts present useful statistical information regarding the global aviation safety. The overall data of worldwide fatal airliner hull-loss accidents and fatalities per year (-2) are presented in Table 2. The data do not include corporate jet and military transport accidents. TABLE 2 Fatal Airliner Hull loss accidents and fatalities per year (-2) Fatalities b. Run Charts for years -2 The run charts in the following figures 1 and 2 respectively illustrate the airliner fatal hull loss accidents and fatalities for the years -2. Run Chart of airliner fatal hull loss accidents per year Run Chart of airlines fatalities per year Observation Years Observation Years -2 Figure 1: Airliner Hull Accidents Figure 2: Airliner Fatalities c. Moving Average Charts for years -2 The next moving average charts illustrate that the worldwide airliner fatal hull loss accidents and fatalities for year 2 are very close to the moving average of 3.55 accidents and 812 fatalities for the years -2, as shown in figures 3 and 4 respectively. Moving Average Chart of airlines fatal hull loss accidents per year 5 4 UCL=38, Moving Average Chart of Airliner fatalities per year UCL= _ X=3,55 LCL=22, 8 6 _ X= Sample Years Sample Years -2 LCL=97
3 Fatal hull loss Fatalities Figure 3: Airliner Hull Accidents Average Figure 4: Airliner Fatalities Average d. Trend Analysis Plots for years -2 The following trend analysis plots in figures 5 and 6 illustrate respectively a continuing declined slope for worldwide airliner fatal hull loss accidents and fatalities for the years - 2. Trend Analysis Plot for airlines fatal hull loss accidents per year Trend Analysis Plot for airlines fatalities per year 37,5 35, ,5 8 3, ,5 5 25, Index Years Index Years -2 Figure 5: Trend Analysis - Hull Accidents Figure 6: Trend Analysis - Fatalities II. Statistical Information on global aviation safety according to flight phase In terms of accidents rates, 2 was one of the best years for Europe and Airlines. But this is not enough. We have seen a significant improvement in the relationship between airlines and EASA. And that is extremely important as well. a. Statistical Information regarding the Take Off flight phase Ulrich Schulte-Strathaus, Secretary General of AEA i. Overall Data / Take Off The following table and plots present useful statistical information regarding the Take Off flight phase. The overall data of worldwide fatal airliner hull-loss accidents and fatalities at Take Off flight phase per year (-2) are presented in Table 3. The data do not include corporate jet and military transport accidents. TABLE 3 Fatal Airliner Hull loss accidents and fatalities per year (-2), regarding the Take Off flight phase Fatalities ii. Trend Analysis Plots / Take Off Besides, the next figures 7 and 8 illustrate respectively the trend analysis plots of worldwide airliner fatal hull loss accidents and fatalities regarding the Take Off flight phase, for years -2.
4 loss - Initial Climb phase Fatalities - Initial Climb phase loss - Take off Fatalities during Take off Trend Analysis Plot for airlines fatal hull loss - Take off phase Trend Analysis Plot for airlines fatalities during Take off phase Index Years Index Years -2 Figure 7: Accidents Take Off Figure 8: Fatalities Take Off b. Statistical Information regarding the Initial Climb flight phase i. Overall Data / Initial Climb The following table and plots present useful statistical information regarding the Initial Climb flight phase. The overall data of worldwide fatal airliner hull-loss accidents and fatalities at Initial Climb flight phase per year (-2) are presented in Table 4. The data do not include corporate jet and military transport accidents. TABLE 4 Fatal Airliner Hull loss accidents and fatalities per year (-2), regarding the Initial Climb flight phase Fatalities ii. Trend Analysis Plots Initial Climb The following figures 9 and illustrate respectively the trend analysis plots of worldwide airliner fatal hull loss accidents and fatalities regarding the Initial Climb flight phase, for years -2. Trend Analysis Plot for airlines fatal hull loss - Initial Climb phase Trend Analysis Plot for airlines fatalities during Initial Climb phase Index Years Index Years -2 Figure 9: Accidents Initial Climb Figure : Fatalities Initial Climb c. Statistical Information regarding the Enroute flight phase i. Overall Data / Enroute The following table and plots present useful statistical information regarding the Enroute flight phase. The overall data of worldwide fatal airliner hull-loss accidents and fatalities at Initial
5 loss - Enroute phase Fatalities - Enroute phase Climb flight phase per year (-2) are presented in Table 5. The data do not include corporate jet and military transport accidents. TABLE 5 Fatal Airliner Hull loss accidents and fatalities per year (-2), regarding the Enroute flight phase Fatalities ii. Trend Analysis / Enroute The following figures 11 and 12 illustrate respectively the trend analysis plots of worldwide airliner fatal hull loss accidents and fatalities regarding the Enroute flight phase, for years -2. Trend Analysis Plot for airlines fatal hull loss - Enroute phase Trend Analysis Plot for airlines fatalities - Enroute phase Index Years Index Years -2 Figure 11: Accidents Enroute Figure 12: Fatalities Enroute d. Statistical Information regarding the Approach flight phase i. Overall Data / Approach The following table and plots presents useful statistical information regarding the Approach flight phase. The overall data of worldwide fatal airliner hull-loss accidents and fatalities at Approach flight phase per year (-2) are presented in Table 6. The data does not include corporate jet and military transport accidents. TABLE 6 Fatal Airliner Hull loss accidents and fatalities per year (-2), regarding the Approach flight phase Fatalities ii. Trend Analysis Plots / Approach Besides, the next figures 13 and 14 illustrate respectively the trend analysis plots of worldwide airliner fatal hull loss accidents and fatalities regarding the Approach flight phase, for years -2.
6 loss - Landing phase Fatalities - Landing phase loss - Approach phase Fatalities - Approach phase Trend Analysis Plot for airlines fatal hull loss - Approach phase Trend Analysis Plot for airlines fatalities - Approach phase Index Years Index Years -2 Figure 13: Accidents Approach Figure 14: Fatalities Approach e. Statistical Information regarding the Landing flight phase i. Overall Data / Landing The following table and plots presents useful statistical information regarding the Landing flight phase. The overall data of worldwide fatal airliner hull-loss accidents and fatalities at Landing flight phase per year (-2) are presented in Table 7. The data does not include corporate jet and military transport accidents. TABLE 7 Fatal Airliner Hull loss accidents and fatalities per year (-2), regarding the Landing flight phase Fatalities ii. Trend Analysis Plots / Landing Besides, the next figures 15 and 16 illustrate respectively the trend analysis plots of worldwide airliner fatal hull loss accidents and fatalities regarding the Landing flight phase, for years -2. Trend Analysis Plot for airlines fatal hull loss - Landing phase Trend Analysis Plot for airlines fatalities - Landing phase Index Years Index Years -2 Figure 15: Accidents Landing Figure 16: Fatalities Landing III. Statistical Information on global aviation safety according to flight nature 7 2 was a very important year for aviation safety and marked a corner in safety approaches. We tried to leave behind the reactive way of doing things and by a continuous monitoring we managed to approach another more proactive way to do things. At the European level, we will 7 Due to small data numbers Ferry/Positioning and Training flight nature accidents are not statistically examined.
7 Fatal hull loss - Scheduled flight Fatalities - Scheduled Flight continue to work closely with the authorities in order to integrate all safety aspects in all 44 ECAC members Catalin Radu, Pesident of ECAC a. Statistical Information regarding the Domestic & International Scheduled Passenger flight accidents. i. Overall Data / Domestic and International Scheduled Passenger The following table and plots present useful statistical information regarding the Domestic & International Scheduled Passenger flight accidents. The overall data of worldwide fatal airliner hull-loss accidents and fatalities of this nature per year (-2) are presented in Table 8. The data do not include corporate jet and military transport accidents. TABLE 8 Fatal Airliner Hull loss accidents and fatalities per year (-2), regarding the Domestic & International Scheduled Passenger flight accidents Fatalities ii. Trend Analysis Plots / Domestic and International Scheduled Passenger Besides, the next figures 17 and 18 illustrate respectively the trend analysis plots of worldwide airliner fatal hull loss accidents and fatalities regarding the Domestic & International Scheduled Passenger flight accidents, for years -2. Trend Analysis Plot for airlines fatal hull loss - Scheduled passenger flight Trend Analysis Plot for airlines fatalities - Scheduled passenger flight Index Years Index Years -2 Figure 17: Accidents Scheduled Figure 18: Fatalities Scheduled b. Statistical Information regarding the Domestic & International Non Scheduled Passenger flight accidents. i. Overall Data / Domestic and International Non Scheduled Passenger The following table and plots present useful statistical information regarding the Domestic & International Non Scheduled Passenger flight accidents. The overall data of worldwide fatal airliner hull-loss accidents and fatalities of this nature per year (-2) are presented in Table 9. The data do not include corporate jet and military transport accidents.
8 Fatal hull loss - Non Scheduled Flight Fatalities - Non Scheduled Flight TABLE 9 Fatal Airliner Hull loss accidents and fatalities per year (-2), regarding the Domestic & International Non Scheduled Passenger flight accidents Fatalities ii. Trend Analysis Plots / Domestic and International Non Scheduled Passenger The next figures 19 and 2 illustrate respectively the trend analysis plots of worldwide airliner fatal hull loss accidents and fatalities regarding the Domestic & International Non Scheduled Passenger flight accidents, for years -2. Trend Analysis Plot for airlines fatal hull loss - Non Scheduled Flight Trend Analysis Plot for airlines fatalities - Non Scheduled Flight Index Years Index Years -2 Figure 19: Accidents Non Scheduled Figure 2: Fatalities Non Scheduled c. Statistical Information regarding Cargo flight accidents. i. Overall Data / Cargo The following table and plots present useful statistical information regarding the Cargo flight accidents. The overall data of worldwide fatal airliner hull-loss accidents and fatalities of this nature per year (-2) are presented in Table. The data not include corporate jet and military transport accidents. TABLE Fatal Airliner Hull loss accidents and fatalities per year (-2), regarding the Cargo flight accidents Fatalities ii. Trend Analysis Plots / Cargo The next figures 21 and 22 illustrate respectively the trend analysis plots of worldwide airliner fatal hull loss accidents and fatalities regarding the Cargo flight accidents, for years - 2.
9 Fatal hull loss - Cargo Flight Fatalities - Cargo Flight Trend Analysis Plot for airlines fatal hull loss - Cargo Flight Trend Analysis Plot for airlines fatalities - Cargo Flight Index Years Index Years -2 Figure 21: Accidents Cargo Figure 22: Fatalities Cargo IV. An IATA s fruitful perspective for Western-built jet aircraft 8 Aviation continues to be a very safe mode of transportation. However, we have to keep the highest level of safety possible. We have to continue to work for making a safe mode of transportation, even safer. a. Overview analysis Andre Auer, Aviation Consultant The International Air Transport Association (IATA) announced on 23 Feb 21 the aviation safety performance for 2 showing that the year s accident rate has been the lowest in aviation history. With a total of 94 accidents/occurrences, the following Table 11 presents the final IATA s aviation safety perspectives of year 2 along with a short comparison with the previous year, 9. TABLE 11 IATA s absolute numbers Accident s breakdown Hull loss accidents for Western built jet aircraft Total Accidents (Eastern and Western built) Fatal accidents (all aircraft types) Year 2 Year Fatalities IATA members accidents IATA members hull loss rate Runway excursions (of all accidents) % 26% 8 IATA Global Safety International Center (GSIC), available at accessed March 11,21.
. The 2 rate was the lowest in aviation history, just below the 6 rate of.65.")
10 In addition, the 2 global accident rate 9 (measured in hull losses per million flights) was.61. That is equal to one accident for every 1.6 million flights. This is a significant improvement from the.71 rate recorded in 9 (one accident for 1.4 million flights). The 2 rate was the lowest in aviation history, just below the 6 rate of.65. Compared to that of years ago, the accident rate has been cut by 42% from the rate recorded in 1. A hull loss is an accident in which the aircraft is destroyed or substantially damaged and is not subsequently repaired. Last, but not least, runway excursions were once again the most common cause of accidents, accounting for 21% of all accidents in 2 (vs. 26% in 9). b. Regional perspective The following figure 23 presents the regional differences in the Western built jet hull loss accident rates. Figure 23: Regional differences in the Western built jet hull loss accident rate While showing improvement, Africa once again has the worst rate in the world. There were four Western-built jet hull losses with African carriers in 2. African carriers are 2% of global traffic, but 23% of global western-built jet hull losses. On the other hand, operators based in North America and Europe recorded no IATA member fatalities in 2 during passenger operations. Conclusions 2 was the safest year ever in Europe. No commercial accident happened in Europe for first time in forty years Patrick Goudou, Executive Director of EASA Although the tables, charts and plots speak quite clearly a couple of comments are worth point out for the year 2 (by number of fatal accidents): Overall, airliner aviation safety has achieved a marginal, close to average, stability regarding -9 accident averages. According to Flight Safety Foundation the year 2 was the 6th safest year since 1945, by number of fatal accidents. According to IATA the year 2 was the safest year ever by total accident s rate. The estimated -2 average is 3.55 fatal multi-engine civil airliner accidents, resulting in an average of 812 fatalities. There is a marginal fatal accident rate improvement (worldwide). 9 The intention of the flight is limited to normal commercial aviation activities, specifically scheduled/charter passenger or cargo service. Executive jet operations, positioning or maintenance/test flights are all excluded. multi-engine, turbine powered, and has a certificated Maximum Take-Off Weight (MTOW) of at least 5,7KG (12,54 lbs) for Turboprops and 15,KG (33, lbs) for Jets. IATA s GSIC, ibid.
11 Fatal accidents are slightly down but unfortunately fatalities are up. However, the overall safety trend is improving. About 1 airliner fatal accident happened for every 1.3 million flights worldwide 11. A significant (34%) percentage of accidents occurred on the landing flight phase. Therefore, the overall -2 trend is continuing to go up. Although the approach s flight phase trend is still going downwards, both fatal accidents and fatalities numbers are going up. Although cargo fatal accidents and fatalities are down the trend is still remaining upwards. More than 5% of fatal accidents occurred with scheduled passenger flights. Initial climb accidents/fatalities trend continue to keep a steady uphill slope. In only one country (i.e. Pakistan) 3 out of the 29 fatal hull loss accidents occurred with 181 fatalities plus 4 ground casualties in total. Only one airliner fatal accident occurred in Europe. Europe still remains the safest civil airliner continent while Africa once again has the worst rate record in the world. Runway excursions were once again the most common cause of accidents (fatal, non fatal and by number of casualties, all included) 18% of the total number of accidents involved Western-built Jet Hull es. 22% of the total numbers of accidents/occurrences (out of 134 worldwide hull loss multi-engine civil airlines) were fatal. The IATA-member rate for all accidents is 1.5 compared to the rate for non-iata members of 3.51 (executive jet operations, positioning or maintenance/test flights are all excluded) and 4.5 (executive jet operations, positioning or maintenance/test flights are all included). APPENDIX: Year 2: fatal airliner accidents by chronological order According to Ascend s annual airline safety report, Database retrieved from accessed March 12, 21.
12
An Exceptional Year in Global Aviation Safety.
 2013 An Exceptional Year in Global Aviation Safety www.atn.aero QUOTES «I am very happy that 2012 was such a good year in terms of accidents, although safety is not just the absence of accidents. With
Trend
 Fact Sheet - Safety Safety Trends Accident Overview 2009 2010 2011 2012 2013 2014 Trend Average 2009-2013 Yearly Flights (Millions)* 33.2 34.0 35.0 35.6 36.2 38.0 34.8 Total Accidents 90 94 92 75 81 73
Rates of reportable accidents were highest
 U.K. Business Jet Accident Rates Comparatively High Engine problems were the most frequent factor in serious incidents among large aircraft. BY RICK DARBY Rates of reportable accidents were highest for
From the point of view of air safety, 2015 was yet another good year.
 From the point of view of air safety, 215 was yet another good year. However, insurers did not have a good year, with incurred all-risk losses exceeding written premiums for the third year running. Insurance
2016 was yet another good year for air safety.
 216 was yet another good year for air safety. However, again, insurers did not have a good year with incurred all-risk losses exceeding written premiums for the fourth year running. Insurance All-Risk
Safety Regulation Group CAP 776. Global Fatal Accident Review
 Safety Regulation Group CAP 776 Global Fatal Accident Review 1997 2006 Civil Aviation Authority 2008 All rights reserved. Copies of this publication may be reproduced for personal use, or for use within
June 9th, 2011 Runway Excursions at Landing The n 1 Global Air Safety Issue Can We Reduce this Risk Through Innovative Avionics?
 Runway Excursions at Landing The n 1 Global Air Safety Issue Can We Reduce this Risk Through Innovative Avionics? Presented by Bill Bozin VP, Safety and Technical Affairs, Airbus Americas Agenda Safety
Bird Strike Damage Rates for Selected Commercial Jet Aircraft Todd Curtis, The AirSafe.com Foundation
 Bird Strike Rates for Selected Commercial Jet Aircraft http://www.airsafe.org/birds/birdstrikerates.pdf Bird Strike Damage Rates for Selected Commercial Jet Aircraft Todd Curtis, The AirSafe.com Foundation
Landside Safety Programs
 Landside Safety Programs Ali Ousmane Mahamane AVN 1160- Aviation Safety Spring 2013 The paper is about the landside safety programs. Landside facilities are facilities related to ground access, vehicle
ANNUAL SAFETY REVIEW
 ANNUAL SAFETY REVIEW for the year 2014 Samhæfingarsvið - Öryggisáætlanadeild Division of Coordination and facilitation Department of Safety Analysis Icelandic Transport Authority: Annual Safety Review
What is the safest means of transportation? An overview of online resources and what to make of them
 What is the safest means of transportation? An overview of online resources and what to make of them Rudy Pont 3-December-203 Table of contents About me... 2 What is the safest means of transportation?...
Nancy Graham Director, Air Navigation Bureau, ICAO
 Nancy Graham Director, Air Navigation Bureau, ICAO ICAO and its Role The International Civil Aviation Organization (ICAO) is a UN specialized agency, created in 1944 upon the signing of the Convention
ANNUAL SAFETY REVIEW. Samhæfingarsvið - Öryggisáætlanadeild Division of Coordination and facilitation Department of Safety and Promotion
 ANNUAL SAFETY REVIEW 2015 Samhæfingarsvið - Öryggisáætlanadeild Division of Coordination and facilitation Department of Safety and Promotion Icelandic Transport Authority: Annual Safety Review for the
REPORT OF THE ASIA/PACIFIC AREA TRAFFIC FORECASTING GROUP (APA TFG) FIFTEENTH MEETING BANGKOK, 1-8 NOVEMBER 2010
 FIFTEENTH MEETING BANGKOK, 1-8 NOVEMBER 2010") REPORT OF THE ASIA/PACIFIC AREA TRAFFIC FORECASTING GROUP (APA TFG) FIFTEENTH MEETING BANGKOK, 1-8 NOVEMBER 2010 Includes: Forecasts of Transpacific and Intra-Asia/Pacific Traffic to the Year 2030 Forecasts
REPORT OF THE ASIA/PACIFIC AREA TRAFFIC FORECASTING GROUP (APA TFG) FIFTEENTH MEETING BANGKOK, 1-8 NOVEMBER 2010 Includes: Forecasts of Transpacific and Intra-Asia/Pacific Traffic to the Year 2030 Forecasts
Asia Pacific Aviation
 Asia Pacific Aviation Martin Eran-Tasker Technical Director Association of Asia Pacific Airlines COSCAP-NA 18 th SCM 16-17 May 2018 Overview AAPA Asia Pacific aviation Safety Performance Safety Priorities
Status of Safety Indicators and Targets
 Status of Safety Indicators and Targets Mashhor Alblowi Regional Officer, Flight Safety ICAO Middle East Office, Cairo Directors General of Civil Aviation Middle East Region, Fourth Meeting (DGCA MID/4)
Global Runway Safety Simposium
 Global Runway Safety Simposium A DIFFERENT PERSPECTIVE OF SAFETY AND ITS RELATIONSHIP WITH SURROUNDINGS Costantino Pandolfi LIMA, 11/21/2017 Italian Civil Aviation Authority ICAO ADOP Member Panel 8 New
From the point of view of air safety, 2014 was yet another good year.
 From the point of view of air safety, 214 was yet another good year. The year 214 will probably be remembered for the shocking loss of the two Malaysia Boeing 777s one missing in the southern Indian Ocean
The Current Situation
 24-26 March 2014 Cairo, Egypt The Current Situation Session #2 Presentation #2 Wildlife and Foreign Object Debris (FOD) Workshop, Cairo, Egypt, March 24-26, 2014 Chamsou Andjorin Aviation Safety Africa
Index of business confidence. Monthly FTK (Billions) June 2012 vs. June 2011 YTD 2012 vs. YTD 2011 RPK ASK PLF FTK AFTK FLF RPK ASK PLF FTK AFTK FLF
 June 2012 vs. June 2011 YTD 2012 vs. YTD 2011 RPK ASK PLF FTK AFTK FLF RPK ASK PLF FTK AFTK FLF") Monthly RPK (Billions) Monthly FTK (Billions) Index of business confidence % change over year AIR TRANSPORT MARKET ANALYSIS JUNE 2012 KEY POINTS Air travel markets expanded in June, but the trend in passenger
Monthly RPK (Billions) Monthly FTK (Billions) Index of business confidence % change over year AIR TRANSPORT MARKET ANALYSIS JUNE 2012 KEY POINTS Air travel markets expanded in June, but the trend in passenger
ANALYSIS OF U.S. GENERAL AVIATION ACCIDENT RATES
 NLR-TR-2011-236 Executive summary ANALYSIS OF U.S. GENERAL AVIATION ACCIDENT RATES Derivation of a baseline level of safety for a set of UAS categories Problem area The introduction of civil and military
Analysis of Fatality Trends involving Civil Aviation Aircraft in Australian Airspace between 1990 and 2005
 RESEARCH DISCUSSION PAPER B2005/0388 Analysis of Fatality Trends involving Civil Aviation Aircraft in Australian Airspace between 1990 and 2005 December 2005 Published by: Australian Transport Safety Bureau
ERA Monthly Market Analysis
 ERA Monthly Market Analysis March 2018 Introduction For the production of these statistics in the following report, ERA has teamed up with partners Seabury Consulting and Innovata to provide a comprehensive
G. Glukhov The State Scientific Research Institute of Civil Aviation, Mikhalkovskaya Street, 67, building 1, Moscow, Russia
 International Journal of Civil Engineering and Technology (IJCIET) Volume 10, Issue 04, April 2019, pp. 1486 1494, Article ID: IJCIET_10_04_155 Available online at http://www.iaeme.com/ijmet/issues.asp?jtype=ijciet&vtype=10&itype=4
How much did the airline industry recover since September 11, 2001?
 Catalogue no. 51F0009XIE Research Paper How much did the airline industry recover since September 11, 2001? by Robert Masse Transportation Division Main Building, Room 1506, Ottawa, K1A 0T6 Telephone:
ERA Monthly Market Analysis
 ERA Monthly Market Analysis May 2016 Introduction For the production of these statistics in the following report, ERA has teamed up with partners Seabury and Innovata to provide a comprehensive analysis
Published in English by the INTERNATIONAL CIVIL AVIATION ORGANIZATION 999 University Street, Montréal, Quebec, Canada H3C 5H7
 Published in English by the INTERNATIONAL CIVIL AVIATION ORGANIZATION 999 University Street, Montréal, Quebec, Canada H3C 5H7 For ordering information and for a complete listing of sales agents and booksellers,
First edition 2005 Aerodrome Bird Hazard Prevention and Wildlife Management Handbook
 First edition 2005 Aerodrome Bird Hazard Prevention Authors: ACI World Operational Safety Subcommittee In collaboration with: Bureau de travaux et d études en environnement (BTEE) AIRPORTS COUNCIL INTERNATIONAL
European Aviation Safety Agency: Ottoplatz 1, D Cologne, Germany - easa.europa.eu
 Annual Safety Review 2010 Description: Annual Safety Review 2010 Language: English ISBN Number: 978-92-9210-097-1 Publication Date: 01/12/2010 Publication type: Annual Safety Review European Aviation Safety
1.0 TRAFFIC SUMAPRY 2.0 AIRCRAFT MOVEMENTS:
 1.0 TRAFFIC SUMAPRY During the month of 2010, all operational airports (taken together) handled 111.40 thousand aircraft movements (excludes general aviation movements), 11.01 million passengers and 180.10
Regional Safety Briefing
 Page /5 Regional Safety Briefing COSCAP-SA Automatically Generated by ICAO/ANB 27-2-23 Dashboard Indicator State Safety Oversight - Group Average Average USOAP Overall State Safety Oversight - State Levels
US $ 1,800 1,600 1,400 1,200 1,000
 IATA ECONOMIC BRIEFING JULY 9 INFRASTRUCTURE COSTS SUMMARY Historical data indicates that during recession periods infrastructure providers usually increase their prices while other prices are falling
3. Aviation Activity Forecasts
 3. Aviation Activity Forecasts This section presents forecasts of aviation activity for the Airport through 2029. Forecasts were developed for enplaned passengers, air carrier and regional/commuter airline
Aviation Industry Safety Update
 93333 Aviation Industry Safety Update Aviation Safety Report Intelligence, Safety and Risk Analysis Unit 1 January to 30 June 2012 1 January to ember I t lli S f t d Page 2 Table of Contents Introduction
TABLE OF CONTENTS. Washington Aviation System Plan Update July 2017 i
 TABLE OF CONTENTS Chapter 1 Overview... 1-1 1.1 Background... 1-1 1.2 Overview of 2015 WASP... 1-1 1.2.1 Aviation System Performance... 1-2 1.3 Prior WSDOT Aviation Planning Studies... 1-3 1.3.1 2009 Long-Term
AFI Flight Operations Safety Awareness Seminar (FOSAS)
") Open space to put your own picture AFI Flight Operations Safety Awareness Seminar (FOSAS) Safety awareness ICAO/Airbus Nairobi, 19-21 Sep. 2017 Safety in the past Single Engine Aircraft, Visual all weather
Open space to put your own picture AFI Flight Operations Safety Awareness Seminar (FOSAS) Safety awareness ICAO/Airbus Nairobi, 19-21 Sep. 2017 Safety in the past Single Engine Aircraft, Visual all weather
AIR TRANSPORT MARKET ANALYSIS JULY 2011
 AIR TRANSPORT MARKET ANALYSIS JULY 2011 KEY POINTS Despite an increasingly gloomy economic outlook, air travel continued to expand at a pace close to trend in July, to a level 5.9% higher than a year earlier.
AnnuAl SAfety Review easa.europa.eu
 AnnuAl SAfety Review 2011 easa.europa.eu Your safety is our mission. Overview and key facts 2011 Overview of total number of accidents and fatal accidents for EASA MS operators Aeroplanes Period Number
Happy Jetting. A Conversation With Dave Barger, President And Chief Executive Officer, JetBlue Airways, Page 14.
 A MAGAZINE FOR AIRLINE EXECUTIVES 2009 Issue No. 2 Taking your airline to new heights Happy Jetting A Conversation With Dave Barger, President And Chief Executive Officer, JetBlue Airways, Page 14. 11
Commercial Aviation Safety Team (CAST) Overview
 Overview") Commercial Aviation Safety Team (CAST) Overview PA-RAST March, 2016 In the U.S., our focus was set by the White House Commission on Aviation Safety, and The National Civil Aviation Review Commission (NCARC)
Commercial Aviation Safety Team (CAST) Overview PA-RAST March, 2016 In the U.S., our focus was set by the White House Commission on Aviation Safety, and The National Civil Aviation Review Commission (NCARC)
Runway Excursions at Landing The n 1 Source of Insurance Claims for Aviation Industry How Can We Reduce this Risk Through Innovative Avionics?
 Runway Excursions at Landing The n 1 Source of Insurance Claims for Aviation Industry How Can We Reduce this Risk Through Innovative Avionics? Presented by Fabrice VILLAUMÉ, Business Development Director
IBAC Technical Report Summary. Meeting: APANPIRG 14, Bangkok, August 4 through August 7, 2003.
 Subject: IBAC Technical Report IBAC Technical Report Summary Meeting: APANPIRG 14, Bangkok, August 4 through August 7, 2003. IBAC File: Regional PIRGS Reported by: James D. Erickson --------------- Summary:
Summary. Air transport movements. Passengers. Cargo. Other Airports. Infrastructure. Definitions. Traffic Review 2013
 TRAFFIC REVIEW 2013 Foreword The 2013 Traffic Review provides an extensive overview of Amsterdam Airport Schiphol s key traffic and transport figures. For more information about previous years, please
airportops Turbojet Differences
 Data show that almost all bird strike related hull losses of turbofan and turbojet transport aircraft worldwide occur during the departure phase of flight, when the risk of substantial engine damage is
AIR TRANSPORT MARKET ANALYSIS MAY 2011
 AIR TRANSPORT MARKET ANALYSIS MAY 2011 KEY POINTS May saw a renewed expansion in both air travel and freight, after a soft patch during the previous three months. Air travel volumes were 6.8% higher than
Disclaimer. Photocredits
 218 Disclaimer The occurrence data presented is strictly for information purposes only. It is obtained from Agency databases comprised of data from ICAO, EASA Member States, Eurocontrol and the aviation
JETNET Releases December 2017 and the Year 2017 Pre-Owned Business Jet, Business Turboprop, Helicopter, and Commercial Airliner Market Information
 PRESS RELEASE For Immediate Release JETNET Releases December 2017 and the Year 2017 Pre-Owned Business Jet, Business UTICA, NY JETNET LLC, the leading provider of aviation market information, has released
Transportation Safety and the Allocation of Safety Improvements
 Transportation Safety and the Allocation of Safety Improvements Garrett Waycaster 1, Raphael T. Haftka 2, Nam H, Kim 3, and Volodymyr Bilotkach 4 University of Florida, Gainesville, FL, 32611 and Newcastle
Commercial Aviation Safety Team
 Commercial Aviation Safety Team WHITE HOUSE COMMISSION ON AVIATION SAFETY AND THE NATIONAL CIVIL AVIATION REVIEW COMMISSION (NCARC) 1.1... Reduce Fatal Accident Rate...... Strategic Plan to Improve Safety......
Identifying the information you need. Data Collection & Analysis ayss. Amy Anderson FAA Sarah Brammell - ESA Airports Dan Hirchert - Mead & Hunt, Inc.
 Identifying the information you need Data Collection & Analysis ayss Amy Anderson FAA Sarah Brammell - ESA Airports Dan Hirchert - Mead & Hunt, Inc. Part 1: Overview of current/draft guidance and what
Regional Differences in International Airline Operating Economics: 2008 and 2009
 Cir 332 AT/191 Regional Differences in International Airline Operating Economics: 2008 and 2009 Approved by the Secretary General and published under his authority International Civil Aviation Organization
AIR PASSENGER MARKET ANALYSIS
 Monthly RPK (Billions) Monthly FTK (Billions) Index of business confidence % change over year AIR PASSENGER MARKET ANALYSIS APRIL 2013 KEY POINTS Global revenue passenger kilometers were up 3.2% in April
The Board concluded its investigation and released report A11H0002 on 25 March 2014.
 REASSESSMENT OF THE RESPONSE TO TSB RECOMMENDATION A14-01 Unstable approaches Background On 20 August 2011, the Boeing 737-210C combi aircraft (registration C GNWN, serial number 21067), operated by Bradley
Safety and Flight Operations Update
 Safety and Flight Operations Update Gilberto Lopez Meyer Senior Vice President Safety and Flight Operations 1 2018 All Accidents Overview Total Accidents 32 Total Jet Hull Losses 2 Jan Jun 2018 Total Turboprop
Regional Aviation Safety Group - Pan America (RASG-PA) Overview
 Overview") Regional Aviation Safety Group - Pan America (RASG-PA) Overview SSP Implementation GoTeam Workshop Curacao, 26-30 May 2014 Eduardo Chacin Regional Officer, Flight Safety ICAO NACC Regional Office Air transport
Regional Aviation Safety Group - Pan America (RASG-PA) Overview SSP Implementation GoTeam Workshop Curacao, 26-30 May 2014 Eduardo Chacin Regional Officer, Flight Safety ICAO NACC Regional Office Air transport
Index of business confidence. Monthly FTK (Billions) Apr 2014 vs. Apr 2013 YTD 2014 vs. YTD 2013 Apr 2014 vs. Mar 2014
 Apr 2014 vs. Apr 2013 YTD 2014 vs. YTD 2013 Apr 2014 vs. Mar 2014") AIR PASSENGER MARKET ANALYSIS APRIL 2014 KEY POINTS Growth in air travel picked-up in April, rising 7.5% compared to a year ago. This is an acceleration on March, when revenue passenger kilometers increased
AIR PASSENGER MARKET ANALYSIS APRIL 2014 KEY POINTS Growth in air travel picked-up in April, rising 7.5% compared to a year ago. This is an acceleration on March, when revenue passenger kilometers increased
Master Plan Update Technical Advisory Committee Meeting
 Nashville International Airport Master Plan Update Technical Advisory Committee Meeting February 14, 2019 Agenda Welcome and Introductions Aviation Activity Forecast Facility Requirements Alternatives
AN ANALYSIS OF AIRCRAFT ACCIDENT DATA u. s. AIR CARRIER OPERATIONS 1967
 p AN ANALYSIS OF AIRCRAFT ACCIDENT DATA u. s. AIR CARRIER OPERATIONS 1967 -" NATIONAL TRANSPORTATION SAFETY BOARD Department of Transportation Washington, D. C.-20591 December 31, 1968 TABLE OF CONTENTS
ATM in Europe It s all about Performance
 ATM in Europe It s all about Performance Facts and analysis from Performance Review World ATM Congress 2014, Madrid Xavier FRON Performance coordinator 5 March 2014 Topics ANS in aviation context European
Summary. Air transport movements. Passengers. Freight. Other Airports. Infrastructure. Definitions. Traffic Review 2016
 2016 TRAFFIC REVIEW Foreword The 2016 Traffic Review provides an extensive overview of Amsterdam Airport Schiphol s key traffic and transport figures. For information about previous years, please visit
Runway Length Analysis Prescott Municipal Airport
 APPENDIX 2 Runway Length Analysis Prescott Municipal Airport May 11, 2009 Version 2 (draft) Table of Contents Introduction... 1-1 Section 1 Purpose & Need... 1-2 Section 2 Design Standards...1-3 Section
China Southern Recruiting Terms & Conditions
 http://www.unicaviation.com/ China Southern Recruiting Terms & Conditions Airlines background information: China Southern Air Holding Company (CSAH) was established on October 11, 2002. As one of the three
IMPACT OF EU-ETS ON EUROPEAN AIRCRAFT OPERATORS
 IMPACT OF EU-ETS ON EUROPEAN AIRCRAFT OPERATORS Zdeněk Hanuš 1, Peter Vittek 2 Summary: In 2009 EU Directive 2003/87/EC for inclusion of aviation into the EU Emissions Trading Scheme (EU-ETS) came into
STATUS OF AVIATION SAFETY IN AFRICA
 STATUS OF AVIATION SAFETY IN AFRICA Nancy Graham Director, Air Navigation Bureau 23 September 2013 Page 1 Air transportation and the economy In Africa Air transport industry supported 688,000 jobs in 2010
Table of Contents. Overview Objectives Key Issues Process...1-3
 Table of Contents Chapter One Introduction Overview...1-1 Objectives...1-1 Key Issues...1-2 Process...1-3 Chapter Two Inventory of Existing Conditions Airport Setting...2-1 Locale...2-1 Airport Surroundings...2-5
Global Fatal Accident Review
 Safety Regulation Group CAP 681 Global Fatal Accident Review 1980-1996 www.caa.co.uk Safety Regulation Group CAP 681 Global Fatal Accident Review 1980-1996 Important Note The CAA has made many of the documents
Introduction to ROPS. Runway Overrun Prevention System. Presented by: Jerome JOURNADE ROPS Technical Manager
 Presented by: Jerome JOURNADE ROPS Technical Manager Introduction to ROPS Runway Overrun Prevention System Agenda 1. What is ROPS? Why is it needed 2. Overview of ROPS design 3. ROPS, a performance based
20-Year Forecast: Strong Long-Term Growth
 20-Year Forecast: Strong Long-Term Growth 10 RPKs (trillions) 8 Historical Future 6 4 2 Forecast growth annual rate 4.8% (2005-2024) Long-Term Growth 2005-2024 GDP = 2.9% Passenger = 4.8% Cargo = 6.2%
IATA ECONOMICS BRIEFING AIRLINE BUSINESS CONFIDENCE INDEX OCTOBER 2010 SURVEY
 IATA ECONOMICS BRIEFING AIRLINE BUSINESS CONFIDENCE INDEX OCTOBER SURVEY KEY POINTS Results from IATA s quarterly survey conducted in October show business conditions continued to improve during the third
Aviation Safety Information Analysis and Sharing ASIAS Overview PA-RAST Meeting March 2016 ASIAS Proprietary Do Not Distribute
 Aviation Safety Information Analysis and Sharing ASIAS Overview PA-RAST Meeting March 2016 ASIAS Proprietary Do Not Distribute Updated: March 2016 2 12 How can safety be improved in an environment of near-zero
FAA Update Society of American Military Engineers
 FAA Update Society of American Military Engineers May 8, 2013 Presented by Joseph Miniace Regional Administrator FAA Central Region Current FAA FAA Mission is to provide the safest, most efficient aerospace
AIR TRANSPORT MARKET ANALYSIS APRIL 2011
 AIR TRANSPORT MARKET ANALYSIS APRIL 2011 KEY POINTS From this month we provide an assessment of global scheduled air transport markets, adding domestic to international, and including both IATA and non-iata
Monthly Traffic Results Frankfurt Airport. February January to February absolute Δ% absolute Δ% February
 1 January 2 February 3 March 4 April 5 May 6 June 7 July 8 August 9 September 10 October 11 November 12 December Traffic category Passengers (arr.+dep.+transit) Airfreight (metric tons) (arr.+dep.+tr.)
Noise Abatement 101. July 13, Regular Board Meeting / August 7, 2014 Hillsborough County Aviation Authority
 Noise Abatement 101 July 13, 2017 1 Objectives Provide context and a better understanding for how and why flights may operate at Tampa International Airport the way they do. Provide an overview of laws,
Index of business confidence. Monthly FTK (Billions) Sep 2013 vs. Sep 2012 YTD 2013 vs. YTD 2012 Sep 2013 vs. Aug 2013
 Sep 2013 vs. Sep 2012 YTD 2013 vs. YTD 2012 Sep 2013 vs. Aug 2013") AIR PASSENGER MARKET ANALYSIS SEPTEMBER 2013 KEY POINTS Air travel markets expanded at a solid rate in September. Global revenue passenger kilometers were up 5.5% compared to a year ago. This is a slight
AIR PASSENGER MARKET ANALYSIS SEPTEMBER 2013 KEY POINTS Air travel markets expanded at a solid rate in September. Global revenue passenger kilometers were up 5.5% compared to a year ago. This is a slight
Index of business confidence. Monthly FTK (Billions) May 2014 vs. May 2013 YTD 2014 vs. YTD 2013 May 2014 vs. Apr 2014
 May 2014 vs. May 2013 YTD 2014 vs. YTD 2013 May 2014 vs. Apr 2014") AIR PASSENGER MARKET ANALYSIS MAY 2014 KEY POINTS Air travel markets rose by a strong 6.2% in May compared to a year ago. Although this is slightly down on April growth of 7.6%, April was positively biased
AIR PASSENGER MARKET ANALYSIS MAY 2014 KEY POINTS Air travel markets rose by a strong 6.2% in May compared to a year ago. Although this is slightly down on April growth of 7.6%, April was positively biased
Regional Aviation Safety Group Pan America (RASG-PA)
") Regional Aviation Safety Group Pan America (RASG-PA) 6 th Pan American Aviation Safety Summit Medellin, Colombia, 23-24 June 2015 Melvin Cintron, Oscar Derby and Gerardo Hueto RASG-PA Secretary & Co-Chairpersons
Regional Aviation Safety Group Pan America (RASG-PA) 6 th Pan American Aviation Safety Summit Medellin, Colombia, 23-24 June 2015 Melvin Cintron, Oscar Derby and Gerardo Hueto RASG-PA Secretary & Co-Chairpersons
Airline financial performance and longterm developments in air travel markets
 Airline financial performance and longterm developments in air travel markets March 2018 Brian Pearce, Chief Economist, IATA www.iata.org/economics % of invested capital Investor returns falling but above
Reducing The Risk of Runway Excursions. Jim Burin Director of Technical Programs
 Reducing The Risk of Runway Excursions Jim Burin Director of Technical Programs ALAR Updated Data 1995 through 2007 (original 1985-1996) All ALA accidents versus only fatal accidents (1,007 versus 287
The Coordinator s Activity Report
 The Coordinator s Activity Report Season : S15 Period : 29 th March 2015 24 th October 2015 Performed by: Slot Coordination Czech Republic Slot Coordination Czech Republic - 1 - Table of contents: 1. Introduction
ACTION PLAN SUMMARY I. IMPROVING TECHNICAL STANDARDS AND RELATED RULES. NOX More stringent international rules By 2001 (33 rd ICAO Assembly)
") ACTION PLAN SUMMARY AREA OBJECTIVES/TARGETS/ACTIONS TARGET DATES I. IMPROVING TECHNICAL STANDARDS AND RELATED RULES 1. Noise More stringent international standards and rules for transition By 21 (33 rd
ACTION PLAN SUMMARY AREA OBJECTIVES/TARGETS/ACTIONS TARGET DATES I. IMPROVING TECHNICAL STANDARDS AND RELATED RULES 1. Noise More stringent international standards and rules for transition By 21 (33 rd
Content. Study Results. Next Steps. Background
 Content Background Study Results Next Steps 2 ICAO role and actions in previous crisis time Background October 1973 oil crisis: oil price increased by 400% and oil production decreased by 240% Early 1974:
SSP progress in Latvia. Overview
 SSP progress in Latvia CAA of Latvia: Ms. Ērika Neimane, Head of the ATM Section, ANS Division LGS: Mr. Jānis Lapiņš, Head of Safety, Quality, Security and Audit Management airbaltic: Mr. Lauris Miķelsons,
Conclusions drawn from the Sunninghill and Sunningdale gate data provided by PA Consulting.
 Conclusions drawn from the Sunninghill and Sunningdale gate data provided by PA Consulting. Introduction. Cllr. David Hilton and Kate Mann represent the Ascot area on the Heathrow Community Noise Forum.
World Air Transport Statistics. Special AGM Edition WORLD AIR TRANSPORT SUMMIT
 World Air Transport Statistics Special AGM Edition WORLD AIR TRANSPORT SUMMIT 61 st IATA ANNUAL GENERAL MEETING TOKYO, 29-31 MAY 2005 World Air Transport Statistics Ref. No: 9011-AGM 2005 International
STATISTICS IS THE EYES OF GOVERNMENT ADMINISTRATION
 STATISTICS IS THE EYES OF GOVERNMENT ADMINISTRATION Chicago Convention 1944 establishes th obligation of ICAO(International Civil Aviatio Organization) contracting States to submit A Transport Statistics.
Airline Operating Costs Dr. Peter Belobaba
 Airline Operating Costs Dr. Peter Belobaba Istanbul Technical University Air Transportation Management M.Sc. Program Network, Fleet and Schedule Strategic Planning Module 12: 30 March 2016 Lecture Outline
ANNEX C. Maximum Aircraft Movement Data and the Calculation of Risk and PSZs: Cork Airport
 ANNEX C Maximum Aircraft Movement Data and the Calculation of Risk and PSZs: Cork Airport CONTENTS C1 INTRODUCTION C1 C2 SUMMARY OF INPUT DATA C2 C3 AIRCRAFT CRASH RATE C5 C3.1 AIRCRAFT CLASSIFICATION
Air Transport Indicators
 Air Transport Indicators Brown Bag Lunch Presentation and Discussion 1. February 2006 Heinrich C. Bofinger and Peter Roberts Why Are Measures and Indicators For Air Transport Needed? To gain understanding
PUBLIC OPINION RESEARCH SURVEY RESULTS
 PUBLIC OPINION RESEARCH SURVEY RESULTS www.floridaopinionresearch.com All Materials and Intellectual Property 2015 Florida Opinion Research @FlaOpinResearch 1 Telephone interviews performed by specially-trained
Asia Pacific Aviation
 Asia Pacific Aviation Regional Safety and Outreach Martin Eran-Tasker Technical Director Association of Asia Pacific Airlines Overview AAPA Asia Pacific aviation Safety performance Challenges Priorities
REVIEW OF PERTH AIRPORT Noise Abatement Procedures
 REVIEW OF PERTH AIRPORT Noise Abatement Procedures Contents SUMMARY... 3 Summary of Review Findings... 3 BACKGROUND... 4 Noise Abatement Procedures... 4 Perth Airport Noise Abatement Procedures... 4 Noise
LAX SPECIFIC PLAN AVIATION ACTIVITY ANALYSIS REPORT CY 2014
 LAX SPECIFIC PLAN AVIATION ACTIVITY ANALYSIS REPORT CY 2014 Prepared April 2015 Page 1 Los Angeles International Airport Specific Plan LAX Specific Plan Compliance Review Aviation Activity Analysis January
NBAA Pilot-Passenger Study 2018
 NBAA Pilot-Passenger Study 2018 Tuesday, October 16th 1 2 P.M. Presented by: David Krane, The Harris Poll Method The findings of the survey are based on interviews with both business aircraft pilots and
CHAPTER 5 AEROPLANE PERFORMANCE OPERATING LIMITATIONS
 CHAP 5-1 CHAPTER 5 PERFORMANCE OPERATING LIMITATIONS 5.1 GENERAL 5.1.1 Aeroplanes shall be operated in accordance with a comprehensive and detailed code of performance established by the Civil Aviation
3rd Quarter 2015 Minneapolis-St. Paul International Airport (MSP) Public Input Meeting
 Public Input Meeting") 3rd Quarter 2015 Minneapolis-St. Paul International Airport (MSP) Public Input Meeting Metropolitan Airports Commission Noise Program Office July 28, 2015 Meeting Goals To hear the views and concerns of
3rd Quarter 2015 Minneapolis-St. Paul International Airport (MSP) Public Input Meeting Metropolitan Airports Commission Noise Program Office July 28, 2015 Meeting Goals To hear the views and concerns of
Global commercial airline industry outlook March 2013 update
 Global commercial airline industry outlook March 213 update Brian Pearce Chief Economist www.iata.org/economics To represent, lead and serve the airline industry Monthly RPK (Billions) Monthly FTK (Billions)
ANALYST BRIEFING FINANCIAL RESULTS FOR THE QUARTER ENDED 31 ST MARCH 2012
 Malaysia Airports Holdings Berhad ANALYST BRIEFING FINANCIAL RESULTS FOR THE QUARTER ENDED 31 ST MARCH 2012 Faizal Mansor Chief Financial Officer, MAHB 26 April 2012 1 2 Table of Contents 1Q12 Review Group
2014 Yet another disappointing year
 2014 Yet another disappointing year The year 2014 was another disappointing one, with business jet aircraft experiencing the worst fatal accident rate in recent years. The accident rate for business turboprops
FAA Requirements for Engine-out Procedures and Obstacle Clearance
 FAA Requirements for Engine-out Procedures and Obstacle Clearance Presentation to: CAAC Engine-out Procedures Seminar Name: Chuck Friesenhahn Date: 11/29/2005 Flight Standards Senior Advisor, Advanced