Half Year Earnings 2009/2010
|
|
|
- Andrew Paul
- 5 years ago
- Views:
Transcription

1 Half Year Earnings 2009/2010 April 23, 2010 April 23, 2010
2 Key Events Current Operating Income of 76.5 million in the first half of 2009/2010, in line with Group forecasts The first half of the year appears a low point in the economic situation for aircraft equipment manufacturers Major advances in new commercial aircraft programs April 23,
3 Key figures millions H1 H1 2009/ /09 Revenue , % Current Operating Income % COI/Revenue 7.9% 10.4% Net Earnings % Net Debt Gearing Average transaction ( /$) April 23,
4 Quarterly sales variation shows improvement Consolidated Revenues % change reported organic Q1 Q2 H1 Q1 Q2 H1 AeroSafety & Technology -6,1% -1,2% -3,6% -3,0% +2,0% -0,4% Aircraft Systems -21,5% -29,8% -25,8% -16,6% -24,9% -20,9% Cabin Interiors -15,1% -4,2% -9,8% -9,0% +1,3% -4,1% Total Group -14,9% -10,7% -12,8% -9,7% -5,7% -7,7% April 23,


5 Contents First Half Highlights First Half Results Strategy & Outlook Calendar April 23,
6 First Half Sector highlights Air Traffic and load factor improve US enters recession Financial crisis Slowdown begins December2007/January months of negative growth Source: ID Aero march 2010 April 23,
7 First Half Sector highlights Air Traffic and dl load df factor improve Decline in Europe lags by a few months Asia Asia Fall in excess of 5% North America Source: ID Aero march 2010 April 23,
8 First Half Sector highlights Air Traffic and dl load df factor improve Source: IATA at end Feb April 23,
9 First Half Sector highlights Limited impact on large aircraft a manufacturers production rates monthly rate Pre crisis adjusted date increase date Airbus Single aisle october dec 2010 Long range 8,5 8,5 Jan. 09 "pause at 8,5" Wide (380) Boeing ,5 unchanged unchanged mid mid 2011 (vs mid 2012) mid mid 2011 (vs mid 2012) Embraer E-jets 14 7 summer 2009 Bombardier CRJ 10 April 2010: "under review" Bombardier Dash8 5 unchanged ATR -42 / unchanged April 23,


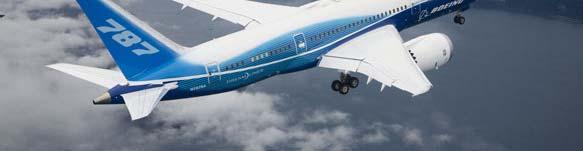
10 First Half Sector Highlights Programs update OEM production rates to increase Actual decrease or low level of production Decrease in production rate at Embraer, Airbus, Boeing, Bombardier Continuing low level of deliveries to business jets But announcements of output increases Airbus single-aisle, Boeing 777, Embraer E-jets Key program successes A400M : First flight on Dec 11, 2009 B787: First flight on Dec 15, 2009 EC175: First flight on Dec 17, 2009 B747-8: First flight on Feb 8, 2010 April 23,

 on April 20 th 4 aircraft flying 505 flight hours performed")
 866 aircraft in Boeing s order book April 23,")
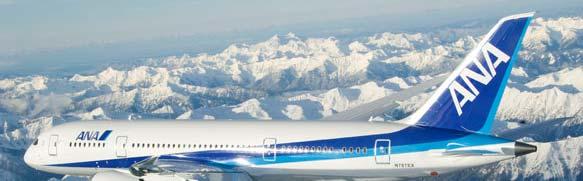
11 First Half Sector Highlights Boeing 787 Dreamliner Flight test program underway First flight on Dec 15, 2009 Boeing targeting certification for Q Ultimate load wing up-bending test completed March 28 Expanded type inspection authorization (TIA) on April 20 th 4 aircraft flying 505 flight hours performed A significant contributor for Zodiac Aerospace future sales Shipset value of $2.5m per aircraft (excluding seats) 866 aircraft in Boeing s order book April 23,
12 Aftermarket picking up Aftermarket recovers in H1 Fleet in service increasing The quarterly % change improvement indicates a strong growth in in-service fleet for FY10 Increased flying hours by the fleet in service Zodiac Services up and running In Service Commercial and Regional Fleet Trend Total commercial and regional aircraft fleet in service Q4Q1Q2Q3Q4Q1Q2Q3Q4Q1Q2Q3Q4Q1Q2 FY06 FY07 FY08 FY09 FY10 10,00% 9,00% 8,00% 7,00% 6,00% 5,00% 4,00% 3,00% 2,00% 1,00% 0,00% % change by quarter, yoy Q4 Q1 Q2 Q3 Q4 Q1 Q2 Q3 Q4 Q1 Q2 Q3 Q4 Q1 Q2 FY06 FY07 FY08 FY09 FY10 April 23, Source: ACARS


13 Aerosafety & Technology Emergency slides world leader Runway aircraft arresting systems world leader Parachutes world co-leader Rafts / floatation world leader Specialty wiring protection world leader Fuel cells, de-icers world co-leader Telemetry / mission recorders European leader Niche segments in consolidated markets Protected technologies Recognized leader in safety systems April 23,
14 Aerosafety & technology Key events millions Slight decline of sales in 200 H The decline in Aerosafety sales were compensated by 50 better sales in the Technology 0 side Lower OEM sales compensated by better aftermarket Good operating performance Some negative dollar impact COI unchanged like-for-like, despite a lower volume Airbags 200 Telemetry COI/ REV millions 21,3 COI H1 08/09 H H % 8.5% -0,9-1,3 0,1 $ $ Conversion Transaction Cap. R&D Arresting syst. Interconnect syst. Elastomers & composites Deceleration syst. Evacuation syst. Internal Growth 19,1 COI H1 09/10 April 23,
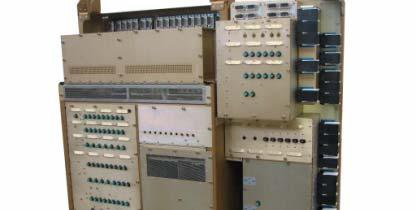
15 Aircraft Systems Electrical power management Oxygen Fuel circulation Lighting Systems Actuators for seats Windshield wipers world leader world leader top 3 worldwide top 3 worldwide world leader world leader Recognized status as a tier 1 systems provider Recognized technological leadership Involvement in all new aircraft programs April 23,
16 Aircraft Systems millions Key events A difficult H1 combining A significant decrease in revenues Business jets Regional aircraft Helicopters Defense A negative dollar impact Hydraulic & Components Actuators Power & Lighting Systems H H COI/REV 12.9% 2.6% millions Management Systems Oxygen Systems Fuel Systems H1 is the low point 38,2-0,1-9,8 1,4 0-24,1 5,7 COI H1 08/09 $ Conversion $ Transaction Cap. R&D External growth Internal Growth COI H1 09/10 April 23,
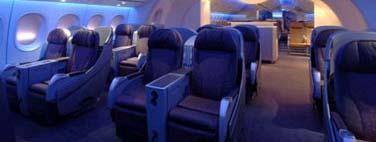
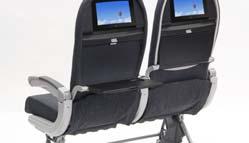
17 Cabin Interiors Cabin Interiors Turnkey Interiors world leader Waste & Water world leader Galley inserts Class dividers, composites world leader Seats Passenger seats world co-leader Technical seats Galleys & Equipment Trolleys world leader Galleys world leader for narrowbodies Recognized expertise and leadership in cabin integration and components Technical and industrial regulatory barriers to market entry Healthy market shares on the B787 and new programs April 23,
18 Cabin interiors millions Key events 577,2 Activity is mixed H1 stronger signs of market recovery in Galley Equipment Decline of production rates at some large customers, like Embraer, but further increases announced Significant improvements in the seating business millions ,5 Galleys & Equipements 400 Cabin Systems 0 H H COI/REV 9.7% 10.0% ,7-6,6 2,5 0,0 Cabin Equipements Seats 55,8 52 4,1 Good level of aftermarket 0 COI H1 08/09 $ $ Cap. R&D Conversion Transaction External growth Internal Growth COI H1 09/10 April 23,
19 A weak dollar environment in H1 1,6 1,5 /$ conversion rate 1,447 1,448 1,4 1,3 1,2 1,287 1,292 1,199 1,332 1,1 1 0,9 Feb Feb Feb Feb Feb Feb Sensitivity to US$ limited 1pp COI margin impact per 10 cts change in /$ exchange rate Partial dollar hedging in place for H2 April 23,


20 Half Year Earnings 2009/2010 Financial statements April 23,
21 Revenue Cabin interiors Aircraft Systems , Aerosafety & Technology /07 07/08 08/09 09/10 $/ * 1,292 1,447 1,332 1,448 Business volumes down -12.8% reported Downby77%like-for-like 7.7% Particularly strong decrease for Aircraft Systems (-20.9%) Aerosafety stable (-0.4%) Cabin Interiors resisted well (-4.1%) H1 appears to be low point Both Aerosafety & Technology and Cabin Interiors reported better organic growth rate in Q2 compared to H1 Aircraft Systems reached a low point April 23,
22 Current Operating Income (COI) millions COI/REV 13.5% 11.2% 10.4% 7.9% * As expected, H1 is weak Accumulation of negative items over the H1 Mixed evolution by segment Low contribution from Aircraft Systems Aerosafety & Technology resists well Cabin Interiors increases organically, owing to internal flexibility 0 H1 06/07 H1 07/08 H1 08/09 H1 09/10 $/ 1,292 1,447 1,332 1,448 * Marine excluded (22,1M ) April 23,
23 Current Operating Income (COI) millions -4,7-18, ,9 115,2 76,5 COI H1 08/09 $ Conversion $ Transaction Cap. R&D External growth Internal Growth COI H1 09/10 $/ : 1.33 (conversion) $/ : 1.45 (conversion) April 23,
24 Financial expenses millions ,2 34,8 Cash flow in line and positive WCR impact ,8 results in a lower net debt ,1 13,11 and in lower financial expenses 5 0 Feb Feb Feb Feb Feb April 23,
25 Cash flow and gearing g millions Cash Flow Gearing 120 1,6 1, ,6 98,7 92,4 89,3 1,4 1,2 1, ,8 0, , ,52 0,48 0,4 20 0,2 0 H1 05/06 H1 06/07 H1 07/08 H1 08/09 H1 09/ /06 06/07 07/08 08/09 H1 09/10 April 23,
26 Balance sheet Assets Liabilities Non Current Assets Current Assets Cash Shareholders's equity Provions + defered tax Financial debt Current liabilities Feb Feb Feb Fev 09 April 23,
27 Cash flow statement millions H1 2009/2010 H1 2008/2009 OPERATING ACTIVITIES Cash flow 69,0 89,3 Change in WCR 38,2 81,2 Cash generated from operations 107,2 8,1 INVESTING ACTIVITIES Acquisition of intangible assets 16,0 14,4 Acquisition/disposal of tangible assets and others 25,6 32,9 Acquisition/disposal of entities, net of cash acquired 7,9 20,1 Cash generated from investments 49,5 67,4 FINANCING TRANSACTIONS Change in long-term debt 21,8 142,1 Treasury stock 3,5 12,0 Other 2,5 1,5 Dividends 52,9 52,7 Cash generated from financing 75,7 78,9 Currency translation adjustments at beginning of period 5,1 4,4 Change in cash 12,9, 24,0 April 23,


28 Strategy & Outlook April 23,
29 Industry megatrends / Strong prospects Industry resists well in general despite a crisis of unprecedented severity Strong need for new aircraft Renewal of the fleet in service Additional aircraft to meet with traffic increase Source : Airbus Global Market forecast Fleet in service to increase, generating more spare parts business Incumbents advantaged by strong barriers to entry Cost of development 30 year+ program lifetime Larger packages being procured by aircraft manufacturers Increasingly gystrong and complex regulation, driven by safety concerns April 23,
30 Zodiac Aerospace Main Strengths World leadership in many key areas Balanced customer mix Global footprint Strong culture of external growth Tried and trusted technology Mastery of international certification issues Optimized Aftermarket organization April 23,


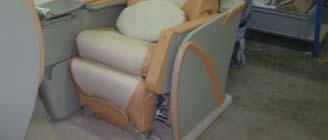
31 Focus on the Seat Market Good example of Zodiac Aerospace strategy -World leadership in niche market -With strong barrier to entry -And significant aftermarket content April 23,


32 Seat Market Market worth $ 2bn / year on estimate Around 300,000 pax/year (e) Around 2/3 OE, 1/3 refurbishing Zodiac Aerospace is world coleader Trend First Class Business class Economy / Tourist ESTIMATED TOTAL SEAT MARKET IN VALUE OEM + RETROFIT Sogerma Recaro Tourist Class Avio Geven Brice Koito Contour B/E Aerospace Zodiac Aerospace Sources: speednews, Zodiac estimates ESTIMATED TOTAL SEAT MARKET BY TYPE Spares Business Class First class Sources: speednews, Zodiac estimates April 23,


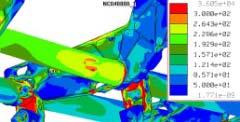
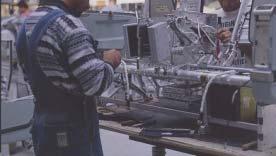

33 Complex Technology and process - Lead time: months for OEM wide-body / 9-12 months for OEM narrow-body, - Development: up to 24 months for new First or business class seats, 12 to 18 months for new economy class Example of a 12-months basic lead time for an existing gplatform 4 months 4 months 2 months 1 month 1 month April 23,
34 Outlook Improved visibility - Recovery confirmed in aftermarket - Air traffic picking up - Outlook good for key air industry programs - Zodiac confirms its target for 2009/2010 April 23,
35 Market Outlook: Better Visibility Recovery in aftermarket Fleet in service increasing Global airlines flight hours increasing Air traffic picking up Passenger and cargo Improvement in load factors Outlook good for key air industry programs Quickening pace of output, production on larger scale Airbus, Boeing production rates increase announced Good progress in the Boeing 787 certification program Boeing plans EIS for Q April 23,
36 Zodiac Aerospace Outlook H1 was low point, cumulating negative elements FY 2009/2010 target confirmed Slight organic decline in business volumes (mid single digit decrease) 8% operating profitability on assumed average /$ parity 1.50 and sensitivity of 1pp for 10 cts change The exchange rate or H2 should be better, owing to partial dollar hedge Net income trend keeps pace with current operating income growth April 23,
37 Zodiac Aerospace longer term outlook A significant supplier of current programs Will benefit from the catch up in deliveries Well positioned on all new programs Recognised as a Tier 1 supplier in all its markets Boeing 787, Airbus A350XWB, Bombardier CSeries, Irkut MC21 Structured to capture more aftermarket business The new internal organisation, Zodiac Services is up and running Ready to seize external growth opportunities, leveraging strong balance sheet structure A low level of gearing and a good cash generation Improving cost structure and decreasing exposure to dollar/euro exchange rate Lowering the transaction impact of the dollar owing to development of production in competitive cost countries, and owing to new programs April 23,
38 Timetable Date June 15, 2010 (post market) Event Q3 sales April 23,
39 April 23,
Q3 2015/2016 Sales Presentation. ZODIAC AEROSPACE Tuesday 14th June 2016
 Q3 2015/2016 Sales Presentation ZODIAC AEROSPACE Tuesday 14th June 2016 Safe Harbour statement Certain statements contained in this document are forward-looking statements. These statements includes, without
Press Release November 20, 2013
 Another year of growth Results for the 2012/13 fiscal year Zodiac Aerospace posts another year of profitable growth: Sales revenue increased by +13.1% to 3,891.6m; +7.3% increase in organic revenue 1 Current
Press Release June 13, 2013
 Zodiac Aerospace confirms its growth objectives An increase of 14.6% in sales over the first nine months of the - fiscal Plaisir, June 13, - Zodiac Aerospace recorded income of 2,836.9 million over the
Zodiac Aerospace FY 2012/2013 Results presentation. November 20, 2013
 Zodiac Aerospace FY 2012/2013 Results presentation November 20, 2013 Summary Another year of organic growth Dissymmetry of margin between H1 and H2 Pursuing the External Growth Strategy A new financing
Press release 17 September 2013
 Another year of growth for Zodiac Aerospace Sales revenue sees a 13.2% increase in - Annual sales revenue for shows a further increase of 13.2%, to 3,895.0 million - Organic growth in sales revenue up
OPERATING AND FINANCIAL HIGHLIGHTS
 Copa Holdings Reports Financial Results for the Fourth Quarter of 2015 Excluding special items, adjusted net income came in at $31.7 million, or EPS of $0.73 per share Panama City, Panama --- February
OPERATING AND FINANCIAL HIGHLIGHTS SUBSEQUENT EVENTS
 Copa Holdings Reports Financial Results for the Third Quarter of 2016 Excluding special items, adjusted net income came in at $55.3 million, or adjusted EPS of $1.30 per share Panama City, Panama --- November
OPERATING AND FINANCIAL HIGHLIGHTS. Subsequent Events
 Copa Holdings Reports Net Income of US$113.1 Million and EPS of US$2.57 for the First Quarter of 2015 Excluding special items, adjusted net income came in at US$106.0 million, or EPS of US$2.41 per share
executive summary The global commercial aircraft fleet in service is expected to increase by 80% to 45,600 aircraft in 2033 including 37,900
 executive summary The 2014 Flightglobal Fleet Forecast estimates that 36,820 new commercial jet and turboprop aircraft will be delivered into passenger and freighter airline service between 2014 and 2033.
OPERATING AND FINANCIAL HIGHLIGHTS
 Copa Holdings Reports Financial Results for the Fourth Quarter of 2018 Excluding special items, adjusted net profit came in at $44.0 million, or Adjusted EPS of $1.04 Panama City, Panama --- February 13,
OPERATING AND FINANCIAL HIGHLIGHTS SUBSEQUENT EVENTS
 Copa Holdings Reports Net Income of US$6.2 Million and EPS of US$0.14 for the Third Quarter of 2015 Excluding special items, adjusted net income came in at $37.4 million, or EPS of $0.85 per share Panama
OPERATING AND FINANCIAL HIGHLIGHTS. Subsequent Events
 Copa Holdings Reports Financial Results for the First Quarter of 2016 Excluding special items, adjusted net income came in at US$69.9 million, or EPS of US$1.66 per share Panama City, Panama --- May 5,
OPERATING AND FINANCIAL HIGHLIGHTS
 Copa Holdings Reports Net Income of US$18.6 Million and EPS of US$0.42 for the Second Quarter of 2010 Excluding special items, adjusted net income came in at $26.3 million, or $0.60 per share Panama City,
OPERATING AND FINANCIAL HIGHLIGHTS. Subsequent Events
 Copa Holdings Reports Net Income of $103.8 million and EPS of $2.45 for the Third Quarter of 2017 Excluding special items, adjusted net income came in at $100.8 million, or EPS of $2.38 per share Panama
Thank you for participating in the financial results for fiscal 2014.
 Thank you for participating in the financial results for fiscal 2014. ANA HOLDINGS strongly believes that safety is the most important principle of our air transportation business. The expansion of slots
Filton Acquisition & A350 Contract Win
 Filton Acquisition & A350 Contract Win September 2008 Filton Transaction highlights Strategic rationale compelling Long term strategic supplier relationship with Airbus Secures A350 contracts in wing composites
THIRD QUARTER RESULTS 2017
 THIRD QUARTER RESULTS 2017 KEY RESULTS In the 3Q17 Interjet total revenues added $5,835.1 million pesos that represented an increase of 22.0% over the revenue generated in the 3Q16. In the 3Q17, operating
Interim Business Report 2017
 April 1, 2017 through September 30, 2017 November 22, 2017 Contents SECTION 1 01 Consolidated Statement of Income 02 Factors Leading to Difference in Consolidated Ordinary Income Compared With Same Period
AIRBUS H Roadshow Presentation. New York July 31 st, 2017
 AIRBUS H1 2017 Roadshow Presentation New York July 31 st, 2017 H1 2017 HIGHLIGHTS 2 Healthy commercial aircraft environment; robust backlog of 6,771 a/c supports ramp-up plans H1 financials reflect delivery
FIRST QUARTER 2017 RESULTS. 4 May 2017
 FIRST QUARTER 2017 RESULTS 4 May 2017 A resilient start of the year, traffic up 4.2% 20.9 million passengers carried, up 5.2%, traffic (RPK) up 4.2%, capacity (ASK) up 3.3% and load factor up 0.7pts Confirmation
FOURTH QUARTER RESULTS 2017
 FOURTH QUARTER RESULTS 2017 KEY RESULTS In the 4Q17 Interjet total revenues added $5,824.8 million pesos that represented an increase of 10.8% over the revenue generated in the 4Q16. In the 4Q17, operating
Aircraft industry takes off while air transport remains grounded
 Aircraft industry takes off while air transport remains grounded Ludovic Subran, Chief Economist Aéronautique: l industrie en mode supersonique, le transport en mode planeur Yann Ludovic Subran, Lacroix,
Copa Holdings Reports Net Income of $49.9 million and EPS of $1.18 for the Second Quarter of 2018
 Copa Holdings Reports Net Income of $49.9 million and EPS of $1.18 for the Second Quarter of 2018 Panama City, Panama --- Aug 8, 2018. Copa Holdings, S.A. (NYSE: CPA), today announced financial results
FY RESULTS ROADSHOW PRESENTATION
 1 FY RESULTS 2014 ROADSHOW PRESENTATION FY 2014 HIGHLIGHTS FOCUS ON EXECUTION 2 Strong financial performance Revenues: 61 bn, +5% vs. 2013 EBIT* before one off: 4.1 bn, +15% vs. 2013 EPS: 2.99, +61% vs.
CONTACT: Investor Relations Corporate Communications
 NEWS RELEASE CONTACT: Investor Relations Corporate Communications 435.634.3200 435.634.3553 Investor.relations@skywest.com corporate.communications@skywest.com SkyWest, Inc. Announces Second Quarter 2017
Copa Holdings Reports Net Income of $57.7 million and EPS of $1.36 for the Third Quarter of 2018
 Copa Holdings Reports Net Income of $57.7 million and EPS of $1.36 for the Third Quarter of 2018 November 14, 2018 PANAMA CITY, Nov. 14, 2018 /PRNewswire/ -- Copa Holdings, S.A. (NYSE: CPA), today announced
Mr. Adel Al-Banwan Deputy CEO
 The 8th Forum for Listed Companies and Analysts ALAFCO Aviation Lease and Finance Co. Mr. Adel Al-Banwan Deputy CEO (18 th April 2016) ALAFCO Aviation Lease and Finance Company K.S.C.P. ALAFCO Aviation
OPERATING AND FINANCIAL HIGHLIGHTS
 Copa Holdings Reports Net Income of US$32.0 Million and EPS of US$0.72 for the Second Quarter of 2012 Excluding special items, adjusted net income came in at $58.6 million, or EPS of $1.32 per share Panama
Copa Holdings Reports Fourth Quarter and Full Year 2007 Results
 Copa Holdings Reports Fourth Quarter and Full Year 2007 Results Panama City, Panama --- February 21, 2008. Copa Holdings, S.A. (NYSE: CPA), parent company of Copa Airlines and Aero Republica, today announced
Third Quarter Results
 1 Third Quarter 2010-11 Results Highlights of the Third Quarter Passenger business affected by significant disruptions Dynamic cargo activity Strong improvement in results Decline in ex-fuel unit costs
Q3 Fiscal 2017 Statistics
 Q3 Fiscal 2017 Statistics FedEx Corporation Financial and Operating Statistics Third Quarter Fiscal 2017 February 28, 2017 This report is a statistical supplement to FedEx s interim financial reports and
INVESTOR PRESENTATION. May 2015
 INVESTOR PRESENTATION May 2015 Forward-looking Statements This presentation contains forward-looking statements within the meaning of the Private Securities Litigation Reform Act of 1995 that reflect the
Air Transport Industry
 Air Transport Industry Structure, Economics, Operations Northwestern University Transportation Center April 28, 2016 Peter L. Smith Context The Presenter BA Harvard, MST Northwestern, MBA Foster School
INVESTOR PRESENTATION. Imperial Capital Global Opportunities Conference September 2015
 INVESTOR PRESENTATION Imperial Capital Global Opportunities Conference September 2015 Forward-looking Statements This presentation contains forward-looking statements within the meaning of the Private
AIR CANADA REPORTS FIRST QUARTER RESULTS
 AIR CANADA REPORTS FIRST QUARTER RESULTS As a result of the deconsolidation of Jazz effective May 24, 2007, Air Canada s consolidated results for the first quarter of 2008 are not directly comparable to
MRO Market Update & Industry Trends
 January 25-26, 2017 Cancun, Mexico Presented by: Jonathan M. Berger Vice President ICF jberger@icf.com MRO Market Update & Industry Trends 0 Today s Agenda Fleet & MRO Forecast 2016: What a long strange
Finnair Group Interim Report 1 January 30 June 2008
 Finnair Group Interim Report 1 January 30 June 2008 1 08/08/2008 Presentation name / Author Airline industry at a historical turning point Fuel price has a stranglehold on the business Average ticket prices
First Half 2013 Results. 16 mai 2013
 First Half 2013 Results 16 mai 2013 26 July 2013 Results Increasing effects of Transform 2015 Highlights of the First Half A difficult global economic environment Transform 2015 plan roll-out on track
SkyWest, Inc. Announces First Quarter 2018 Profit
 NEWS RELEASE CONTACT: Investor Relations Corporate Communications 435.634.3200 435.634.3553 Investor.relations@skywest.com corporate.communications@skywest.com SkyWest, Inc. Announces First Quarter 2018
Copa Holdings Reports Net Income of US$113.9 Million for the Fourth Quarter of 2013
 Copa Holdings Reports Net Income of US$113.9 Million for the Fourth Quarter of 2013 Panama City, Panama --- February 12, 2014. Copa Holdings, S.A. (NYSE: CPA), today announced financial results for the
Media Release. Qantas Group Full Year 2017 Financial Result 1. Sydney, 25 August 2017
 Media Release Qantas Group Full Year 2017 Financial Result 1 Sydney, 25 August 2017 Underlying Profit Before Tax: $1,401 million (second highest in Qantas history) Statutory Profit Before Tax: $1,181 million
Q1 Fiscal 2018 Statistics
 Q1 Fiscal 2018 Statistics FedEx Corporation Financial and Operating Statistics First Quarter Fiscal 2018 September 19, 2017 This report is a statistical supplement to FedEx s interim financial reports
Copa Holdings Reports Net Income of $136.5 million and EPS of $3.22 for the First Quarter of 2018
 Copa Holdings Reports Net Income of $136.5 million and EPS of $3.22 for the First Quarter of 2018 May 9, 2018 PANAMA CITY, May 9, 2018 /PRNewswire/ -- Copa Holdings, S.A. (NYSE: CPA), today announced financial
Finnair Q Result
 Finnair Q1 2015 Result 7 May 2015 CEO Pekka Vauramo, Interim CFO Mika Stirkkinen 1 Turbulent market environment The weakness of the Finnish economy continued to be reflected in the demand in the first
FIRST QUARTER RESULTS 2017
 FIRST QUARTER RESULTS 2017 KEY RESULTS In the 1Q17 Interjet total revenues added $4,421.5 million pesos that represented an increase of 14.8% over the income generated in the 1Q16. In the 1Q17, operating
Thales on the Civil Aerospace market
 thalesgroup.com Innovation - Civil Aerospace - Defence Aerospace - Transportation - Defence - Security Thales on the Civil Aerospace market AT A GLANCE World n 1 in ATM, covering 40% of world s surface
Q4 Fiscal 2017 Statistics
 Q4 Fiscal 2017 Statistics FedEx Corporation Financial and Operating Statistics Fourth Quarter Fiscal 2017 July 17, 2017 This report is a statistical supplement to FedEx s interim financial reports and
ABX. Holdings, Inc. BB&T Transportation Conference. February 2008
 ABX Holdings, Inc. BB&T Transportation Conference February 2008 1 Safe Harbor Statement Except for historical information contained herein, the matters discussed in this presentation contain forward-looking
AIRBUS. H Roadshow Presentation. July 2018
 AIRBUS H1 2018 Roadshow Presentation July 2018 H1 18 HIGHLIGHTS 2 Robust commercial aircraft environment Backlog of ~7,200 a/c underpins ramp-up plans H1 financials reflect mainly A350 performance and
1 st Quarter Results FY
 1 st Quarter Results FY 2004-05 05 Q1 Highlights p Context 8Improving economic context 8Strong economic growth in Americas and Asia 8Modest economic recovery in Europe 8Soaring fuel prices 8IPE Brent up
1.3% millionn euros. Net debt of 5.4 improvement. euros to. Financial Year. the Air. operating. equipped. ness and. also focus on.
 25 th July 2014 Financial Year 2014: First Half results SECOND QUARTER Revenues of 6.45 billion euros, upp 1.7% like-for-like; passenger unit revenue up 1.3% at constant currency thanks to strict capacity
CONTACT: Investor Relations Corporate Communications
 NEWS RELEASE CONTACT: Investor Relations Corporate Communications 435.634.3200 435.634.3553 Investor.relations@skywest.com corporate.communications@skywest.com SkyWest, Inc. Announces Fourth Quarter 2017
HIGH FUEL PRICES DRIVE HALF YEAR PROFIT DOWN 62% AMIDST CHALLENGING ENVIRONMENT
 3 November 2011 Page 1 of 4 No. 06/11 03 November 2011 HIGH FUEL PRICES DRIVE HALF YEAR PROFIT DOWN 62% AMIDST CHALLENGING ENVIRONMENT GROUP FINANCIAL PERFORMANCE First Half 2011-12 The Group made a net
IAG results presentation. Quarter One th May 2018
 IAG results presentation Quarter One 2018 4 th May 2018 Highlights Willie Walsh, Chief Executive Officer Highlights Another strong quarter performance with an operating profit of 280m (5.6% margin, +2.3pts)
American Airlines Group Inc.
 American Airlines Group Inc. Bank of America Merrill Lynch 2018 Transportation Conference Derek Kerr Chief Financial Officer Cautionary Statement Regarding Forward-Looking Statements and Information This
Financial Results 3 rd Quarter MAR/2016 (FY2015)
") Financial Results MAR/2016 (FY2015) January 29 th, 2016 CONTENTS P.1 P.2 P.3 P.4~ Overview of FY MAR/16 Results Operating Revenue Operating Profit 1,030 1,020 1,010 +1.0Bn 1,022.3 1,023.4 (+0.1%) 180 160
Financial Results MAR/2016 (FY2015) January 29 th, 2016 CONTENTS P.1 P.2 P.3 P.4~ Overview of FY MAR/16 Results Operating Revenue Operating Profit 1,030 1,020 1,010 +1.0Bn 1,022.3 1,023.4 (+0.1%) 180 160
SAS Group Q2 2012/13. Q2 Restructuring programme moving KPIs in the right direction
 SAS Group Q2 2012/13 1 Q2 Restructuring programme moving KPIs in the right direction Operating revenues +1.6%* Yield improvement of +2.7%* Forceful implementation of 4XNG plan: Unit cost down by 10.7%
Interim results. 11 May 2010
 Interim results 11 May 2010 Introduction Andy Harrison Chief Executive Officer Strong performance despite disruption Improvement in revenue, margins and cash Continued network improvement has driven better
American Airlines Group Inc.
 American Airlines Group Inc. Deutsche Bank Leveraged Finance Conference October 4, 2017 Tom Weir Vice President, Treasurer Cautionary Statement Regarding Forward-Looking Statements and Information This
SAS Q3 2017/ August 2018
 SAS Q3 2017/2018 31 August 2018 Strong earnings in peak season POSITIVES Record number of passengers Total revenue up MSEK 936 vs. LY Currency adjusted yield up 1.1% vs. LY EB point sale up 27% vs. LY
Passenger: 17.2 Million (+3.9% yoy) OTP: 85.8% SLF: 73.3% Subsidiaries Operating Revenues US$415.2 Million Cargo Carried 219.4K ton (+10.
 OTP: 85.8% SLF: 73.3% Subsidiaries Operating Revenues US$415.2 Million Cargo Carried 219.4K ton (+10.") Value* 14.78 3.36 4.97 Volume** 32.85 9.59 13.43 Last Price 423 342 348 Market Cap.*** 8.74 8.85 9.01 Note: * Average Value in Billion Rupiah ** Average Volume in Million *** Market Capitalization in Trillion
Value* 14.78 3.36 4.97 Volume** 32.85 9.59 13.43 Last Price 423 342 348 Market Cap.*** 8.74 8.85 9.01 Note: * Average Value in Billion Rupiah ** Average Volume in Million *** Market Capitalization in Trillion
Flughafen Wien Group Continues on Success Path in the First Quarter of 2016
 Flughafen Wien Group Continues on Success Path in the First Quarter of 2016 Upward revaluation of stake in Malta Airport and good business development lead to strong increase in the net profit for the
Q4 Fiscal 2018 Statistics
 Q4 Fiscal 2018 Statistics FedEx Corporation Financial and Operating Statistics Fourth Quarter Fiscal 2018 June 19, 2018 This report is a statistical supplement to FedEx s interim financial reports and
Gabelli Asset Management Aircraft Supplier Conference
 Gabelli Asset Management Aircraft Supplier Conference Rob Gillette Aerospace President & CEO September 5, 2008 Forward Looking Statements This report contains forward-looking statements within the meaning
2012 Result. Mika Vehviläinen CEO
 2012 Result Mika Vehviläinen CEO 1 Agenda Market environment in Q4 Business performance and strategy execution Outlook Financials 2 Market Environment According to IATA, Global air travel continues to
Finnair Q Result
 17 August 2016 CEO Pekka Vauramo CFO Pekka Vähähyyppä Finnair Q2 2016 Result 1 Highlights of the second quarter The seventh consecutive quarter of profit improvement Fukuoka & Guangzhou route openings
26 October 2017 Icelandair Group Interim Report NET PROFIT USD 101 MILLION IN THIRD QUARTER
 NET PROFIT USD 101 MILLION IN THIRD QUARTER Total income in Q3 up by 10% between years, to USD 536.0 million Passenger revenue higher than expected EBITDA unchanged year on year, at USD 161.1 million Passenger
Annual Results Air New Zealand
 Annual Results 2011 Air New Zealand Highlights Normalised earnings* $75m Net cash position of $860m Operating cash flow down 5% Gearingat467% at 46.7% Final dividend 2.5 cents per share (unimputed) New
SAS Q1 2016/
 SAS Q1 2016/2017 08.03.2017 Weak Q1 as expected new structural actions underway Q1 in summary Positives + Currency adjusted passenger revenue up 5% + Strong development of ancillary revenues + Passengers
Q1 Fiscal 2019 Statistics
 Q1 Fiscal 2019 Statistics FedEx Corporation Financial and Operating Statistics First Quarter Fiscal 2019 September 17, 2018 This report is a statistical supplement to FedEx s interim financial reports
AEROSPACE & ELECTRONICS
 AEROSPACE & ELECTRONICS BRENDAN CURRAN PRESIDENT 1 Aerospace & Electronics Overview and Results Market Outlook Technological Differentiation and Growth Summary 2 Crane Aerospace & Electronics 1904 Lear
2010 Global Transportation Conference
 Air Canada's Executive Vice President & CFO Michael Rousseau presents at 2010 Global Transportation Conference New York June 16, 2010 Agenda Air Canada leading carrier in all markets Managing through challenging
AIR CANADA REPORTS THIRD QUARTER RESULTS
 AIR CANADA REPORTS THIRD QUARTER RESULTS THIRD QUARTER OVERVIEW Operating income of $112 million compared to operating income of $351 million in the third quarter of 2007. Fuel expense increased 49 per
PARENT AIRLINE OPERATIONS LIFT GROUP PROFIT
 PARENT AIRLINE OPERATIONS LIFT GROUP PROFIT HIGHLIGHTS OF THE GROUP S PERFORMANCE Financial Year 2006-07 4th Quarter 2006-07 Apr 2006 Mar 2007 Year-on-Year % Change Jan-Mar 2007 Year-on-Year % Change Operating
SAS Group Q Teleconference
 SAS Group Q4 2012 Teleconference December 12, 2012 1 Break-even result in 2012 despite 1.6 bn SEK higher fuel cost 23 MSEK EBT (before non-recurring items) despite 1.6 bn SEK higher fuel cost Positive
Finnair Group Interim Report 1 January 30 September 2008
 Finnair Group Interim Report 1 January 30 September 2008 1 31/10/2008 Presentation name / Author Airline industry at a historical turning point Expensive fuel price in the beginning of 2008 has dramatical
Copa Holdings Reports Record Earnings of US$41.8 Million for 4Q06 and US$134.2 Million for Full Year 2006
 Copa Holdings Reports Record Earnings of US$41.8 Million for 4Q06 and US$134.2 Million for Full Year 2006 Panama City, Panama --- March 7, 2007. Copa Holdings, S.A. (NYSE: CPA), parent company of Copa
Finnair Group Interim Report 1 January 31 March 2008
 Finnair Group Interim Report 1 January 31 March 2008 1 29/04/2008 Presentation name / Author Outlook for the industry less positive Growth of demand declining due to uncertainty of global economy Growth
FIRST QUARTER RESULTS 2016
 FIRST QUARTER RESULTS 2016 KEY RESULTS In 1Q16 Interjet total revenues added $3,850.8 million pesos that represented an increase of 21.9% over the income generated in the 1Q15. In 1Q16 total passengers
Financial Results 1 st Quarter Mar/2016 (FY2015) 30 July, 2015
 30 July, 2015") Financial Results Mar/2016 (FY2015) 30 July, 2015 Today s Topics P.2 P.3 P.15 1 Overview of FY Mar/2016 Financial Results Operating Revenue Operating Profit 320 307.0 +4.9Bn (+1.6%) 312.0 50 +17.6Bn (+94.6%)
Financial Results Mar/2016 (FY2015) 30 July, 2015 Today s Topics P.2 P.3 P.15 1 Overview of FY Mar/2016 Financial Results Operating Revenue Operating Profit 320 307.0 +4.9Bn (+1.6%) 312.0 50 +17.6Bn (+94.6%)
Volaris Reports Strong First Quarter 2015: 32% Adjusted EBITDAR Margin, 9% Operating Margin
 Volaris Reports Strong First Quarter 2015: 32% Adjusted EBITDAR Margin, 9% Operating Margin Mexico City, Mexico, April 22, 2015 Volaris* (NYSE: VLRS and BMV: VOLAR), the ultra-low-cost airline serving
JAPAN AIRLINES Co., Ltd. Financial Results 1 st Quarter Mar/2018(FY2017)
") JAPAN AIRLINES Co., Ltd. Financial Results Mar/2018(FY2017) July 31, 2017 Today s Topics P.1 P.2 P.3 P.4 P.6 P.15 Overview of Financial Results for (FY2017) 1 st quarter resulted in an increase in both
JAPAN AIRLINES Co., Ltd. Financial Results Mar/2018(FY2017) July 31, 2017 Today s Topics P.1 P.2 P.3 P.4 P.6 P.15 Overview of Financial Results for (FY2017) 1 st quarter resulted in an increase in both
31 October 2018 RESULTS AS AT 30 SEPTEMBER 2018 Good resilience of operating result thanks to revenue performance and unit cost reduction
 31 October 2018 RESULTS AS AT 30 SEPTEMBER 2018 Good resilience of operating result thanks to revenue performance and unit cost reduction THIRD QUARTER 2018 Air France-KLM commercial teams delivered a
Investor Presentation
 Investor Presentation Credit Suisse Global Industrials Conference December 3, 2013 2013 Rockwell Collins. All rights reserved. Safe Harbor Statement This presentation contains statements, including certain
Q3 Fiscal 2018 Statistics
 Q3 Fiscal 2018 Statistics FedEx Corporation Financial and Operating Statistics Third Quarter Fiscal 2018 March 20, 2018 This report is a statistical supplement to FedEx s interim financial reports and
THIRD QUARTER 2017 RESULTS STRONG OPERATING RESULT DRIVEN BY SOLID TRAFFIC AND INCREASE IN UNIT REVENUE
 3 rd of November 2017 THIRD QUARTER 2017 RESULTS STRONG OPERATING RESULT DRIVEN BY SOLID TRAFFIC AND INCREASE IN UNIT REVENUE THIRD QUARTER 2017 The operating result stands at 1,022 million euros, up 38.7%
Quarter Interim Management Statement. 28 July 2010
 Quarter 3 2010 Interim Management Statement 28 July 2010 Week 4 priorities and initial impressions Priorities: Engage with staff, shareholders, customers and key suppliers Mitigation plan for recent operational
Q Fast growth continued, Comparable operating result at record high levels Pekka Vauramo
 2018 Fast growth continued, Comparable operating result at record high levels 17.7.2018 Pekka Vauramo 2 A good - Comparable operating result increased to new seasonal high Revenue Comparable operating
MRO Asia 2012 Market Forecast and Key Trends
 MRO Asia 2012 Market Forecast and Key Trends Presented by: David Stewart Head of Aviation and Aerospace EMEA david.stewart@icfi.com AVIATION WEEK - MRO ASIA Singapore, November 2012 0 Today s Agenda Economic
MARKET FORECAST BOMBARDIER COMMERCIAL AIRCRAFT COMMERCIALAIRCRAFT.BOMBARDIER.COM BOMBARDIER COMMERCIAL AIRCRAFT MARKET FORECAST
 MARKET FORECAST 2015-2034 BOMBARDIER COMMERCIAL AIRCRAFT COMMERCIALAIRCRAFT.BOMBARDIER.COM BOMBARDIER COMMERCIAL AIRCRAFT MARKET FORECAST 2015-2034 FORWARD-LOOKING STATEMENTS This presentation includes
AerCap Holdings N.V. Keith Helming Chief Financial Officer. Wachovia Securities Equity Conference June 23, 2008
 AerCap Holdings N.V. Keith Helming Chief Financial Officer Wachovia Securities Equity Conference June 23, 2008 Forward Looking Statements & Safe Harbor This presentation contains certain statements, estimates
Copa Holdings Reports Earnings of US$30.3 Million and EPS of US$0.70 for 3Q08
 Copa Holdings Reports Earnings of US$30.3 Million and EPS of US$0.70 for 3Q08 Panama City, Panama --- November 13, 2008. Copa Holdings, S.A. (NYSE: CPA), parent company of Copa Airlines and Aero Republica,
El Al Israel Airlines announced today its financial results for the year 2016 and the fourth quarter of the year:
 El Al Israel Airlines announced today its financial results for the year 2016 and the fourth quarter of the year: The Company's revenues in 2016 amounted to approx. USD 2,038 million, compared to approx.
EADS: New Stage of Maturity. Nathalie Errard VP Investor Relations
 EADS: New Stage of Maturity Nathalie Errard VP Investor Relations Lagardere Investor Day, June 1 st, 2006 1 Content Integration and Rise to Leadership 2005 Group Financials New Challenges, New Growth 2
AEROSPACE & ELECTRONICS BRENDAN CURRAN PRESIDENT
 AEROSPACE & ELECTRONICS BRENDAN CURRAN PRESIDENT Aerospace & Electronics Overview and Results Market Outlook Technological Differentiation and Growth Summary 2 Crane Aerospace & Electronics Industry Leader
Management s Review and Analysis of Financial Position
 Management s Review and Analysis of Financial Position Japan Airlines System Corporation and Consolidated Subsidiaries Years Ended March 31, 22 and 23 Consolidated operating revenues 2,4 1,8 1,2 6 21 22
EASYJET INTERIM MANAGEMENT STATEMENT FOR THE QUARTER ENDED 31 DECEMBER 2010
 20 January 2011 easyjet Interim Management Statement Page 1 of 5 20 January 2011 EASYJET INTERIM MANAGEMENT STATEMENT FOR THE QUARTER ENDED 31 DECEMBER 2010 Highlights: Total revenue up by 7.5% to 654
Copa Holdings Reports Net Income of US$51.9 Million for the Fourth Quarter of 2008 and US$152.2 Million for Full Year 2008
 Copa Holdings Reports Net Income of US$51.9 Million for the Fourth Quarter of 2008 and US$152.2 Million for Full Year 2008 Panama City, Panama --- February 19, 2009. Copa Holdings, S.A. (NYSE: CPA), parent
Investor Update September 2017 PARTNER OF CHOICE EMPLOYER OF CHOICE INVESTMENT OF CHOICE
 Investor Update September 2017 PARTNER OF CHOICE EMPLOYER OF CHOICE INVESTMENT OF CHOICE 1 Forward Looking Statements In addition to historical information, this presentation contains forward-looking statements
Hans-Peter Ring EADS Chief Financial Officer. Cowen Conference February 8 th 2012
 Hans-Peter Ring EADS Chief Financial Officer Cowen Conference February 8 th 2012 Safe Harbour Statement 2 Disclaimer This presentation includes forward-looking statements. Words such as anticipates, believes,