C A R G O L U X の 戦 略 ネ ッ ト ワ ー ク プ ロ ダ ク ツ 1 1 J u n
|
|
|
- Nancy Long
- 5 years ago
- Views:
Transcription

1 C A R G O L U X の戦略 ネットワークプロダクツ 11Jun2018

2 C a r g o l u x Founded in March 1970: over 45 years of experience in allcargo services Operating a modern and energy-efficient fleet of 28 aircraft (Boeing 747F) 2,027 employees worldwide (incl. Cargolux Italia) 1,436 employees in Luxembourg Dual Hub Strategy with Zhengzhou Airport initiated in 2014 Europe s #1 all cargo carrier, #5 worldwide


3 Charter Cargo Carriers Scheduled Cargo Carriers Integrated Carriers Air Cargo Market Passenger Airlines ACMI Providers Combination Carriers
4 I A TA To p 2 5 a i r c a r g o c a r r i e r s Y T D M a r c h Rank Airline FTK ('000) 2018/3 FTK ('000) 2017/3 Market share 2018/3 Market share 2017/3 FTK Growth 2017/3-2018/3 Remarks 1 QR Qatar Airways 2,987,690 2,503, % 5.3% +19.4% 2 EK Emirates 2,918,289 2,983, % 6.4% -2.2% 3 CX Cathay Pacific 2,741,273 2,538, % 5.4% +8.0% incl. KA 4 LH Lufthansa 2,367,230 2,217, % 4.7% +6.8% incl. OS, LX, SN 5 AF Air France 1,976,124 1,975, % 4.2% +0.1% incl. KL 6 CV Cargolux 1,944,997 1,834, % 3.9% +6.0% incl. C8 7 FX Fedex 1,841,879 1,691, % 3.6% +8.9% Estimations for 1, 2, 3/ SQ Singapore Airlines 1,724,549 1,649, % 3.5% +4.6% 9 KE Korean Air 1,659,502 1,650, % 3.5% +0.5% 10 5X UPS 1,493,884 1,314, % 2.8% +13.6% Estimations for 2, 3/ CI China Airlines 1,384,788 1,252, % 2.7% +10.6% Estimations for 1, 2, 3/ CA Air China 1,310,870 1,156, % 2.5% +13.4% 13 BA British Airways 1,273,968 1,277, % 2.7% -0.2% incl. IB, BD, EI 14 RU Air Bridge Cargo 1,226,936 1,263, % 2.7% -2.9% 15 TK Turkish Airlines 1,205, , % 1.9% +35.3% 16 CZ China Southern Airlines 1,175,792 1,062, % 2.3% +10.6% 17 OZ Asiana 1,086,582 1,063, % 2.3% +2.1% Estimations for 3/ NH All Nippon Airways 1,036,270 1,004, % 2.1% +3.1% 19 UA United 973, , % 1.8% +12.3% incl. CO 20 BR Eva Airways 843, , % 1.8% +1.4% 21 EY Etihad 840,594 1,040, % 2.2% -19.2% 22 AA American Airlines 828, , % 1.6% +12.7% incl. US 23 KZ Nippon Cargo 781, , % 1.6% +4.1% 24 LA LAN Chile 739, , % 1.5% +5.3% incl. JJ Estimations for 3/ TG Thai Airways 604, , % 1.2% +7.7% Others (IATA estimates) 12,751,059 12,098, % 25.8% +5.4% Total Industry 49,717,145 46,913, % 6.0% 10% Top 10 21,655,417 20,357, % 43.4% +6.4% Top 20 33,172,676 31,026, % 66.1% +6.9% Top 25 36,966,086 34,815, % 74.2% +6.2% Source: IATA MIS data based on airline reports. Note: International scheduled flights only! Note: MU has not been able to deliver cargo statistics since 2017 Jan and therefore has been removed from the ranking; Growth rates in red font are below industry average 4

5 F L E E T E V O L U T I O N Aircraft Until DEC 2017 APR BCF* * ERF F Total Δ

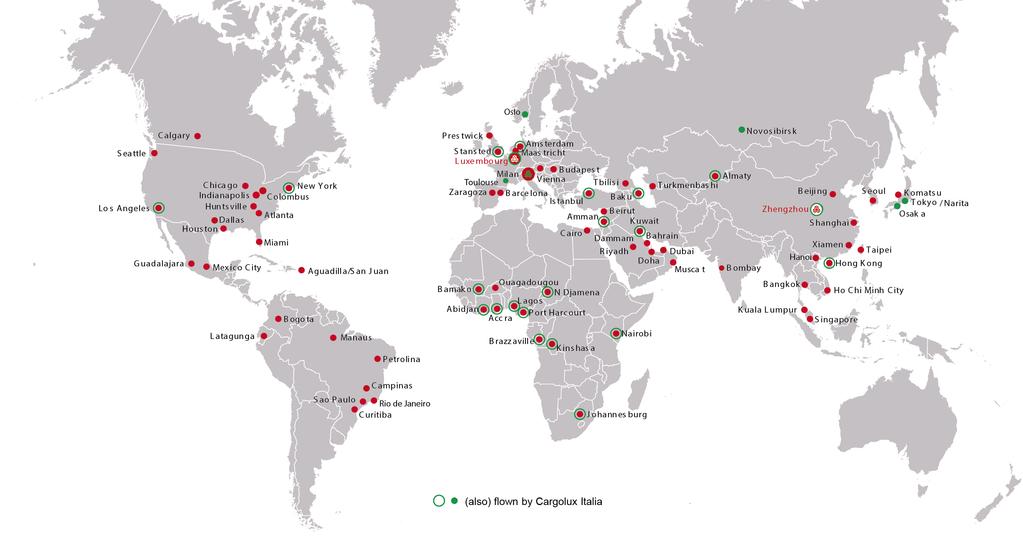
6 Cargolux Network Cargolux Destinations Map 6


7 Cooperation with Emirates Cargo New flight to/from Narita 7

8 D U A L H A U B D E V E L O P M E N T System of two Hubs and Gateways to be further strengthened. Luxembourg Chicag o Milan Turkmenba shi Zhengzhou Hub Gateway Destination Lagos Bombay Hong Kong From a single hub in LUX to a truly 8
 GDP: $6.")
9 C G O T H E G AT E W AY T O C H I N A Zhengzhou is geographically the central city of China Henan s GDP ranked 5 th in China A strategic transportation hub of the country Located in a 1.26 billion consumer market 95% of PEK CGO SHA Guangzhou Chinese GDP can be serviced in a radius of 2,000 km 2,000 KM: Population: 1.26B (90%) GDP: $6.0T (95%) 9 1,000 KM: Population: 790M (56%) GDP: $3.2T (51%)


10 C G O T H E G AT E W AY T O C H I N A Zhengzhou Airport CGO One of the 8 hub airports in China 144 international and regional aviation routes; thereof 20 international all-cargo 2013 exports and imports totaled $42,75B Up to 800,000 tons per year handling capacity Part of the Zhengzhou Airport Economic Zone (ZAEZ) ZAEZ allows for duty-free import and re-export of goods and components With strong government support, it is home to giants such as Foxconn 10

11 GatewayChina The Cargolux connection Trucking from CGO to CAN 913miles 36 Hours CGQ 982miles 39 Hours CKG 818miles 35 Hours CSX 503miles 20 Hours CTU 783miles 34 Hours DLC 963miles 38 Hours HFE 341miles 14 Hours HGH 615miles 22 Hours HRB 1203miles 47 Hours KHN 559miles 21 Hours LHW 870miles 32 Hours NGB 564miles 22 Hours NKG 421miles 16 Hours PEK 455miles 18 Hours PVG 596miles 22 Hours SHE 882miles 35 Hours SJW 278miles 12 Hours SZV 553miles 21 Hours TAO 463miles 16 Hours TNA 336miles 14 Hours TSN 456miles 18 Hours WUH 286miles 9 Hours WUX 559miles 21 Hours XIY 339miles 9 Hours XMN 994miles 38 Hours YNT 572miles 21 Hours Yantai Wuxi 11


12 high security shipments timesensitive shipments industrial shipments Cargolux Product Portfolio General Cargo Fast and reliable way across continents & prime manufacturing regions! Cars, Aircraft Engines, Helicopters The tools & expertise to move them! Heavy & Outsize Catering for all shapes and sizes! Horses, Exotic Breeds, Pets Great, small, domesticated or not: flying first-class! Perishables, Flowers Goods around the world at the perfect temperature! Pharmaceuticals & Healthcare Destined for patients worldwide! Artwork, High Value Security standards: we don t just follow, we set them! Dangerous Goods Expert handling, swift delivery! 12

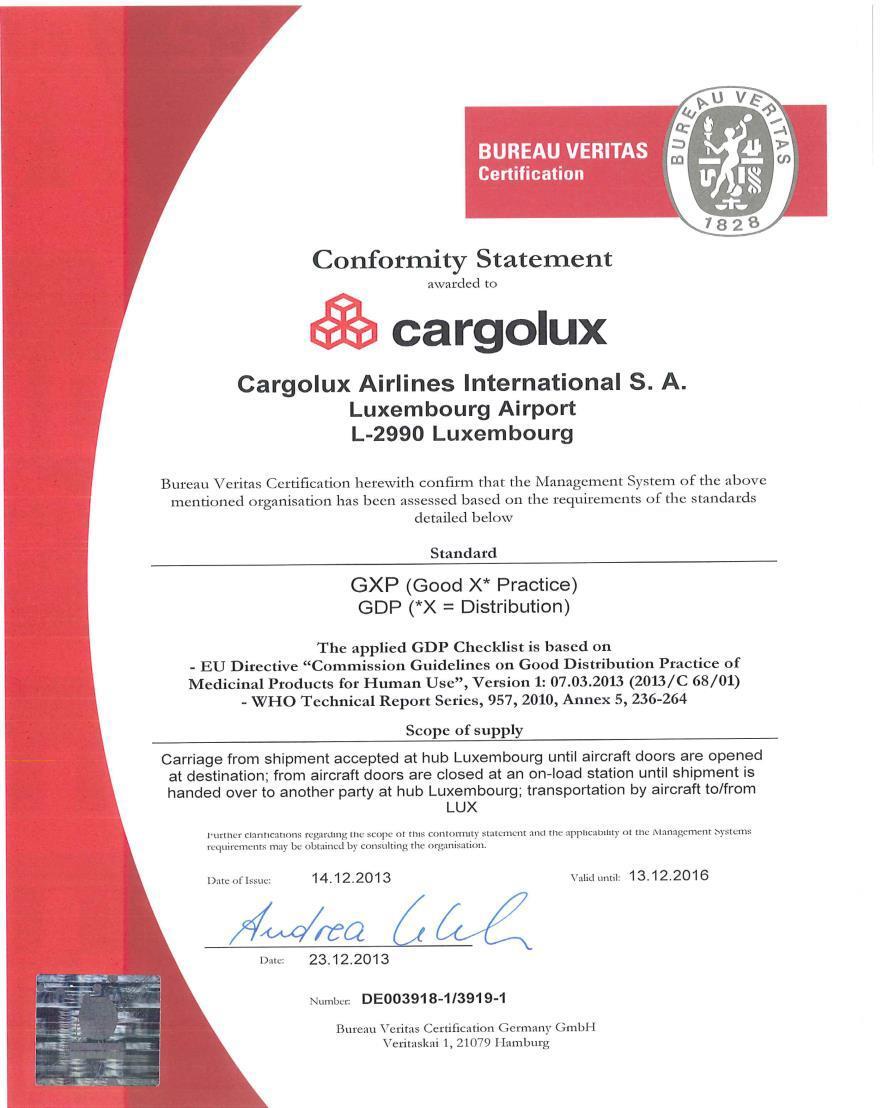
13 Renewal of GDP Certificate 13

14 M A I N T E N A N C E Activity 480 staff: 553,000 man hours in A-checks & 13 C-checks performed on CV fleet 14 A-checks performed on customer fleet

15 M A I N T E N A N C E Facilities Hangar operational since May hangar bays capable to accommodate all future large aircraft: B /8, A380, B777 Shops on two floor levels, close to the aircraft Apron for 3 aircraft and taxiway Biggest building in Luxembourg
16 C A R G O L U X T H E R I G H T A N S W E R F O R A I R C A R G O The right time for CV products A history of 45 years service excellence for air cargo A foundational core competence you name it, we fly it! Time to leverage the evolved global presence The right network for CV products World-wide services supported by air cargo specialists End-to-End global consistency with 85 offices in 55 countries Modern Boeing 747F fleet with best-in-class handling & trucking The right focus for CV products Clear identification with latest industry needs and developments Comprehensive product portfolio grown from experience Thinking Beyond the Flight with our customers & for our customers

17 Thank You! 17
Japan Export Air. International Air Freight Fuel Surcharge. All Destinations
 Japan Export Air January 12, 218 International Air Freight Fuel Surcharge Carrier 3K Jet Star Asia Airways 66 1-Jan-15 Taiwan, Philippines 48 1-Jan-15 5C C.A.L. Cargo 13 1-Oct-12 China, Hong Kong, Korea,
Japan Export Air. International Air Freight Fuel Surcharge. All Destinations
 Japan Export Air January 3, 218 International Air Freight Fuel Surcharge Carrier 3K Jet Star Asia Airways All s 66 1-Jan-15 Taiwan, Philippines 48 1-Jan-15 5C C.A.L. Cargo All s 13 1-Oct-12 China, Hong
Japan Export Air. International Air Freight Fuel Surcharge. All Destinations
 Japan Export Air March 30, 2019 International Air Freight Fuel Surcharge 3K Jet Star Asia Airways All s 66 1-Jan-15 Taiwan, Philippines 48 1-Jan-15 5C C.A.L. Cargo All s 130 1-Oct-12 China, Hong Kong,
Japan Export Air. International Air Freight Fuel Surcharge. All Destinations
 Japan Export Air February 27, 2019 International Air Freight Fuel Surcharge 3K Jet Star Asia Airways All s 66 1-Jan-15 Taiwan, Philippines 48 1-Jan-15 5C C.A.L. Cargo All s 130 1-Oct-12 China, Hong Kong,
Domestic Departure flight. Dep. Destination 14-Sep 15-Sep 16-Sep 17-Sep 18-Sep 19-Sep 20-Sep
 Flight Information on Sep 14-20 (as of Sep 13 20:00) Kansai International Airport operates some part of terminal 1 and terminal 2. Customer using the following flights, please check which terminal will
SFO Airline Guide 11/1/18 CBFANC AIR COMMITTEE
 SFO Airline Guide 11/1/18 CBFANC AIR COMMITTEE A/L # cd AIRLINE FIRMS CODE ISC PYBL TO HRS Wknd Hrs other phone PHONE# FAX# 549 M3 ABSA Y965 $40 + $10/FA 7-5 closed 310 645 1221 4155706040 4155706050 730
MONTHLY AIRPORT TRAFFIC REPORT April 2017
 MONTHLY AIRPORT TRAFFIC REPORT AIRCRAFT OPERATIONS 2017 2016 Change Domestic Air Carrier 56,570 60,697-6.80% Air Taxi 7,771 7,806-0.45% General Aviation 833 699 19.17% Military 23 14 64.29% Subtotal 65,197
MONTHLY AIRPORT TRAFFIC REPORT July 2016
 MONTHLY AIRPORT TRAFFIC REPORT AIRCRAFT OPERATIONS 2016 2015 Change Domestic Air Carrier 63,680 62,789 1.42% Air Taxi 7,548 8,007-5.73% General Aviation 717 558 28.49% Military 11 146-92.47% Subtotal 71,956
MONTHLY AIRPORT TRAFFIC REPORT February 2014
 MONTHLY AIRPORT TRAFFIC REPORT AIRCRAFT OPERATIONS 2014 2013 Change Domestic Air Carrier 44,741 48,627-7.99% Air Taxi 11,144 13,003-14.30% General Aviation 569 543 4.79% Military 17 15 13.33% Subtotal
MONTHLY AIRPORT TRAFFIC REPORT August 2018
 MONTHLY AIRPORT TRAFFIC REPORT AIRCRAFT OPERATIONS 2018 2017 Change Domestic Air Carrier 65,465 63,201 3.58% Air Taxi 7,607 7,533 0.98% General Aviation 594 609-2.46% Military 15 3 400.00% Subtotal 73,681
MONTHLY AIRPORT TRAFFIC REPORT March 2017
 MONTHLY AIRPORT TRAFFIC REPORT AIRCRAFT OPERATIONS 2017 2016 Change Domestic Air Carrier 60,360 61,951-2.57% Air Taxi 8,591 8,270 3.88% General Aviation 717 615 16.59% Military 14 27-48.15% Subtotal 69,682
AF / KL. AM Airline Aeromexpress Cargo AeroMexico Cargo
 From Malaysia to Long ICA 11-Sep-12 RM3.93 AF / KL Air France / KLM From Malaysia to Long ICA 11-Sep-12 RM3.93 * SSC is based on " chargeable weight " RM0.58 AM Aeromexpress Cargo AeroMexico Cargo Effective
MONTHLY AIRPORT TRAFFIC REPORT September 2016
 MONTHLY AIRPORT TRAFFIC REPORT AIRCRAFT OPERATIONS 2016 2015 Change Domestic Air Carrier 59,030 59,038-0.01% Air Taxi 7,779 7,201 8.03% General Aviation 704 571 23.29% Military 21 12 75.00% Subtotal 67,534
FUEL SURCHARGE EX JAPAN
 FUL SURCHARG X JAPAN Updated: November 21, 2018 --- T --- 1) * : All regions or All regions except those listed 2) The FSC of below carriers is also applied for Minimum charge. AF,AY,K,KM,KL,LY,MK,VN:
MONTHLY AIRPORT TRAFFIC REPORT June 2017
 MONTHLY AIRPORT TRAFFIC REPORT AIRCRAFT OPERATIONS 2017 2016 Change Domestic Air Carrier 61,445 62,662-1.94% Air Taxi 8,267 7,656 7.98% General Aviation 644 685-5.99% Military 8 18-55.56% Subtotal 70,364
MONTHLY AIRPORT TRAFFIC REPORT July 2017
 MONTHLY AIRPORT TRAFFIC REPORT AIRCRAFT OPERATIONS 2017 2016 Change Domestic Air Carrier 63,535 63,680-0.23% Air Taxi 7,291 7,548-3.40% General Aviation 630 717-12.13% Military 15 11 36.36% Subtotal 71,471
MONTHLY AIRPORT TRAFFIC REPORT July 2018-(Revised)
") MONTHLY AIRPORT TRAFFIC REPORT AIRCRAFT OPERATIONS 2018 2017 Change Domestic Air Carrier 64,066 63,535 0.84% Air Taxi 7,468 7,291 2.43% General Aviation 550 630-12.70% Military 5 15-66.67% Subtotal 72,089
MONTHLY AIRPORT TRAFFIC REPORT AIRCRAFT OPERATIONS 2018 2017 Change Domestic Air Carrier 64,066 63,535 0.84% Air Taxi 7,468 7,291 2.43% General Aviation 550 630-12.70% Military 5 15-66.67% Subtotal 72,089
MONTHLY AIRPORT TRAFFIC REPORT February 2018
 MONTHLY AIRPORT TRAFFIC REPORT AIRCRAFT OPERATIONS 2018 2017 Change Domestic Air Carrier 51,809 51,854-0.09% Air Taxi 6,659 6,988-4.71% General Aviation 651 540 20.56% Military 6 9-33.33% Subtotal 59,125
MONTHLY AIRPORT TRAFFIC REPORT December 2018
 MONTHLY AIRPORT TRAFFIC REPORT AIRCRAFT OPERATIONS 2018 2017 Change Domestic Air Carrier 58,905 55,828 5.51% Air Taxi 6,948 6,810 2.03% General Aviation 499 565-11.68% Military 24 25-4.00% Subtotal 66,376
MONTHLY AIRPORT TRAFFIC REPORT September 2018
 MONTHLY AIRPORT TRAFFIC REPORT AIRCRAFT OPERATIONS 2018 2017 Change Domestic Air Carrier 58,763 55,902 5.12% Air Taxi 6,537 6,689-2.27% General Aviation 605 658-8.05% Military 14 17-17.65% Subtotal 65,919
FUEL SURCHARGE EX JAPAN
 FUL SURCHARG X JAPAN Updated: March 28, 2018 --- T --- 1) * : All regions or All regions except those listed 2) The FSC of below carriers is also applied for Minimum charge. AF,AY,K,KM,KL,LY,MK,VN: Minimum
MONTHLY AIRPORT TRAFFIC REPORT. April 2014
 MONTHLY AIRPORT TRAFFIC REPORT AIRCRAFT OPERATIONS 2014 2013 Change Domestic Air Carrier 55,529 55,119 0.74% Air Taxi 11,149 15,077-26.05% General Aviation 639 723-11.62% Military 13 14-7.14% Subtotal
MONTHLY AIRPORT TRAFFIC REPORT April 2018
 MONTHLY AIRPORT TRAFFIC REPORT AIRCRAFT OPERATIONS 2018 2017 Change Domestic Air Carrier 60,928 56,570 7.70% Air Taxi 6,995 7,771-9.99% General Aviation 654 833-21.49% Military 9 23-60.87% Subtotal 68,586
Gregg Gildemann Market Analysis
 Gregg Gildemann Market Analysis Boeing Commercial Airplanes 20 February 2018 The statements contained herein are based on good faith assumptions are to be used for general information purposes only. These
FUEL SURCHARGE EX JAPAN
 FUL SURCHARG X JAPAN Updated: December 20, 2018 --- T --- 1) * : All regions or All regions except those listed 2) The FSC of below carriers is also applied for Minimum charge. AF,AY,K,KM,KL,LY,MK,VN:
FUEL SURCHARGE EX JAPAN
 FUL SURCHARG X JAPAN Updated: October 17, 2018 --- T --- 1) * : All regions or All regions except those listed 2) The FSC of below carriers is also applied for Minimum charge. AF,AY,K,KM,KL,LY,MK,VN: Minimum
MONTHLY AIRPORT TRAFFIC REPORT December 2017
 MONTHLY AIRPORT TRAFFIC REPORT AIRCRAFT OPERATIONS 2017 2016 Change Domestic Air Carrier 55,828 57,943-3.65% Air Taxi 6,810 7,642-10.89% General Aviation 565 569-0.70% Military 25 32-21.88% Subtotal 63,228
MONTHLY AIRPORT TRAFFIC REPORT May 2015
 MONTHLY AIRPORT TRAFFIC REPORT AIRCRAFT OPERATIONS 2015 2014 Change Domestic Air Carrier 60,427 57,339 5.39% Air Taxi 7,825 10,967-28.65% General Aviation 547 635-13.86% Military 135 27 400.00% Subtotal
For particular shipment information please discuss directly with our customer service representatives.
 From: Walter Futschik Sent: Thursday, 1 March 2012 6:47 AM Subject: FW: Bulletin : Oceanfreight + airfreight carrier surcharges Please find attached our current guides to both ocean and air carrier surcharges.
MONTHLY AIRPORT TRAFFIC REPORT November 2013
 MONTHLY AIRPORT TRAFFIC REPORT AIRCRAFT OPERATIONS 2013 2012 Change Domestic Air Carrier 52,937 54,739-3.29% Air Taxi 13,964 13,566 2.93% General Aviation 504 515-2.14% Military 25 28-10.71% Subtotal 67,430
Airline On-time Arrival Performance (Nov 2018, by VariFlight) SC Retains top spot among China s Major Airlines in APAC OTP Chart for
 SC Retains top spot among China s Major Airlines in APAC OTP Chart for") Airline (Nov 2018, by VariFlight) SC Retains top spot among China s Major in APAC OTP Chart for five consecutive months Powered by VariFlight incomparable aviation database, the monthly report of Airline
Airline (Nov 2018, by VariFlight) SC Retains top spot among China s Major in APAC OTP Chart for five consecutive months Powered by VariFlight incomparable aviation database, the monthly report of Airline
Airports Service Evaluation Report. Third Quarter 2018
 Airports Service Evaluation Report Third Quarter 2018 CONTENTS 01 02 03 Overview Airports Service Evaluation Chinese Mainland Airports Evaluation by Region 04 About CAPSE Overview Overview CAPSE selected
Airline On-time Arrival Performance (Nov. 2017)
") Airline (Nov. 2017) Powered by VariFlight incomparable aviation database, the monthly report of Airline On-time Departure provides an overview of how global airlines are performing in November, 2017. Global
Airline (Nov. 2017) Powered by VariFlight incomparable aviation database, the monthly report of Airline On-time Departure provides an overview of how global airlines are performing in November, 2017. Global
Airports Service Evaluation Report. Second Quarter 2018
 Airports Service Evaluation Report Second Quarter 2018 CONTENTS 01 02 03 Overview Airports Service Evaluation Chinese Mainland Airports Evaluation by Region 04 About CAPSE Overview Overview CAPSE selected
HEATHROW AIRPORT LHR Summer 2014 (S14) Start of Season
 Start of Season") HEATHROW AIRPORT LHR Summer 214 (S14) Start of Season KEY STATISTICS Summer 214 vs Summer 213 Air Transport Movements Allocated 282,172.6% Passenger Air Transport Movements Allocated 28,726.6% Total Seats
HEATHROW AIRPORT LHR Summer 214 (S14) Start of Season KEY STATISTICS Summer 214 vs Summer 213 Air Transport Movements Allocated 282,172.6% Passenger Air Transport Movements Allocated 28,726.6% Total Seats
Should you have any queries on the above subject matter please contact our office direct.
 Please find attached our current guides to both ocean and air carrier surcharges. While we endeavour to keep you abreast of fluctuations surcharges are levied by carriers at time of shipment and may be
Airline On-time Arrival Performance (May 2018, by VariFlight) SQ Tops Asia-Pacific Medium-Sized Airlines for Five Consecutive Months
 SQ Tops Asia-Pacific Medium-Sized Airlines for Five Consecutive Months") Airline (May 2018, by VariFlight) SQ Tops Asia-Pacific Medium-Sized for Five Consecutive Months Powered by VariFlight incomparable aviation database, the monthly report of Airline provides an overview
Airline (May 2018, by VariFlight) SQ Tops Asia-Pacific Medium-Sized for Five Consecutive Months Powered by VariFlight incomparable aviation database, the monthly report of Airline provides an overview
MONTHLY AIRPORT TRAFFIC REPORT January 2018
 MONTHLY AIRPORT TRAFFIC REPORT AIRCRAFT OPERATIONS 2018 2017 Change Domestic Air Carrier 55,461 55,980-0.93% Air Taxi 7,166 7,330-2.24% General Aviation 690 625 10.40% Military 6 11-45.45% Subtotal 63,323
Departure Punctuality - Dec-17. Departure Punctuality - Last 12 Months
 Departure - Dec-17 Last Month Last Year % Change Target Var to Target First Wave 74.0% 84.1% -10.1% 85.0% -11.0% Not First Wave 55.4% 72.0% -16.6% 85.0% -29.6% Grand Total 59.4% 74.9% -15.5% 85.0% -25.6%
Airline On-time Arrival Performance (Jan. 2018)
") Airline (Jan. 2018) Powered by VariFlight incomparable aviation database, the monthly report of Airline provides an overview of how global airlines are performing in January, 2018. Global Big Airlines
Airline (Jan. 2018) Powered by VariFlight incomparable aviation database, the monthly report of Airline provides an overview of how global airlines are performing in January, 2018. Global Big Airlines
Operational Performance Reporting Manchester Airport January 2018
 Operational Performance Reporting Manchester Airport January 2018 Departure - Jan-18 Last Month Last Year % Change Target Var to Target First Wave 89.7% 85.2% 4.5% 85.0% 4.7% Not First Wave 77.7% 76.3%
Departure Punctuality - Apr-17. Departure Punctuality - Last 12 Months
 Departure - Apr-17 Last Month Last Year % Change Target Var to Target First Wave 87.6% 91.3% -3.8% 85.0% 2.6% Not First Wave 77.5% 81.5% -4.0% 85.0% -7.5% Grand Total 79.7% 83.6% -3.9% 85.0% -5.3% Departure
Introduction: Airline Industry Overview Dr. Peter Belobaba Presented by: Alex Heiter & Ali Hajiyev
 Introduction: Airline Industry Overview Dr. Peter Belobaba Presented by: Alex Heiter & Ali Hajiyev Istanbul Technical University Air Transportation Management M.Sc. Program Network, Fleet and Schedule
Airline On-time Arrival Performance (Sept. 2017)
") Airline (Sept. 2017) Powered by VariFlight incomparable aviation database, the monthly report of Airline provides an overview of how global airlines are performing every month in 2017. Global Big Airlines
Airline (Sept. 2017) Powered by VariFlight incomparable aviation database, the monthly report of Airline provides an overview of how global airlines are performing every month in 2017. Global Big Airlines
Heathrow Airport LHR Winter 2012 START OF SEASON REPORT
 Heathrow Airport LHR Winter 212 START OF SEASON REPORT KEY STATISTICS Winter 212 vs Winter 211 Start vs Winter 211 End Air Transport Movements 194,486-2.%.1% Total Seats (m) 4.1.1% 3.4% Seats per Passenger
Global Airline On-time Arrival Performance Report November 2014
 Global Arrival Performance Report November 2014 Copyright @ 2014 VariFlight.com 1 Contents > > Part I Major Arrival Performance Figure 3 Part II Major Arrival Data 6 Copyright @ 2014 VariFlight.com 2 Part
Steve Smith Director Cargo Supply Chain Management
 IATA e-freight project status Steve Smith Director Cargo Supply Chain Management Contents 1. Introduction: Vision and Board Mandate 2. Current Performance 3. 2010 progress to increasing e-freight capability:
Cathay Pacific Airways 2012 Analyst Briefing 28 June 2012
 Cathay Pacific Airways 2012 Analyst Briefing 28 June 2012 1 Airline Strategy Grow our international network, expand frequencies and further develop Hong Kong as one of the world s leading aviation hubs
Airline On-time Arrival Performance (Dec. 2017)
") Airline (Dec. 2017) Powered by VariFlight incomparable aviation database, the monthly report of Airline On-time Departure provides an overview of how global airlines are performing in December, 2017. Global
Airline (Dec. 2017) Powered by VariFlight incomparable aviation database, the monthly report of Airline On-time Departure provides an overview of how global airlines are performing in December, 2017. Global
Departure Punctuality - Jun-17. Departure Punctuality - Last 12 Months
 Departure - Jun-17 Last Month Last Year % Change Target Var to Target First Wave 79.3% 79.8% -0.5% 85.0% -5.7% Not First Wave 68.3% 66.8% 1.5% 85.0% -16.7% Grand Total 70.7% 69.8% 0.8% 85.0% -14.3% Departure
Cathay Pacific Airways Interim Results for the six months ended 30 June 2012
 Cathay Pacific Airways Interim Results for the six months ended 30 June 2012 8 August 2012 1 Interim Result 1H2012 1H2011 Change Group attributable (loss) / profit HK$ million (935) 2,808-133.3% Group
Operational Performance Reporting Manchester Airport March 2018
 Operational Performance Reporting Manchester Airport March 2018 Departure Punctuality - Mar-18 Last Month Last Year % Change Target Var to Target First Wave 79.8% 88.1% -8.3% 85.0% -5.2% Not First Wave
Corporate Presentation. Miami, FL February 25th, 2015
 Corporate Presentation Miami, FL February 25th, 2015 AGENDA LATAM Airlines in figures Cargo Unit Business Update The Company We are one of the ten largest passenger and cargo airlines in the world. PAX:
AUCKLAND INTERNATIONAL AIRPORT AKL W18 Start of Season Report (International Traffic)
") AUCKLAND INTERNATIONAL AIRPORT AKL W18 Start of Season Report (International Traffic) Key Statistics W17 Operated W18 -Season Start Percentage Change Air Transport Movements 24,66 25,73 4.5% Total Seats
AUCKLAND INTERNATIONAL AIRPORT AKL W18 Start of Season Report (International Traffic) Key Statistics W17 Operated W18 -Season Start Percentage Change Air Transport Movements 24,66 25,73 4.5% Total Seats
Executive Summary with Graphs
 Executive Summary with Graphs Invoice dates from 1/1/28 to 6/3/28 Invoice dates from 7/1/27 to 6/3/28 Invoice dates from 1/1/28 to 6/3/28 Air Charges Summary Totals Averages Transactions - Invoices: Credits:
Departure Punctuality - May-17. Departure Punctuality - Last 12 Months
 MAG Airport Name Manchester Scheduled Date Between 2017-05-01 00:00:00 and 2017-05-31 00:00:00 Operator IATA Code (Report Defaults) Departure - May-17 Last Month Last Year % Change Target Var to Target
Operational Performance Reporting Manchester Airport August 2018
 Operational Performance Reporting Manchester Airport August 2018 Departure Punctuality - Aug-18 Last Month Last Year % Change Target Var to Target First Wave 83.4% 80.2% 3.2% 85.0% -1.6% Not First Wave
Departure Punctuality - Feb-17. Departure Punctuality - Last 12 Months
 Operational Performance Reporting Manchester Airport February 2017 Departure - Feb-17 Last Month Last Year % Change Target Var to Target First Wave 85.2% 84.3% 0.8% 85.0% 0.2% Not First Wave 77.8% 80.5%
Departure Punctuality - Aug-17. Departure Punctuality - Last 12 Months
 Departure - Aug-17 Last Month Last Year % Change Target Var to Target First Wave 80.2% 83.9% -3.8% 85.0% -4.8% Not First Wave 65.0% 71.0% -6.0% 85.0% -20.0% Grand Total 68.3% 73.9% -5.7% 85.0% -16.7% Departure
SFO International Gateway Forum China Market Development. December 4, 2014
 SFO International Gateway Forum China Market Development December 4, 2014 United at San Francisco United is proud to be the leading airline serving San Francisco #1 in daily flights, destinations served
busiest routes Key facts behind the world s 20 busiest routes
 busiest routes Key facts behind the world s 2 busiest routes Based on frequency in the 12 months to February 218 Key facts behind the world s 2 busiest routes About OAG busiest routes OAG takes a closer
Heathrow Airport LHR Winter 2013/14 (W13) Start of season
 Start of season") Heathrow Airport LHR Winter 213/14 (W13) Start of season KEY STATISTICS Winter 213/14 vs Winter 212/13 Air Transport Movements 193,618.4% Passenger Air Transport Movements Allocated 192,627.6% Total Seats
Heathrow Airport LHR Winter 213/14 (W13) Start of season KEY STATISTICS Winter 213/14 vs Winter 212/13 Air Transport Movements 193,618.4% Passenger Air Transport Movements Allocated 192,627.6% Total Seats
Airline Performance and Capacity Strategies Dr. Peter Belobaba
 Airline Performance and Capacity Strategies Dr. Peter Belobaba Istanbul Technical University Air Transportation Management M.Sc. Program Network, Fleet and Schedule Strategic Planning Module 18 : 13 March
Departure Punctuality - Sep-17. Departure Punctuality - Last 12 Months
 Departure Punctuality - Sep-17 Last Month Last Year % Change Target Var to Target First Wave 73.0% 82.7% -9.7% 85.0% -12.0% Not First Wave 60.9% 73.4% -12.5% 85.0% -24.1% Grand Total 63.5% 75.5% -12.1%
TRANSFORMING INTO A GLOBAL CHAMPION
 TRANSFORMING INTO A GLOBAL CHAMPION Benjamin Smith President, Passenger Airlines August 31, 2015 TRANSFORMATION PLAN ACCELERATED, BALANCED TRANSFORMATION OF AIR CANADA TOWARD SUSTAINED PROFITABILITY Between
Departure Punctuality - Oct-17. Departure Punctuality - Last 12 Months
 MAG Airport Name Manchester Scheduled Date Between TIMESTAMP '2017-10-01 00:00:00' and TIMESTAMP '2017-10-31 00:00:00' Departure - Oct-17 Last Month Last Year % Change Target Var to Target First Wave 88.1%
trends bulletin
 www.enac.fr Main airlines traffic 1 st quarter 2013 Airlines RPK* (millions) 12/11 (%) UNITED HOLDING 288 680-1,3-1,6 DELTA AIR LINES 271 808 0,7 1,7 AIR FRANCE - KLM 223 887 3,1 0,8 AMERICAN AL 203 299-0,1
Results of Airline Survey on Cargo Messaging
 IATA Cargo Messaging Survey 1 INTERNATIONAL AIR TRANSPORT ASSOCIATION 2011 Cargo Business Process Panel INTERNATIONAL AIR TRANSPORT ASSOCIATION 2010 Results of Airline Survey on Cargo Messaging September
Malaysia s s 2020 Vision
 Kuala Lumpur International Airport: The New Southeast Asia Airline Hub? Lev Pinelis, M.S. Transportation December 7 th, 2004 1.231 Airport Systems Planning, Design, and Management Malaysia s s 2020 Vision
R / E CLASS SPECIAL - FOR TRAVEL OUTBOUND : 12/17/15-1/31/16 ONLY
 (SOME CX/KA CODED FLIGHTS ARE OPERATED BY OTHER CARRIERS, SO LONG AS IT IS A CX/KA CODED FLIGHT IT IS ALLOWED TO BE INCLUDED IN DISCOUNT AS SHOWN BELOW (SEE DIFFERENT ALLOWANCE FOR CX/AA CODESHARE DFWHKGDFW).
Workshop: Crisis in Aviation: Reinventing the airline business
 Workshop: Crisis in Aviation: Reinventing the airline business Bremen 26 th / 27 th June 2003 Airline Alliances How well are they performing in times of crisis? Alternative: A New Business Model what s
Brighter Skies: Challenges and Opportunities for Asia Pacific Aviation. Andrew Herdman, Director General ASSOCIATION OF ASIA PACIFIC AIRLINES
 Brighter Skies: Challenges and Opportunities for Asia Pacific Aviation Andrew Herdman, Director General ASSOCIATION OF ASIA PACIFIC AIRLINES Royal Aeronautical Society Evening Lecture MIAT, Universiti
Network of Airports in Vietnam
 This is the most convenient way to enter Vietnam. Formalities at Vietnam s international airports are generally smoother than at land borders, as volume of traffic is greater. Network of Airports in Vietnam
AUCKLAND INTERNATIONAL AIRPORT AKL S18 Season Start Report (International Traffic)
") AUCKLAND INTERNATIONAL AIRPORT AKL S18 Season Start Report (International Traffic) Key Statistics S17 Operated S18 -Season Start Percentage Change Air Transport Movements 31,827 33,23 3.8% Total Seats
AUCKLAND INTERNATIONAL AIRPORT AKL S18 Season Start Report (International Traffic) Key Statistics S17 Operated S18 -Season Start Percentage Change Air Transport Movements 31,827 33,23 3.8% Total Seats
Changi Airport Group recognises top airline partners for contributions to the Singapore air hub
 Media Release Changi Airport Group recognises top airline partners for contributions to the Singapore air hub Xiamen Airlines named Partner of the Year at Changi Airline Awards 2016 SINGAPORE, 28 April
Airbus vs. Boeing. Dr David Rees
 Airbus vs. Boeing Dr David Rees Brief History Founded in Seattle, 1916 Production scaled up during WW2 US first commercial jet airliner, 1958 Active participation in Apollo program, Hydrofoil, submarine
Facts & Figures. Non-US Airline Traffic Aircraft Data. Aircraft Values. US Consumer Complaints February US Fuel Cost And Consumption
 Facts & Figures Aircraft Data Aircraft Values Aircraft E-190 CRJ900 RJ100 MTOW 105.4-114.2 80.5-84.5 97.5-101.5 Engine Types CF34-10E5 92; CF34-10E5A1 87; CF34-10E6 99; CF34-10E6A1 28; CF34-10E7 10 CF34-8C5
ANA Group Announces Its Fiscal Year 2019 Flight Schedule
 ANA NEWS ANA Group Announces Its Fiscal Year Flight Schedule ANA plans to accelerate growth by expanding its international network. New state-of-the-art aircraft will be introduced to further improve passenger
Turkish Cargo Announces the Opening of its New Cargo Terminal
 2015 Istanbul, February 5 th Turkish Cargo Announces the Opening of its New Cargo Terminal As Turkish Airlines has grown over the past decade, Turkish Cargo has seen similar expansion. Not only has its
01/2016. Main airlines traffic 2015 (1) RPK* (millions) /14 (% ) 1st quarter 16/15 (% ) Airlines
 RPK* (millions) /14 (% ) 1st quarter 16/15 (% ) Airlines") Main airlines traffic (1) Airlines RPK* (millions) AMERICAN AL GROUP 321 000 3,6 3,1 DELTA AIR LINES 303 100 4,0 3,2 UNITED HOLDING 295 500 2,6 0,5 EMIRATES AL 251 200 8,8 nd AIR FRANCE/KLM 235 700 2,8
Main airlines traffic (1) Airlines RPK* (millions) AMERICAN AL GROUP 321 000 3,6 3,1 DELTA AIR LINES 303 100 4,0 3,2 UNITED HOLDING 295 500 2,6 0,5 EMIRATES AL 251 200 8,8 nd AIR FRANCE/KLM 235 700 2,8
incheon international airport
 incheon international airport By phone Call IIA Information with any questions about Incheon International Airport. Tel: 1577-2600 Internet Service The detailed information on airport facilities, aircraft
Principal, ITFT College, Chandigarh.
 Paper 8: Cargo Operations and Management Module-32: Leading Airline Cargo Players THE DEVELOPMENT TEAM Principal Investigator Co-Principal Investigator Paper Coordinator Paper Co-Coordinator Content Writer
Alliances, Open Skies And Antitrust Immunity
 Alliances, Open Skies And Antitrust Immunity MLIT Tokyo, Japan November 13, 2008 Mark F. Schwab Vice President Pacific United Airlines Agenda Liberalization and Alliances Alliances with Antitrust Immunity
trends bulletin
 www.enac.fr Main airlines traffic 1 st quarter 2012 Airlines RPK* (millions) 11/10 (%) 12/11 (%) DELTA AIR LINES 310 228-0,2 1,0 UNITED HOLDING 292 520-1,7 0,1 AIR FRANCE - KLM 214 956 6,9 7,2 AMERICAN
Safety First, Quality Always
 Safety First, Quality Always WILLIS IATA AAPA ASIA PACIFIC AVIATION INSURANCE CONFERENCE Ivan Chu Chief Executive Cathay Pacific Airways 1 Introduction Strategies and Challenges 2 A Home Carrier in Hong
Dear participants of the conference!
 Dear participants of the conference! Let me assure you of my sincere respect and greet you on behalf of Turkmenkhowayollary State Civil Aviation Department. First of all, I thank you for your attention
Cathay Pacific Airways Analyst Briefing 27 November 2012
 Cathay Pacific Airways Analyst Briefing 27 November 2012 1 Trading Statement 2012 A very challenging year High fuel prices Soft premium demand High competition in Economy Class putting pressure on yield
Global Airline On-time Arrival Performance Report October 2014
 Global Arrival Performance Report October 2014 Copyright @ 2014 VariFlight.com 1 Contents > > Part I Major Arrival Performance Figure 3 Part II Major Arrival Data 6 Copyright @ 2014 VariFlight.com 2 Part
Statistical Report Calendar Year 2013
 Statistical Report Year 213 Houston Airports P.O. Box 616 Houston, TX 7725-16 Request for User Input The intent of the monthly and annual statistical reports is to provide data that is both relevant and
AUCKLAND INTERNATIONAL AIRPORT AKL W13 Season Start IATA Report (International Traffic)
") Page 1 AUCKLAND INTERNATIONAL AIRPORT AKL W13 Season Start IATA Report (International Traffic) Key Statistics W12 Operated W13 -Season Start Percentage Change Air Transport Movements 18,744 19761 5.4%
Page 1 AUCKLAND INTERNATIONAL AIRPORT AKL W13 Season Start IATA Report (International Traffic) Key Statistics W12 Operated W13 -Season Start Percentage Change Air Transport Movements 18,744 19761 5.4%
trends bulletin 07/2011 Main airlines traffic 1 s quarter 2011 Main low cost airlines
 www.enac.fr Main airlines traffic 1 s quarter 2011 Airlines RPK* (millions) 2010** 10/09 (%) DELTA AIR LINES 310 900 2,2 1,3 UNITED / CONTINENTAL (1) 226 700-12,2-2,8 AMERICAN AL 201 900 2,5 1,6 AIR FRANCE-KLM
STATISTICAL REPORT Fiscal YEAR SUMMARY. Houston Airport System P.O. Box Houston, TX
 STATISTICAL REPORT 215 Fiscal YEAR SUMMARY P.O. Box 616 Houston, TX 7725 16 Table of Contents 1 Aircraft Operations 2 3 George Bush Intercontinental 4 William P. Hobby 5 Originating Enplaned 6 7 8 Passenger
ANA Fact Book All Nippon Airways Co., Ltd. Contents
 All Nippon Airways Co., Ltd. Contents 2 Domestic Passenger Market 4 International Passenger Market 5 Cargo Market 6 Haneda and Narita Airports 7 Global Alliance Statistics 8 Aircraft Specifications 9 Consolidated
Air India E-ticketing Policy - 01 June 08
 Air India E-ticketing Policy - 01 June 08 As you are aware, IATA has advised that all paper ticket stocks from BSP Agents worldwide, will be withdrawn as of 31 May 2008. ACIL dba Air India is committed
Air Surcharge Info. Apr. 2016
 Air Surcharge Info. Apr. 2016 01 From Japan Effective 2016/04/01~04/30 CA 999 Air China JPY24 JPY600 C W CI 297 China Airlines JPY6 JPY500 C W JL 131 Japan Airlines - - C W KE 180 Korean Air JPY13 JPY450
TRANSFORMATION. Briefing. Thai Airways International PCL. 5 February 2015
 Thai Airways International PCL 5 February 2015 TRANSFORMATION Briefing Operating Environment Environment Changes SEA was Asia s hub Middle East emerging as the new World hub Longer range aircraft technology
Airport On-time Departure Performance (Feb. 2018)
") Airport (Feb. 2018) Powered by VariFlight incomparable aviation database, the monthly report of Airport provides an overview of how global airports are performing in February, 2018. Global Hubs Congonhas
Airport (Feb. 2018) Powered by VariFlight incomparable aviation database, the monthly report of Airport provides an overview of how global airports are performing in February, 2018. Global Hubs Congonhas
Los Angeles World Airports (LAWA) Traffic Comparison (TCOM) Los Angeles International Airport Calendar YTD January to December
 Traffic Comparison (TCOM) Los Angeles International Airport Calendar YTD January to December") Los Angeles World Airports (LAWA) Traffic Comparison (TCOM) Los Angeles Airport Calendar YTD January to December Jan-214 Jan-213 to to Dec-214 Dec-213 % Change Dec-214 Dec-213 % Change Passenger Traffic
Los Angeles World Airports (LAWA) Traffic Comparison (TCOM) Los Angeles Airport Calendar YTD January to December Jan-214 Jan-213 to to Dec-214 Dec-213 % Change Dec-214 Dec-213 % Change Passenger Traffic
OUR WORLD WORKS FOR YOU
 OUR WORLD WORKS FOR YOU ABOUT WFS 22,800 Airport service professionals working for you all over the world. 198 Global locations on five continents. 1,2 billion Annual sales, enabling us to invest in the
Moving into a new era of growth -Directions and drivers
 Moving into a new era of growth -Directions and drivers Peter Harbison, CAPA Centre for Aviation CAPA India Aviation Summit, Mumbai, 30 January 2018 Basics in uncertain times 1. Fuel prices: a threat?