THAI AIRWAYS INTERNATIONAL PCL Year 2011 Analyst Briefing
|
|
|
- Paul Ryan
- 5 years ago
- Views:
Transcription

1 THAI AIRWAYS INTERNATIONAL PCL Year 2011 Analyst Briefing 1 Investor Relations Department
2 DISCLAIMER The information contained herein is intended to represent the Company s operating and financial position at a given point in time and may also contain forward looking information which only reflects expectations based on the prevailing geopolitical, economic and noncontrollable factors. Such information has been obtained from sources believed to be most reliable and the means in analyzing and preparation of such information for disclosure are based on approved practices and principles in the investment industry. The views are based on assumptions subject to various risks and uncertainties and no assurance is made as to whether such future events will occur, that projections will be achieved, or that the assumptions herein are correct. Consequently no assurance is made as to the accuracy or completeness of information presented in this document. This document should not be construed as an investment guide or as an offer or solicitation of an offer to buy or sell the Company s equity shares. 2 Investor Relations Department
3 Business Overview 3 Investor Relations Department
4 Business Overview THAI Airways International PLC. Business Units Ground Services Total Revenue 194,342 MTHB (2011) Passenger and excess baggage ~ 80 % Freight and mail ~ 15 % Other activities ~ 5 % 55% 49% 49% 49% 49% Thailand Budget Airline Tour Eurng Luang 4 Investor Relations Department


5 Business Overview Core Business Air Transportation Technical Department Able to Maintain Over 90% of Aircraft Availability Staff: 4,436 persons Outsource: 347 persons 5 Investor Relations Department


6 Business Overview Business Units Cargo Handling Catering Total Rev. 2,544 MTHB/Year (External Rev % ) Staff 1,679 Persons Outsource 1,158 Persons Production 57,660 Meal/day Total Rev. 6,030 MTHB/Year (External Rev %) Staff 1,952 Persons Outsource 1,898 Persons THAI Smile THAI Ground Services หน วยธ รก จการบ น ราคาประหย ด Ticket Sale: 1 April 2012 Inauguration: 1 July 2012 Ground Service Ground Support Equipment Total Rev. 7,567 MTHB/Year (External Rev % ) Staff 4,328 Persons Outsource 3,437 Persons 6 Investor Relations Department
7 2011 Snapshot 7 Investor Relations Department
 Assets 274,445 8,630 7.")
 5,489 173 172.")
8 Snap Shot 2011 MTHB USD mn. Equiv. % Change (YoY) Assets 274,445 8, % Total Revenue 194,342 6, % Net Profit (Exclude FX) 5, % # of Aircraft 89* Destinations Served 71 Countries Served 35 *Excluding 6 B leased to Nok Air 8 Investor Relations Department
9 Operation Summary Units Feb./2012 Feb./2011 Passenger Production MASK 6,318 6,098 Passenger Traffic MRPK 4,992 4,731 Cabin Factor % Passenger carried Million 1,653 1,570 Passenger Yield* THB/km % Change +3.6% +5.5% 1.8% 5.3% 2.1% Freight Production MADTK Freight Traffic MRFTK Freight Factor % Freight carried Tons 54,707 51,390 Freight Yield* THB/km % +0.6% 3.4% +6.5% +3.7% Avg. Fuel Price** USD/BBL (E) % Note : *Yield includes fuel surcharge **Intoplane price 9 Investor Relations Department
10 Revenue By Class By Area Jan.Dec First class 1.6% Business class 21.1% Premium economy class 1.1% Australia 10.7% Europe 30.4% North Pacific 2.4% Africa 0.8% Domestic 9.2% Economy class 76.1% Northern 26.4% IndoChina 2.4% Middle East 1.5% Southern 7.9% Western 8.2% Passenger revenue* = 151,164 MTHB * Schedule flight only 10 Investor Relations Department
11 # of PAX By Class By Area Jan.Dec Non Revenue 3.1% First class 0.3% Business class 8.7% Premium economy class 0.3% Australia Middle East 5.8% 1.3% Northern 25.4% Europe 12.9% North Pacific 0.7% Africa 0.4% NonSchedule 0.3% Domestic 29.6% Economy class 87.6% Southern 8.9% Western 10.0% IndoChina 4.7% Total passengers in 2011 = 18.4 mn. Total passengers in 2010 = 18.2 mn. 11 Investor Relations Department
12 Market Share of LCCs Up Dramatically Domestic Market Regional Market Mn Passengers 15 Market Share Avg. Growth Rate ( ) Mn Passengers 25 Market Share Avg. Growth Rate ( ) % Others LCCs 15.0% 45.2% 7.4% 32.4% % 2.1% Others LCCs 47.6% 19.1% 4.4% 46.8% 83.8% THAI Airways 39.8% 2.3% % THAI Airways 33.2% 3.2% Investor Relations Department
13 Strategies 13 Investor Relations Department
14 Headwinds Factors Affecting Aviation Business Natural Disasters Rate of Economic Growth Rapid Rise in Fuel Price FX Fluctuation New Aircraft Technology /Trend Competition from LCCs / Traditional Airlines/ New Full Network Carriers THAI is taking precautionary actions to mitigate all risk factors ASEAN Open Sky and Liberalization Policy EU Carbon Emissions Guideline Availability of Aircraft Financing Availability of New Aircraft Acquisition, Aging Fleet & Seat Global Politics Health 14 Investor Relations Department
15 Synthesizing Environmental Factors into Strategies Environment and Competition Analysis Core Values Corporate Strategies Lost Customer 1 Corporate Portfolio Aging Fleet and Seats New Product Trend Unmodernized ICT Customeroriented 2 3 Customer Value Route Network and Fleet Aircraft Technology 4 Commercial Yield Cost Competitive 5 Corporate Social Responsibility Fuel 6 IT Competition Rules and Regulations 7 Strategic Cost Management Crisis Operation Dynamic 8 Human Capital and Organization Effectiveness Funding Foreign Exchange 9 Financial 15 Investor Relations Department


16 Strategy to close THAI s business gap THAI Smile to complement THAI s product offering Brand positioning matrix for THAI and affiliated companies Product Offering Premium full service Premium 3 class Premium 2 class Premium regional (wide body) 2 Class 2 Class Launch July 2012 No frills THAI LCC Stage length small* big connecting Regional Intercontinental Domestic Note: * NOK focuses on DMK only; ** Possibilities surrounding expanding fleet to include widebody aircraft will be evaluated as opportunities arise 16 Investor Relations Department


 2018 11 17 Investor")
17 THAI Smile A New Chapter THAI Smile s first flight will commence on July 1st, 2012 after receiving first brand new aircraft in June 2012 Brand new narrow body aircraft # of aircraft Positioning Differentiation Character Value Affordable Light Premium Good Price High Value BRAND Trendy Friendly Worthy Reliable Enjoyable Valuable Fleet Plan (2012F18F) Investor Relations Department


18 Nok Air & THAI Smile Routes Network Nok Air base at DMK, operates only domestic pointtopoint. Mae Hong Son Chiangmai THAI Smile base at BKK, operates in domestic and regional secondary routes and synchronize with TG network. Mae Sot Nan Loei Phitsanulok Udon Thani Sakon Nakhon Nakon Phanom Kaohsiung Macau Shenzhen Roi Et Buri Ram Ubon Ratchathani Kaohsiung Bangkok DMK Surabaya Surat Thani Phuket Nakon Si Thammarat Trang Hat Yai Narathiwat 18 Investor Relations Department 18


19 Current Fleet Current Fleet: 89 Aircraft 51% of O 9% of OL 40% of FL O=Owned OL=Operating lease FL=Financial lease (Note: Approximately) Aircraft Type A Exc. 2 of ATR72 4 of leased to Nok First Business Premium Economy Economy Total 36R1 6 N.A. 46 N.A N.A. 28 N.A A N.A O, 3 FL A N.A FL A N.A. 42 N.A N.A. 36 N.A B N.A. 12 N.A FL, 3 OL B N.A N.A B N.A. 30 N.A O, 2 OL B777200ER 77E1 6 N.A. 30 N.A FL B Version # of Aircraft # of Seat N.A. 34 N.A TKE 1 N.A. 34 N.A Financial Method B777300ER N.A OL Total ,528 4, O, 38 FL, 12 OL 11 O 10 O, 10 FL,2 OL 11 O, 5 FL 6 FL (Note: N.A.. = Not available) 19 Investor Relations Department
20 Aircraft Utilization Aircraft Utilization Hours / Day / Aircraft Jan Feb Mar Apr May Jun Jul Aug Sep Oct Nov Dec Investor Relations Department
21 Aircraft Delivery Plan NEW A/C DELIVERY TOTAL A (FL) 3 (FL) 6 B777300ER 2 (OL) 6 (OL) 3 (FL) 3 (FL) 14 A (FL) 2 (FL) 5 A (FL)I + 2 (OL)R 2 (FL)I + 6 (OL)R 12 B (OL) 2 B (OL) 2 (OL) 6 A320 4 (OL) 2 (OL) 2 (FL) 3 (FL) 11 TOTAL Note : OL FL I R = Operating lease = Financial lease = Intercontinental = Regional 21 Investor Relations Department
22 Phase Out Plan PHASEOUT PLAN TOTAL B B777300ER (Jet Airways) 5 5 A B A A B * 1* ATR72 2* 2 TOTAL Note : * Return from Nok Air 22 Investor Relations Department
23 Efficiency Derived from New Aircraft New aircraft will bring cost benefits in terms of fuel per ATK and maintenance cost per ATK Fuel efficiency improve ~1.3% per year from Save 5,823 MTHB Maintenance cost per ATK decrease 3.2% from Save 3,460 MTHB Litre / ATK THB / ATK CAGR 1.3 % CAGR 3.2 % % Change Fuel Consumption per ATK Improvement % Change Maintenance Cost per ATK Improvement 23 Investor Relations Department


24 Upgrades and Retrofit Schedule Product commonization to improve customer experience, retention & improved yields # of Aircraft First Business Economy Tentative Completion B No Retrofitted Retrofitted Jun. Dec. 2011* (Four have been completed) B No Apr.Oct B No. 1 1 Retrofitted Dec * B No Retrofitted Mar. Dec. 2012* * Note: Completion of retrofit has been postponed due to Don Mueang but will likely be completed by Investor Relations Department

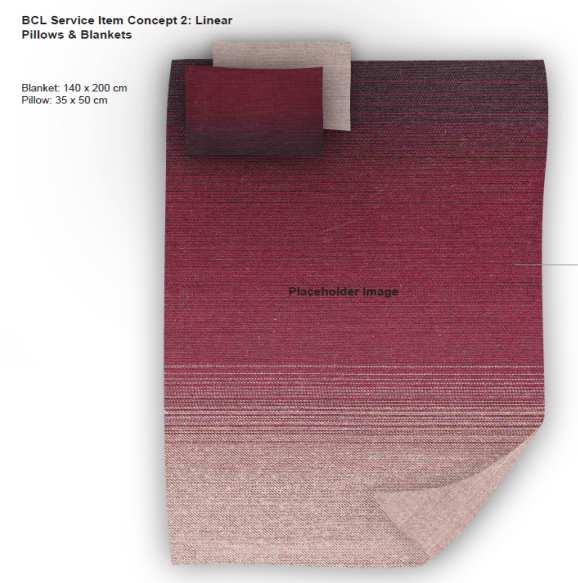


25 The New Look Synchronization with Touches of Thai and Green concept Cabin interior, Onboard products & services master design by Priestmangoode 25 Investor Relations Department


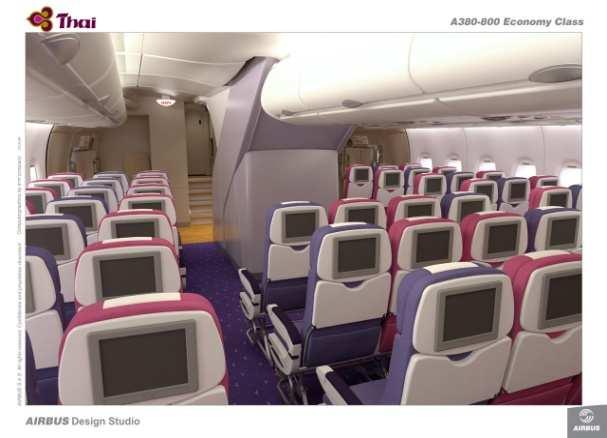
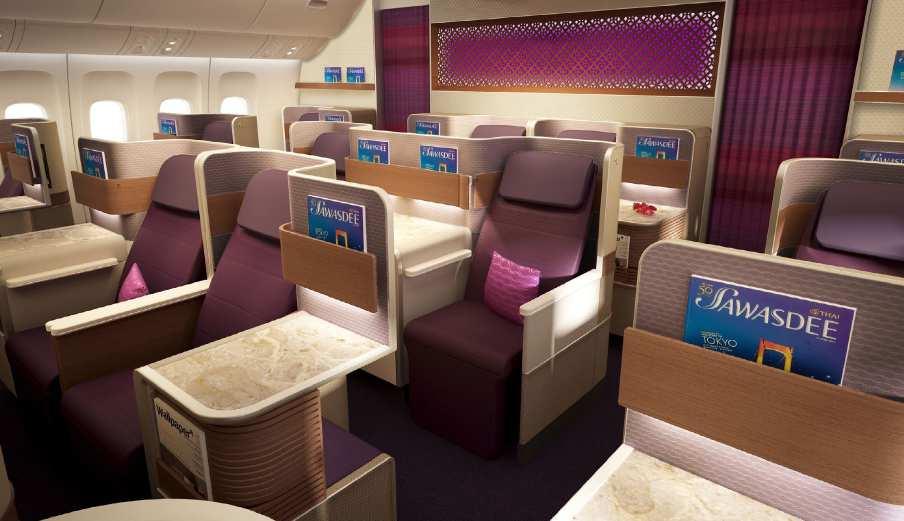
26 New Aircraft A330 & A380 New Airbus A Royal First class New Airbus A Royal Silk Class Royal Silk Class Economy Class Economy Class 26 Investor Relations Department
27 New Generation Aircraft: A350 & B787 A % Composite Lower fuel burn (Compare to today generation) Lower maintenance costs (Compare to today generation) Family A A A B % Composite Lower fuel burn (Compare to today generation) Lower maintenance costs (Compare to today generation) Family B7879 B Investor Relations Department
28 New Interactive InFlight Entertainment Full Audio Video on Demand (AVOD) in all classes (Except A330300, A and B737400) Entertainment Movies: Movies: titles titles Short Short program: program: programs programs CD CD Album: Album: albums albums Games: Games: games games USB USB plug plug and and play play Onboard Services EMeal EMeal Menu Menu EDuty EDuty Free Free Shopping Shopping EMagazine EMagazine Seat Seat Chat Chat EDuty Free Shopping EMeal Menu Connectivity Voice Voice Call Call SMS SMS Text Text Messaging Messaging GPRS GPRS Internet Internet Access Access Infotainment About About THAI THAI Airport Airport Information Information Window Window on on Thailand Thailand EDuty Free Shopping Travel Travel Destination Destination Information Information 28 Investor Relations Department


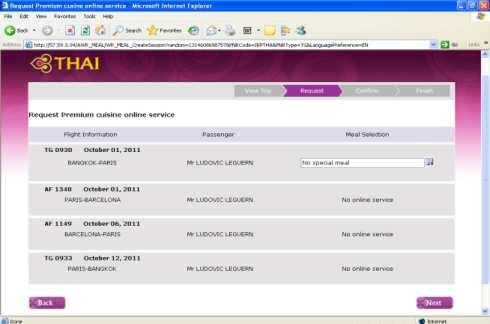


29 Food and Beverage Chef gallery More varieties, more menus Introduce special occasion menus Online Preorder meal for First and Business class 29 Investor Relations Department


30 ROP: Royal Orchid Plus New Loyalty System Global Tour Management System ROP Consumer Mile & Ancillary Services Market & Customer Analysis Better understand market outlook and customer profile in each market 30 Investor Relations Department
31 CSR : Corporate Social Responsibilities Clear CSR s Policy & Process integrate to all process & all touch points Social Contribution Flood Donation CSR Project Society Support Youth Sports program Academic Olympics Environment Engagement CSR Communication & Sustainability Report Carbon Footprint Bio Jet Fuel 31 Investor Relations Department

32 Route Network and Fleet Route Network Strategy Fleet Strategy Develop Bangkok and Thailand as main hub by implementing more direct flights into Thailand, focus on increasing frequency and hub connectivity Enhance network strength in key markets to maintain leading market positioning and build network strength around home base Expand network to secondary regional routes, operating narrow body aircraft with light premium service Establish THAI LCC to compete in price sensitive market Leverage of alliances and strategic partners to expand network and cover all market segments Increase flight schedule flexibility in response to demand dynamic, seasonality and competitive environment Develop HKT into a 2 nd key point of interest Improve fleet efficiency to lower maintenance and fuel expense, reduce environmental impact and increase asset utilization Secure longterm fleet delivery positions to ensure young & fuel efficient fleet and support growth Implement fleet simplification over the longterm to reduce operating cost and improve operating efficiency Match aircraft size with demand and competition Design proper seat configuration to maximize competitive advantage 32 Investor Relations Department
 Total International Countries 34 Cities 61 Freq.")
33 World Route Network THAI s s Route Network Route (as Dec. 11) Total International Countries 34 Cities 61 Freq./Week Investor Relations Department
34 Domestic Route Network THAI s s Route Network MAE HONG SON CHIANG RAI CHIANG MAI UDON THANI PHITSANULOK KHON KAEN NAKHON PHANOM Route (as Dec. 11) Domestic BURIRAM UBON RATCHATHANI Cities 10 Freq./Week 283 BANGKOK THAI Nok Air (Code Share) SAMUI SURAT THANI PHUKET KRABI HAT YAI 34 Investor Relations Department

35 THAI s Phuket Route Network Sector (as 31 OCT 11) Freq./Week Copenhagen Phuket 3 Phuket Hong Kong vv. DAILY Phuket Seoul vv. 3 Phuket Perth vv. 3 Phuket Bangkok vv Investor Relations Department
36 Commercial Strategy IntraAsia Secondary Destination Explore revenue in other markets. Developing new routes that show strong potential in business and leisure traffic by exercising 5 th Freedom rights. i.e. HKTHKGTPE, BKKTPECTS Widen coverage to secondary cities both regional and intercontinental routes using Everywhere NonStop to Bangkok or Phuket concept. i.e. BKKBRUBKK, HKTICNHKT, CPHHKT Network Sales Ancillary Revenue Boost Revenue and mitigate any downside effects in Bangkok and within Thailand. Explore ancillary revenue options i.e. travel insurance, car rental, hotel accommodation, consumer miles. 36 Investor Relations Department
37 IT Development Infrastructure Redesign and Migrate to Cloud EPayment Gateway Mobile Capability Data Management Enterprise Resource Planning (ERP) Internal Cooperation ECollaboration / Knowledge management Revenue Enhancement CRM / Cross Function Database 37 Investor Relations Department
38 Statistic on eservice Ticket Sales Via Internet Checkin via Internet % Jan Feb Mar Apr May Jun Jul Aug Sep Oct Nov DEC % Year 2009 Year 2010 Year 2011 Year 2009 Year 2010 Year Jan Feb Mar Apr May Jun Jul Investor Relations Department Aug Sep Oct Nov Dec
39 Statistic on eservice Checkin via Mobile ( # of PAX 6,000 5,437 5,000 3,812 3,811 4,000 3,000 3,310 3,088 2,321 2,368 2,309 3,353 3,472 2,000 1,136 1,300 1,813 1, Jul 10 Aug 10 Sep 10 Oct 10 Nov 10 Dec 10 Jan 11 Feb 11 Mar 11 Apr 11 May 11 Jun 11 Jul 11 Aug 11 Sep 11 Oct 11 Nov 11 Dec 11 Jan Investor Relations Department
40 Risk Mitigation 40 Investor Relations Department
41 Rising Fuel Cost Price of Jet Fuel (USD/BBL) (Singapore Spot Price) Iran still a hot potato USD/BBL (Jan.Dec. 11) 39% Higher YoY Oct07 Jan08 Apr08 Jul08 Oct08 Jan09 Apr09 Jul09 Oct09 Jan10 Apr10 Jul10 Oct10 Jan11 Apr11 Jul11 Oct11 Jan12 41 Investor Relations Department Jul07 Jan07 Apr07 Oct06 Jul06 Apr06 Jan06
42 Fuel Management Hedging combined with fuel surcharge greatly mitigates fuel price fluctuation risk Monthly fuel hedging % of consumption by month Percentage of Fuel Surcharge & Hedging Coverage Jan08 Feb08 Mar08 Apr08 May08 Jun08 Jul08 Aug08 Sep08 Oct08 Nov08 Dec08 Jan09 Feb09 Mar09 Apr09 May09 Jun09 Jul09 Aug09 Sep09 Oct09 Nov09 Dec09 Jan10 Feb10 Mar10 Aprl10 May10 Jun10 Jul10 Aug10 Sep10 Oct10 Nov10 Dec10 Jan11 Feb11 Mar11 Apr11 May11 Jun11 July11 Aug11 Sep11 Oct11 Nov11 Dec11 Jan12 57% 65% 62% 56% 51% 51% 61% 65% 69% 72% 72% 63% 82% 74% 123% 131% 116% 102% 91% 77% 78% 118% 112% 102% 110% 104% 98% 94% 116% 106% 111% 103% 109% 101% 102% 98% 87% 88% 95% 95% 97% 103% 96% 97% 97% 118% 163% 143% 199% Jan08 Feb08 Mar08 Apr08 May08 Jun08 Jul08 Aug08 Sep08 Oct08 Nov08 Dec08 Jan09 Feb09 Mar09 Apr09 May09 Jun09 Jul09 Aug09 Sep09 Oct09 Nov09 Dec09 Jan10 Feb10 Mar10 Apr10 May10 Jun10 Jul10 Aug10 Sep10 Oct10 Nov10 Dec10 Jan11 Feb11 Mar11 Apr11 May11 Jun11 Jul11 Aug11 Sep11 Oct11 Nov11 Dec11 Jan12 Feb12 Mar12 Apr12 May12 Jun12 Jul12 Aug12 Sep12 Oct12 Nov12 Dec12 0% 0% 0% 0% 3% 3% 3% 7% 17% 38% 41% 44% 44% 35% 27% 20% 23% 13% 13% 17% 49% 20% 27% 30% 44% 44% 44% 47% 47% 47% 51% 51% 51% 50% 50% 56% 69% 69% 69% 69% 69% 69% 80% 80% 80% 80% 80% 80% 73% 73% 73% 75% 75% 75% 78% 78% 78% 68% 68% 68% 42 Investor Relations Department


43 Emissions Control IATA Carbon Offset Program 1 st airline THAI is the first Asian airline with IATA to find means to offset fuel burn Carbon Footprint Emissions Trading 2012 Monetary Value Amount of Shortfall Carbon Credit ~200 MTHB Determined the carbon footprint of 2 meals and provided labeling declaring carbon quantity for customers as their choice CERs 60% EUAs 40% 43 Investor Relations Department
44 CO 2 emission improvement Carbon emission in Europe will be averagely reduced by 1.5 % ( ) 2017) CO 2 (Kgs / ATK) CAGR 1.5% % Change Investor Relations Department

45 Pending Legal Issues EC US Cargo DOJ US Cargo Class Action Korea Rescinded all charges against THAI Stopped further proceedings Settled by paying USD 3.5 mn Pending charges is for KW 2.85 mn MTHB In 2008 Put in reserve 4,290 In 2010 Wrote back 1,783 In 2011 Wrote back 1,042 Outstanding in reserve 1, Investor Relations Department
46 Financial Performance 46 Investor Relations Department
47 Malaysian Air in Crisis with 4 th Quarterly Loss Now, Jet Airways Seeks Monetary Help from Lenders Air Australia Grounded Amid Financial Woes 47 Investor Relations Department Troubled Kingfisher Puts Bankers in a Bind SIA: Third Quarter Profit Down 53% to $135 Million Qantas Profit Slumps in H1 Citi: Air Asia Flying into a More Turbulent 2012 Latest News
48 Performance Summary (Year 2010 & Year 2011) THAI and its subsidiary Financial Performance (Units : MTHB) Total Revenue 184, ,342 Total Expense 171, ,175 Foreign currency exchange (Loss) 9,106 2,428 Financial Cost 5,166 5,656 Profit (Loss) before finance costs, income tax 16,657 7,917 Net tax expense (income) 1,865 2,245 Net profits (loss) 14,744 10,197 * Net profit (loss) include noncontrolling interests 48 Investor Relations Department
49 Financial Performance EBIT, EBITDA and Net Profit (Year 2010 & Year 2011) Units : MTHB 30,000 20,000 10,000 10,000 20,000 7,831 2,782 28,067 17,207 14,744 7,551 10,197 5,489 EBIT EBITDA NET PROFIT NET PROFIT (Exclude FX Year 2010 Year 2011 & tax impact) Factors Impacting Year 2011 Results Fuel cost 39% higher than last year Impact from earthquake hitting Japan US & European economic slowdown Flooding in Thailand THB relatively weaker Impact from deferred tax expenses 2,407 MTHB 49 Investor Relations Department

50 Net Profit of Core Business & Business Unit Core Business 3,540 MTHB Business Units 781 MTHB 2,177 MTHB Total Net Net Loss 4,321 MTHB* MTHB* *Exclude *Exclude : : 2,428 2,428 MTHB MTHB FX FX Loss Loss : : 2,407 2,407 MTHB MTHB Deferred Deferred Tax Tax : : MTHB MTHB Flood Flood Support Support : : MTHB MTHB Vacation Vacation Comp. Comp. : : 1,042 1,042 MTHB MTHB Antitrust Antitrust reserve reserve 1,606.9 MTHB Freighter MTHB Belly Ground Services MTHB Cargo Handling 471 MTHB 925 MTHB 50 Investor Relations Department
51 Financial Performance Operating / Total Revenue (Year 2010 & Year 2011) Operating Revenue Total Revenue Units : MTHB 220, , , ,000 *Operating Rev. up 5.76% 3,497 7,496 27, ,634 27, , Revenue % Change Tot. Rev. Passenger Freight , ,000 Mail ,000 80,000 60,000 40, , ,646 Other activities Interest income ,000 0 FY 2010 FY 2011 Other income Total Income Passenger Freight Mail Other activities Interest income Other income *Excludes Interest & Other income Operating revenue Year 2010 = 180,589 MTHB Operating revenue Year 2011 = 190,997 MTHB Total revenue Year 2010 = 184,270 MTHB Total revenue Year 2011 = 194,342 MTHB 51 Investor Relations Department
52 Operating / Total Expense (Year 2010 & Year 2011) Financial Performance Units : MTHB 200, , , , , ,000 80,000 60,000 40,000 20, ,331 20,236 9,675 5,092 9,046 19,064 56,519 Operating Expense **Operating Exp. Up 12.69% 5,429 19,989 11,698 5,485 9,042 20,427 76,388 34,525 31,009 FY 2010 FY 2011 Total Expense % Change % of Expense YoY Tot. Exp. Personnel expense Fuel and oil Flight service expense Inventories and supplies Crew expense Maintenance/overhual Depreciation/amortisation Personnel Fuel and Oil Flight Service Expense Inventory&Supply Crew Expense Aircraft Maintenance Depreciation Lease of a/c ** Excludes FX, Impairment losses and Share of profit of investments by the equity method Operating expense Year 2010 = 176,488 MTHB Operating expense Year 2011 = 198,892 MTHB Aircraft lease/spare parts Other expense Total Expense Total expense Year 2010 = 167,613 MTHB Total expense Year 2011 = 202,259 MTHB 52 Investor Relations Department
53 Estimated Cost Reduction The company is rigorously controlling and reducing expenses to achieve full efficiency and sustainability Cost Reduction Approach 1. Implemented personnel cost reduction (EMM resolution) Estimated Cost Reduction (MTHB) 1, Estimated personnel cost reduction under negotiation Cost reduction from strategic initiatives 4, Cost reduction from DO s additional measures Total estimated cost reduction 6, Note: Excluded estimated cost reduction from some projects that are specified as percentage 53 Investor Relations Department
54 Improved Capital Structure Improved Cash Position Raised 15,000 MTHB in in new new equity Received additional borrowing from financial institutions % of Cash to Total Revenue Obtained Revolving Credit Lines 8,000 MTHB Debenture issued in in May May 13, 13, Stable Capital Structure Net Interest Bearing Debt to Equity (Times) Q1/11 Q2/11 Q3/11 Q4/11 54 Investor Relations Department
55 Financial Performance Ratios Year 2010 & Year 2011 Ratios units Earnings Per Share (THB) Book Value per Share (THB) Price / Book Value (Times) P/E Ratio (Times) Return on Total Assets (%) Return on Total Equity (%) EBIT (MTHB) 7, ,782.0 EBITDA (MTHB) 28, ,207.0 EBITDAR (MTHB) 32, ,637.0 IBD to Equity (Times) Net IBD to Equity* (Times) Debt Service Coverage** (Times) Interest Coverage (Times) EBITDA Margin (%) Operating Profit Margin (%) Net Profit Margin (%) * (Interest Bearing Debt Cash and Cash Equivalent) / Equity ** EBITDAR TAX / Interest + Rent + Long Term Debt Repayment 55 Investor Relations Department


56 Current price (1Mar12) 26 THB / share 1Oct10 1Nov10 1Dec10 1Jan11 1Feb11 1Mar11 1Apr11 1May11 1Jun11 1Jul11 1Aug11 1Sep11 1Oct11 1Nov11 1Dec11 1Jan12 1Feb12 1Mar12 56 Investor Relations Department 1Aug10 1Sep10 Thai Political Unrest A+ Rating Price Volatility from External Events Peaked at THB Unrest in Middle East Earthquake and Tsunami in Japan Flood Crisis in Thailand USD/BBL (Apr. 11) Iceland Volcano Eruption European Economic Crisis 1Mar10 1Apr10 1May10 1Jun10 1Jul10 1Jan10 1Feb10
57 Key Take Aways THAI remains in fairly good shape despite difficulties in 2011 Taking drastic actions to improve competitiveness Right sizing aircraft with demand to improve on cost & margins 5% capacity shift from longhaul to shorter sectors improving yields & margins Thai Smile to build up regional connectivity & enhance competitiveness Targeting further cuts in operating cost to lower unit cost New aircraft & retrofitting to commonise product to increase fuel efficiency, improve customer value & enhance pricing power Seeking secondary city pairs to serve from Bangkok to diversify market & improve yields Developing Phuket as second point of interest to diversify market & improve yields 57 Investor Relations Department
58 Key Take Aways Diversifying & improving on echannels to improve efficiency & better suit customer needs Converting 2 B aircraft to lower cost of cargo operations instead of leasing freighter aircraft Investing in upgrading IT backbone & peripheral modules with SAP at the core of ERP Business units are increasingly being measured more independently on their stand alone performance Launched Wingspan to enhance THAI s HR cost competitiveness through outsourcing staff requirement 58 Investor Relations Department
59 Key Take Aways Mitigating risks Significantly higher amount of fuel hedging through 2012 Proactive management of liquidity & FX exposure Studying means to manage FX exposure more effectively Maintaining at least 12% cash & committed credit lines to total revenue ratio in face of global uncertainty Growth in capacity kept at a reasonable pace Studying alternative funding options to ensure flexibility Developing longterm fleet plan to ensure availability of aircraft for fleet renewal & growth 59 Investor Relations Department
60 Looking Ahead 90.0 Actual Cabin Factor Cabin Factor Estimated Booking Budget Jan12 26Feb12 Mar12 Apr B* * B = Budget Freight Factor Freighter Factor Actual Estimated Budget Jan12 26Feb B* 60 Investor Relations Department
61 Looking Ahead Looking Ahead into 2012 Much stronger travel demand for first 2 months with cabin factors averaging 77.3% & almost 80.0% for January & February Higher level and longer period of hedging provides protection in face of Middle East uncertainty Financial performance in first 2 months of 2012 is much improved than the 4 th quarter 2011 Q2 through Q were all abnormal quarters impacted by unfortunate events Barring any abnormal events, Q2 through Q should have normalized operating environment thus should lend to improved yearonyear overall financial performance 61 Investor Relations Department
62 Thank you for attending 62 Investor Relations Department
63 Appendix 63 Investor Relations Department
64 Foreign Currency Exposure (As of DEC. 2011) Revenue Expense Surplus Outstanding Borrowings or Deficit Before Swap After Swap Amount % Amount % Amount Amount % Amount % USD BASED 73, , ,151 1, ,273 1 USD 19, ,935 Others (1) 53,359 7,507 EUR BASED 54, , ,527 46, , EUR 17,126 6,804 Others (2) 36,911 6,706 JPY 17, , ,718 11, , THB 45, , ,891 83, , TOTAL 190, , , , , % 24% Revenue Expense Outstanding 28% 39% 3% 8% 23% 66% Financial Performance 58% 1% Unit : MTHB 33% 8% 64 Investor Relations Department USD BASED EUR BASED JPY THB
65 Financial Performance TG continued to be net long Euro & Yen (MTHB) 50,000 40,000 30,000 USD EUR JPY THB 27,180 40,527 20,000 10,000 9,529 12,718 5, ,000 4, ,475 20,000 30,000 40,000 50,000 Jan Dec ,151 Jan Dec Investor Relations Department
66 Financial Performance Proportion of Fixed and Float (As of Dec. 2011) Before Swap After Swap Fixed 29% Float 71% Fixed 47% Float 53% Percentage of TOTAL (TOTAL = 142,350 MTHB) Percentage of TOTAL (TOTAL = 142,444 MTHB) Cost of funding = 3.78% Cost of funding = 3.92% 66 Investor Relations Department
67 Financial Performance Proportion of Total Borrowing Before Swap (As of Dec. 2011) After Swap Medium Term Note 0.9% Debenture 19.6% Medium Term Note 0.9% Debenture 19.5% Financial Lease 40.7% Term Loan 38.9% Financial Lease 40.6% Term Loan 38.9% Percentage of Total (Total of on Balance Sheet = 142,350 MTHB) Percentage of Total (Total of on Balance Sheet = 142,444 MTHB) 67 Investor Relations Department
68 Operating Statistics Passengers Carried Q4/11 = 4.5 million (decreased 6.9% YoY) ( 000) 7,000 5,000 4,684 Year 2009 Year ,088 5,167 4,589 4,114 4,414 3,662 4,833 4,923 Year ,201 4,771 4,502 3,000 1,000 Q1'09 Q2'09 Q3'09 Q4'09 Q1'10 Q2'10 Q3'10 Q4'10 Q1'11 Q2'11 Q3'11 Q4'11 Freight Carried Q4/11 = 175,708 tons (decreased 6.6% YoY) (Tons) Year 2009 Year 2010 Year , , , , , , , , , , , , , , , ,000 Q1'09 Q2'09 Q3'09 Q4'09 Q1'10 Q2'10 Q3'10 Q4'10 Q1'11 Q2'11 Q3'11 Q4'11 68 Investor Relations Department
69 Operating Statistics Passenger (Million) Year 2009 Year 2010 Year 2011 Year 2012 (%) ,000 6,000 4,000 2, Jan09 Feb09 Mar09 Apr09 May09 Jun09 Jul09 Aug09 Sep09 Oct09 Nov09 Dec09 Jan10 Feb10 Mar10 Apr10 May10 Jun10 Jul10 Aug10 Sep10 Oct10 Nov10 Dec10 Jan11 Feb11 Mar11 Apr11 May11 Jun11 Jul11 Aug11 Sep11 Oct11 Nov11 Dec11 Jan12 Feb12 ASK RPK C/F YoY (Month) QoQ (Quarter) YoY (Quarter) YoY (Year) Feb'12 (E) Feb'11 YoY% Q4'11 Q3'11 QoQ% Q4'11 Q4'10 YoY% YoY% MASK 6,481 6, ,953 19, ,953 19, ,533 75, MRPK 5,135 4, ,968 14, ,968 14, ,267 55, Cabin factor% Investor Relations Department
70 Operating Statistics Freight (Million) Year 2009 Year 2010 Year 2011 Year 2012 (%) Jan09 Feb09 Mar09 Apr09 May09 Jun09 Jul09 Aug09 Sep09 Oct09 Nov09 Dec09 Jan10 Feb10 Mar10 Apr10 May10 Jun10 Jul10 Aug10 Sep10 Oct10 Nov10 Dec10 Jan11 Feb11 Mar11 Apr11 May11 Jun11 Jul11 Aug11 Sep11 Oct11 Nov11 Dec11 Jan12 Feb12 (E) ADTK RFTK F/F YoY (Month) QoQ (Quarter) YoY (Quarter) YoY (Year) Feb'12 (E) Feb'11 YoY% Q4'11 Q3'11 QoQ% Q4'11 Q4'10 YoY% YoY% MADTK ,210 1, ,210 1, ,917 4, MRFTK ,765 2, Freight factor% Investor Relations Department
71 Operating Statistics Passenger Yield (Including Fuel Surcharge) (THB/Km) Passenger Yield (Excluding Fuel Surcharge) (THB/Km) Jan Feb Mar Apr May Jun Jul Aug Sep Oct Nov Dec Year 2009 Year 2010 Year Jan Feb Mar Apr May Jun Jul Aug Sep Oct Nov Dec Year 2009 Year 2010 Year Investor Relations Department
72 Operating Statistics Freight Yield (Including Fuel Surcharge) (THB/Km) Freight Yield (Excluding Fuel Surcharge) (THB/Km) Jan Feb Mar Apr May Jun Jul Aug Sep Oct Nov Dec Year 2009 Year 2010 Year Jan Feb Mar Apr May Jun Jul Aug Sep Oct Nov Dec Year 2009 Year 2010 Year Investor Relations Department
73 Awards and Accolades Achieved Top 5 in the World and Targeting Top 3 in Asia The World s Top Ten Airlines Skytrax Skytrax 2011 Best Airline Seat Economy Class Best On Board Catering Economy Class Business Traveler s Award nd for Best Airline 2nd for Best AsiaPacific Airline 3rd for Best Business Class 3rd for Best Economy Class 2nd for Best FrequentFlyer Programme 3rd for Best Airline Lounge in AsiaPacific Norwegian Grand Travel Award 2011 Best Intercontinental Airline TTG Award 2011 Best Business Class Best Southeast Asian carrier Skytrax 2010 Best Airline Lounge First Class Best Airport Services Source: Skytrax Go Asia Award 73 Investor Relations Department Best Asian carrier
74 Industry Outlook Thailand Passengers (Millions) Passenger from / to Thailand Forecast IATA International Passenger Forecast CAGR (As September 2010) World 7.9% 4.9% 5.4% 5.4% 5.4% 5.3% Asia Pacific 11.6% 7.2% 6.9% 6.5% 6.1% 6.7% Actual Estimate TG Forecast 4.3% 62.8M % 50.9M 4.3% 49.8M M 16.1M 7.5M 4.7M Inter. 5.6% Reg. 6.2% Dom. 7.5% Intercont. 3.5% 27.3M 21.7M 10.8M 5.5M 4.2% 3.7% 4.3% 6.1% 33.5M 26.0M 13.3 M 7.5M 36.8M 29.0M 13.9 M 7.7M 5.4% 3.9 % 5.3% 40.3M 17.8M 10.5M 3.3 % 4.3% 21.0M 13.0M 0 99/00 00/01 01/02 02/03 03/04 04/05 05/06 06/ F F F F F F F F F F F F Investor Relations 2021 Department 2022
THAI AIRWAYS INTERNATIONAL PCL
 THAI AIRWAYS INTERNATIONAL PCL PHATRA SECURITIES PCL Thai Tourism Day July 4, 2013 1 http://www.thaiairways.com/about-thai/investor-relations/en/investor.html DISCLAIMER The information contained herein
Analyst Briefing Quarter 3/2012
 http://www.thaiairways.com/about-thai/investor-relations/en/investor.html THAI AIRWAYS INTERNATIONAL PCL Analyst Briefing Quarter 3/2012 1 Investor Relations Department DISCLAIMER The information contained
THAI AIRWAYS INTERNATIONAL PCL
 THAI AIRWAYS INTERNATIONAL PCL Quarter 2/2013 Analyst Briefing 1 http://www.thaiairways.com/about-thai/investor-relations/en/investor.html DISCLAIMER The information contained herein is intended to represent
THAI AIRWAYS INTERNATIONAL PCL. COMPANY VISIT 1Q/2012
 THAI AIRWAYS INTERNATIONAL PCL. COMPANY VISIT 1Q/01 http://www.thaiairways.com/aboutthai/investorrelations/en/investor.html 1 DISCLAIMER The information contained herein is intended to represent the Company
THAI AIRWAYS INTERNATIONAL PCL
 http://www.thaiairways.com/about-thai/investor-relations/en/investor.html THAI AIRWAYS INTERNATIONAL PCL March 2012 1 Investor Relations Department DISCLAIMER The information contained herein is intended
THAI AIRWAYS INTERNATIONAL PCL
 http://www.thaiairways.com/about-thai/investor-relations/en/investor.html THAI AIRWAYS INTERNATIONAL PCL Quarter 2/2012 1 Investor Relations Department DISCLAIMER The information contained herein is intended
THAI AIRWAYS INTERNATIONAL PCL
 THAI AIRWAYS INTERNATIONAL PCL 2Q2017 analysts briefing 16-Aug-2017 1 DISCLAIMER The information contained herein is intended to represent the Company s operating and financial position at a given point
THAI AIRWAYS INTERNATIONAL Pcl. Fiscal Year 2007
 THAI AIRWAYS INTERNATIONAL Pcl. Fiscal Year 2007 (Oct 06-Sep 07) Relations Department Investor Relations Investor Relations Table of Contents 1. The Company 2. Statistic Information 3. Current Issue 4.
THAI AIRWAYS INTERNATIONAL PCL
 http://www.thaiairways.com/aboutthai/investorrelations/en/investor.html THAI AIRWAYS INTERNATIONAL PCL Maybank Kim Eng Securities (Thailand) PCL The New Myanmar and Investment Opportunities in Thailand
THAI AIRWAYS INTERNATIONAL PCL
 http://www.thaiairways.com/aboutthai/investorrelations/en/investor.html THAI AIRWAYS INTERNATIONAL PCL THAI CORPORATE DAY 13 December 2011 1 Investor Relations Department DISCLAIMER The information contained
THAI AIRWAYS INTERNATIONAL PCL
 THAI AIRWAYS INTERNATIONAL PCL 1-March-2016 1 DISCLAIMER The information contained herein is intended to represent the Company s operating and financial position at a given point in time and may also contain
Investor Relations Department
 THAI AIRWAYS INTERNATIONAL Plc. (Year 2008) 1 Table of Contents 1. The Company 2. Statistical Information 3. Tentative Aircraft Delivery 4. Financial Performance 5. Going Forward 2 1. The Company 3 The
1Q13 R sults esentation
 1Q13 Results Presentation 14 May 2013 Disclaimer The presentation is dated the day it is given. The delivery of this presentation shall not, under any circumstances, create any implication that there has
Airports of Thailand Public Company Limited
 Airports of Thailand Public Company Limited (AOT) 2 nd nd Quarter 2006 (January - March 2006) Agenda AOT Business Highlights Air Traffic Statistics Airport Capacity Suvarnabhumi Airport Recent Development
JAPAN AIRLINES Co., Ltd. Financial Results 1 st Quarter Mar/2017(FY2016) July 29, 2016
 July 29, 2016") JAPAN AIRLINES Co., Ltd. Financial Results Mar/2017(FY2016) July 29, 2016 Today s Topics P.1 P.2 P.13 From the first quarter of this fiscal year, figures for Revenue Passengers Carried, ASK, RPK and Load
JAPAN AIRLINES Co., Ltd. Financial Results Mar/2017(FY2016) July 29, 2016 Today s Topics P.1 P.2 P.13 From the first quarter of this fiscal year, figures for Revenue Passengers Carried, ASK, RPK and Load
THAI AIRWAYS INTERNATIONAL PLC.
 http://www.thaiairways.com/aboutthai/investorrelations/en/investor.html THAI AIRWAYS INTERNATIONAL PLC. 2Q/2011 1 Investor Relations Department DISCLAIMER The information contained herein is intended to
THAI AIRWAYS INTERNATIONAL PLC.
 http://www.thaiairways.com/aboutthai/investorrelations/en/investor.html THAI AIRWAYS INTERNATIONAL PLC. Q1/011 (Updated July 011) 1 Investor Relations Department DISCLAIMER The information contained herein
Air China Limited 2014 Annual Results Under IFRS
 Air China Limited 2014 Annual Results Under IFRS March 2015 Agenda Part 1 Results Highlights Part 2 Business Overview Part 3 Financial Overview Part 4 Outlook Part 1 Results Highlights Gradual Global Economic
Analysts and Investors conference call. Q results. 15 May 2013
 Analysts and Investors conference call Q1 2013 results 15 May 2013 Management summary Key messages of Q1 2013 +6% +9% +3.3%p. Q1 2013 operational KPIs are in line with 109.7 116.2 6.5 7.1 82.3 85.6 expectations,
Air China Limited Interim Results. August Under IFRS
 Air China Limited 21 Interim Results Under IFRS August 21 1 Agenda 21 Interim Results Overview Business Overview Financial Overview Outlook 2 2 2 21 Interim Results 3 21 Interim Results Overview 4 4 4
Table of Contents 1. The Company 2. Financial Performance 3 C. urrent Current Current Issues 4. Appendix
 THAI AIRWAYS INTERNATIONAL PLC. For Boston, New York, London Jun 25-30, 2009 0 Table of Contents 1. The Company 2 2. Financial Performance 3. Current Issues 11 23 4. Appendix 33 1 1. The Company 2 The
JAPAN AIRLINES Co., Ltd. Financial Results 1 st Quarter Mar/2018(FY2017)
") JAPAN AIRLINES Co., Ltd. Financial Results Mar/2018(FY2017) July 31, 2017 Today s Topics P.1 P.2 P.3 P.4 P.6 P.15 Overview of Financial Results for (FY2017) 1 st quarter resulted in an increase in both
JAPAN AIRLINES Co., Ltd. Financial Results Mar/2018(FY2017) July 31, 2017 Today s Topics P.1 P.2 P.3 P.4 P.6 P.15 Overview of Financial Results for (FY2017) 1 st quarter resulted in an increase in both
Air China Limited Annual Results. March Under IFRS
 Air China Limited 21 Annual Results Under IFRS March 211 Agenda Part 1 Highlights Part 2 Business Overview Part 3 Financial Overview Part 4 Outlook 2 Part 1 Highlights Steady Economic Growth; Asia Pacific
Analyst Meeting 1Q/2015
 Analyst Meeting 1Q/2015 DISCLAIMER The presentation is dated the day it is given. The delivery of this presentation shall not, under any circumstances, create any implication that there has been no change
Cathay Pacific Airways 2012 Analyst Briefing 28 June 2012
 Cathay Pacific Airways 2012 Analyst Briefing 28 June 2012 1 Airline Strategy Grow our international network, expand frequencies and further develop Hong Kong as one of the world s leading aviation hubs
Cathay Pacific Airways 2011 Analyst Briefing 23 June 2011
 Cathay Pacific Airways 2011 Analyst Briefing 23 June 2011 1 Airline Strategy Grow our international network, expand frequencies and further develop Hong Kong as one of the world s leading aviation hubs
Singapore Airlines Group Analyst/Media Briefing HALF YEAR FY RESULTS 5 NOVEMBER 2012 THE PARENT AIRLINE 1H FY2012/13 RESULTS
 Singapore Airlines Group Analyst/Media Briefing HALF YEAR FY2012-13 13 RESULTS 5 NOVEMBER 2012 THE PARENT AIRLINE 1H FY2012/13 RESULTS THE PARENT AIRLINE COMPANY RESULTS 2Q & 1H FY12/13 2Q/12 $million
2007/08 Full Year Results Investor Briefing
 2007/08 Full Year Results Investor Briefing Highlights of Result Profit before tax up 46% to $1,408 million Up 36% on the reported result Margin improvement $3 billion of Sustainable Future Benefits achieved
Cathay Pacific Airways 2013 Analyst Briefing 25 June Cathay Pacific Airways Analyst Briefing 27 November 2013
 Cathay Pacific Airways 2013 Analyst Briefing 25 June 2013 Cathay Pacific Airways Analyst Briefing 27 November 2013 2013 Operating Performance to date: Passenger yield and load factor growth on lower ASKs.
JAPAN AIRLINES Co., Ltd. Financial Results 1 st Quarter Mar/2017(FY2016) July 29, 2016
 July 29, 2016") JAPAN AIRLINES Co., Ltd. Financial Results Mar/2017(FY2016) July 29, 2016 Today s Topics P.1 P.2 P.13 From the first quarter of this fiscal year, figures for Revenue Passengers Carried, ASK, RPK and Load
JAPAN AIRLINES Co., Ltd. Financial Results Mar/2017(FY2016) July 29, 2016 Today s Topics P.1 P.2 P.13 From the first quarter of this fiscal year, figures for Revenue Passengers Carried, ASK, RPK and Load
Thank you for participating in the financial results for fiscal 2014.
 Thank you for participating in the financial results for fiscal 2014. ANA HOLDINGS strongly believes that safety is the most important principle of our air transportation business. The expansion of slots
Leaving the Competition Behind. Second Quarter (Apr-Jun) 2009 Results
 2009 Results") Leaving the Competition Behind Second Quarter (Apr-Jun) 2009 Results 12 Aug 2009 1 Disclaimer Information contained in our presentation is intended solely for your reference. Such information is subject
Leaving the Competition Behind Second Quarter (Apr-Jun) 2009 Results 12 Aug 2009 1 Disclaimer Information contained in our presentation is intended solely for your reference. Such information is subject
INVESTOR PRESENTATION. Imperial Capital Global Opportunities Conference September 2015
 INVESTOR PRESENTATION Imperial Capital Global Opportunities Conference September 2015 Forward-looking Statements This presentation contains forward-looking statements within the meaning of the Private
Ref. PE004/ May Subject: Management Discussion and Analysis for the First Quarter of 2018
 Ref. PE004/2561 10 May 2018 Subject: Management Discussion and Analysis for the First Quarter of 2018 Attention: President The Stock Exchange of Thailand According to the financial reports of Nok Airlines
ANALYST MEETING 3Q2015
 ANALYST MEETING 3Q2015 November 12, 2015 DISCLAIMER The presentation is dated the day it is given. The delivery of this presentation shall not, under any circumstances, create any implication that there
Cathay Pacific Airways Interim Results for the six months ended 30 June 2012
 Cathay Pacific Airways Interim Results for the six months ended 30 June 2012 8 August 2012 1 Interim Result 1H2012 1H2011 Change Group attributable (loss) / profit HK$ million (935) 2,808-133.3% Group
SIA ANALYST/MEDIA BRIEFING Q2 and 1H FY17/18 Results 8 November 2017
 SIA ANALYST/MEDIA BRIEFING Q2 and 1H FY17/18 Results 8 November 2017 THE PARENT AIRLINE Q2 AND 1H FY17/18 RESULTS THE PARENT AIRLINE COMPANY OPERATING PERFORMANCE Q2 % 1H % FY17/18 Change FY17/18 Change
Singapore Airlines Group Analyst/Media Briefing HALF YEAR FY RESULTS. 13 November 2013 THE PARENT AIRLINE 1H FY2013/14 RESULTS
 Singapore Airlines Group Analyst/Media Briefing HALF YEAR FY2013-14 14 RESULTS 13 November 2013 THE PARENT AIRLINE 1H FY2013/14 RESULTS THE PARENT AIRLINE COMPANY RESULTS 2Q & 1H FY13/14 2Q/13 $million
Part 1 Performance Highlights. Part 2 Business Overview. Part 3 Financial Review
 August 216 1 Part 1 Performance Highlights Part 2 Business Overview Part 3 Financial Review Part 4 Outlook 2 Under IFRS 3 Part 1 Performance Highlights Performance Highlights - Key Operational Metrics
AIR NEW ZEALAND ANNUAL RESULTS ANNUAL RESULTS
 AIR NEW ZEALAND ANNUAL RESULTS 2008 1 HIGHLIGHTS Record operating revenue, up 9% Normalised earnings* $197m Net cash position of $1.3bn Launched direct service to Vancouver and Beijing Award winning product
Management Discussions and Analysis for the three-month period ended 31 March 2014 and Executive Summary
 Executive Summary Overview of the global economy during the first quarter of 2015 (Q1/2015) are as following; the US economy has been in recovery mode while rapidly dollar appreciation weighs on net exports
2012 Result. Mika Vehviläinen CEO
 2012 Result Mika Vehviläinen CEO 1 Agenda Market environment in Q4 Business performance and strategy execution Outlook Financials 2 Market Environment According to IATA, Global air travel continues to
JAPAN AIRLINES Co., Ltd. Financial Results 1 st Quarter Mar/2018(FY2017)
") JAPAN AIRLINES Co., Ltd. Financial Results Mar/2018(FY2017) July 31, 2017 Today s Topics P.1 P.2 P.3 P.4~ P.6~ P.15~ Overview of Financial Results for Mar/18 Mar/18 (FY2017) 1 st quarter resulted in an
JAPAN AIRLINES Co., Ltd. Financial Results Mar/2018(FY2017) July 31, 2017 Today s Topics P.1 P.2 P.3 P.4~ P.6~ P.15~ Overview of Financial Results for Mar/18 Mar/18 (FY2017) 1 st quarter resulted in an
Financial Results 1 st Quarter Mar/2016 (FY2015) 30 July, 2015
 30 July, 2015") Financial Results Mar/2016 (FY2015) 30 July, 2015 Today s Topics P.2 P.3 P.15 1 Overview of FY Mar/2016 Financial Results Operating Revenue Operating Profit 320 307.0 +4.9Bn (+1.6%) 312.0 50 +17.6Bn (+94.6%)
Financial Results Mar/2016 (FY2015) 30 July, 2015 Today s Topics P.2 P.3 P.15 1 Overview of FY Mar/2016 Financial Results Operating Revenue Operating Profit 320 307.0 +4.9Bn (+1.6%) 312.0 50 +17.6Bn (+94.6%)
INVESTOR PRESENTATION. May 2015
 INVESTOR PRESENTATION May 2015 Forward-looking Statements This presentation contains forward-looking statements within the meaning of the Private Securities Litigation Reform Act of 1995 that reflect the
2003/04 Full Year Results Presentation to Investors
 2003/04 Full Year Results Presentation to Investors 19 August 2004 Geoff Dixon Chief Executive Officer Highlights 12 months to June 2004 12 months to June 2003 Increase/ (decrease) % Sales and operating
JAPAN AIRLINES Financial Results 2 nd Quarter Mar / 2014 (FY2013)
") JAPAN AIRLINES Financial Results 2 nd Quarter Mar / 2014 (FY2013) Yoshiharu Ueki, President Norikazu Saito, Managing Executive Officer 31 October, 2013 Contents P.2 P.3 P.4 P.6 1 Overview of 2 nd Quarter
JAPAN AIRLINES Financial Results 2 nd Quarter Mar / 2014 (FY2013) Yoshiharu Ueki, President Norikazu Saito, Managing Executive Officer 31 October, 2013 Contents P.2 P.3 P.4 P.6 1 Overview of 2 nd Quarter
Financial Results 3 rd Quarter MAR/2016 (FY2015)
") Financial Results MAR/2016 (FY2015) January 29 th, 2016 CONTENTS P.1 P.2 P.3 P.4~ Overview of FY MAR/16 Results Operating Revenue Operating Profit 1,030 1,020 1,010 +1.0Bn 1,022.3 1,023.4 (+0.1%) 180 160
Financial Results MAR/2016 (FY2015) January 29 th, 2016 CONTENTS P.1 P.2 P.3 P.4~ Overview of FY MAR/16 Results Operating Revenue Operating Profit 1,030 1,020 1,010 +1.0Bn 1,022.3 1,023.4 (+0.1%) 180 160
Cebu Air, Inc. 4 th Quarter and Full Year 2017 Results of Operations. cebupacificair.com
 Cebu Air, Inc. 4 th Quarter and Full Year 2017 Results of Operations cebupacificair.com Disclaimer The information provided in this presentation is provided only for your reference. Such information has
SAS Q1 2017/2018. Q1 in Summary: Improved earnings CHANGE VS. Q1 FY17
 SAS 2017/2018 27.02.2018 in Summary: Improved earnings POSITIVES + Passenger revenue up 1% (FX adj.) + Cargo and EB-point sale revenue increased MSEK 109 + Efficiency program delivered MSEK 165 + Positive
Cebu Air, Inc. 2Q2014 Results of Operation
 Cebu Air, Inc. 2Q2014 Results of Operation 1 Disclaimer This information provided in this presentation is provided only for your reference. Such information has not been independently verified and, as
JET AIRWAYS (I) LTD. Presentation on Financial Results Q July 24, 2009
 LTD. Presentation on Financial Results Q July 24, 2009") JET AIRWAYS (I) LTD Presentation on Financial Results Q1 2010 July 24, 2009 1 1 1 Agenda Domestic operating environment Jet Airways performance highlights JetLite performance highlights Outlook 2 2 2 Domestic
JET AIRWAYS (I) LTD Presentation on Financial Results Q1 2010 July 24, 2009 1 1 1 Agenda Domestic operating environment Jet Airways performance highlights JetLite performance highlights Outlook 2 2 2 Domestic
Cathay Pacific Airways Analyst & Investor Briefing June Cathay Pacific Airways Interim Results 6 August 2008
 Cathay Pacific Airways 2010 Analyst & Investor Briefing June 2010 Cathay Pacific Airways 2008 Interim Results 6 August 2008 Airline Strategy Remains largely unchanged Grow our international network, expand
Bank of America Merrill Lynch 2018 Emerging Markets Corporate Credit Conference. Miami, May 2018
 Bank of America Merrill Lynch 2018 Emerging Markets Corporate Credit Conference Miami, May 2018 This presentation may include forward-looking comments regarding the Company s business outlook and anticipated
SAS AB Q December 2018
 SAS AB Q4 2018 4 December 2018 Q4 financial highlights Q4 POSITIVES Q4-18 CHANGE VS. Q4-17 Record number of passengers Total revenue up SEK 1bn vs. LY Yield (nominal) up 5.1% vs. LY RASK (nominal) up 7.0%
Finnair Q Result
 17 August 2016 CEO Pekka Vauramo CFO Pekka Vähähyyppä Finnair Q2 2016 Result 1 Highlights of the second quarter The seventh consecutive quarter of profit improvement Fukuoka & Guangzhou route openings
Q1 2018/
 Q1 2018/2019 27.02.2019 Highlights Q1/19 CHANGE VS. Q1-18 Financial drivers Total revenue up 6% with broadly unchanged capacity Slight increase in passengers and load factor HIGHLIGHTS Q1/19 Improved unit
SAS Q2 2017/2018 TELECONFERENCE
 SAS Q2 2017/2018 TELECONFERENCE 30 May 2018 Earnings as expected despite negative currency effect POSITIVES + Total revenue up MSEK 73 vs. LY + Currency adjusted yield up 0.6% vs. LY + EB-point sale revenue
Q Fast growth continued, Comparable operating result at record high levels Pekka Vauramo
 2018 Fast growth continued, Comparable operating result at record high levels 17.7.2018 Pekka Vauramo 2 A good - Comparable operating result increased to new seasonal high Revenue Comparable operating
Cathay Pacific Airways
 Cathay Pacific Airways Interim Results for the six months ended 30 th June 2014 13th August 2014 1 Interim Results 1H2014 1H2013 Change Profit attributable to the shareholders of Cathay Pacific HK$ million
SET Opportunity Day #3/2011
 SET Opportunity Day #3/2011 2Q11 & 1H11 Performance & Outlook 18 August 2011 The views expressed here contain some information derived from publicly available sources that have not been independently verified.
SAS AB Analyst meeting
 SAS AB Analyst meeting London, August 9, 2001 2 2nd Quarter a tough Quarter The Marketplace Continued weak world economy Weaker Swedish economy SAS Weaker traffic growth and reduced passenger load factors
Finnair 2015 kolmannen vuosineljänneksen tulos
 Finnair 215 kolmannen vuosineljänneksen tulos Q3 Result 215 3 October 215 3.1.215 Toimitusjohtaja Pekka Vauramo Talousjohtaja Pekka Vähähyyppä 1 Highlights of the quarter Excellent Q3 result: Record result
Korean Air Q Financial Results. Jul 28, 2011
 Korean Air 2011 2Q Financial Results Jul 28, 2011 Disclaimer This presentation is for informational purposes only, contains preliminary financial and other information about Korean Air Lines Co., Ltd.
Air Berlin PLC AGM 06 June 2013 London
 Air Berlin PLC AGM 06 June 2013 London airberlin a strong European carrier Market position as of 31 December 2012 No. 2 in core market: Germany / Austria / Switzerland No. 7 in Europe with 33.3 m guests
JAPAN AIRLINES Co., Ltd. Financial Results 3 rd Quarter Mar/2018(FY2017) January 31, 2018
 January 31, 2018") JAPAN AIRLINES Co., Ltd. Financial Results 3 rd Quarter Mar/2018(FY2017) January 31, 2018 Today s Topics P.1 P.2 P.3 P.12 JAL Corporate Website the CONTRAIL Project Overview of Financial Results for 3
JAPAN AIRLINES Co., Ltd. Financial Results 3 rd Quarter Mar/2018(FY2017) January 31, 2018 Today s Topics P.1 P.2 P.3 P.12 JAL Corporate Website the CONTRAIL Project Overview of Financial Results for 3
Analysts Briefing. 18 March Cathay Pacific Airways Limited
 Analysts Briefing 18 March 2015 Cathay Pacific Airways Limited Annual Results 2014 2013 Change Group attributable profit HK$m 3,150 2,620 +20.2% Group turnover HK$m 105,991 100,484 +5.5% Profit margin
Quarterly Meeting# 2/2017
 Quarterly Meeting# 2/2017 1Q17 Performance & Outlook 16 May 2017 1 2017 ERAWAN. All rights reserved. The views expressed here contain some information derived from publicly available sources that have
RUNWAY SAFETY ISSUES and MITIGATION OPTIONS
 RUNWAY SAFETY ISSUES and MITIGATION OPTIONS By Wing Commander Nutt Homasavin Airports of Thailand Plc. 1 CONTENT AOT s Airports Safety Policy, Structure and Committee Runway Safety Program Background of
Analysts Briefing. 24 June Cathay Pacific Airways Limited
 Analysts Briefing 24 June 2016 Cathay Pacific Airways Limited Operating performance - overview Challenging business environment. Load factor lower than expectations on weakening passenger demand. Strong
SAS Q1 2016/
 SAS Q1 2016/2017 08.03.2017 Weak Q1 as expected new structural actions underway Q1 in summary Positives + Currency adjusted passenger revenue up 5% + Strong development of ancillary revenues + Passengers
Finnair Group Interim Report 1 January 30 June 2008
 Finnair Group Interim Report 1 January 30 June 2008 1 08/08/2008 Presentation name / Author Airline industry at a historical turning point Fuel price has a stranglehold on the business Average ticket prices
Analysts Briefing. 27 November Cathay Pacific Airways Limited
 Analysts Briefing 27 November 2015 Cathay Pacific Airways Limited Operating performance - overview Passenger load factors are high, driven by strong back-end demand. Passenger front-end yield and load
Information meeting. 1 st September 2011
 Information meeting 1 st September 2011 Full Year 2010-11 key data April 2010-March 2011 Revenues in billions Operating result in millions 77% Passenger 18.10 +11.3% -44 +874 13% Cargo 3.16 +29.5% +69
Results 2Q17. August 9, 2017
 Results 2Q17 August 9, 2017 2Q17 Highlights Indicators 2Q17 Var. x 2Q16 ASK (BN) 10.4-3.0% Traffic (000) 7,261-1.3% RPK (BN) 8.1 +0.5% Load Factor 77.9% +2.7 p.p. Yield (R$ cents) 23.2 +4.8% Pax Revenue
SAS Group Q2 2012/13. Q2 Restructuring programme moving KPIs in the right direction
 SAS Group Q2 2012/13 1 Q2 Restructuring programme moving KPIs in the right direction Operating revenues +1.6%* Yield improvement of +2.7%* Forceful implementation of 4XNG plan: Unit cost down by 10.7%
Management s Discussion and Analysis for the year ended December 31, 2016 for Thai Airways International Public Company Limited and Its Subsidiaries
 Management s Discussion and Analysis for the year ended December 31, 2016 for Thai Airways International Public Company Limited and Its Subsidiaries 1. Executive summary The world economy in 2016 was insubstantially
26 October 2017 Icelandair Group Interim Report NET PROFIT USD 101 MILLION IN THIRD QUARTER
 NET PROFIT USD 101 MILLION IN THIRD QUARTER Total income in Q3 up by 10% between years, to USD 536.0 million Passenger revenue higher than expected EBITDA unchanged year on year, at USD 161.1 million Passenger
SAS Q3 2017/ August 2018
 SAS Q3 2017/2018 31 August 2018 Strong earnings in peak season POSITIVES Record number of passengers Total revenue up MSEK 936 vs. LY Currency adjusted yield up 1.1% vs. LY EB point sale up 27% vs. LY
Cathay Pacific Airways Analyst Briefing. 21 November 2014
 Cathay Pacific Airways Analyst Briefing 21 November 2014 Operating Performance Passenger demand remains strong, although growth in North America is significantly short of increase in capacity. Demand for
Credit Suisse. 19 th Annual AIC 8 th April Cathay Pacific Airways Limited
 Credit Suisse 19 th Annual AIC 8 th April 2016 Cathay Pacific Airways Limited Annual Results - 2015 Group Financial Statistics 2015 2014 % Var Group Revenue HK$m 102,342 105,991-3.4% Group attributable
Analyst Briefing. 12 June Cathay Pacific Airways Limited
 Analyst Briefing 12 June 2015 Cathay Pacific Airways Limited Operating Performance The positive operating environment continues into the first half of 2015. Robust passenger demand and healthy cargo demand.
SAS Group Asia Tour Financial Hearing Presentation May 14, 2012
 SAS Group Asia Tour Financial Hearing Presentation May 14, 2012 1 This is the SAS Group 128 destinations 27,2 million passengers 28 new routes to be launched 2012 1,085 daily flights Revenues 2011, MSEK
QANTAS HALF YEAR 2015 FINANCIAL RESULTS 1
 QANTAS HALF YEAR 2015 FINANCIAL RESULTS 1 Key points: Underlying Profit Before Tax: $367 million Statutory Profit After Tax: $206 million Transformation benefits: $374 million Comparable unit cost reduction:
Q Finnair s growth continued Pekka Vähähyyppä
 2018 Finnair s growth continued 25.10.2018 Pekka Vähähyyppä 1 We continued to develop our services and network New route to Los Angeles in 2019, two daily flights to Hong Kong New digital service for exploring
Passenger: 17.2 Million (+3.9% yoy) OTP: 85.8% SLF: 73.3% Subsidiaries Operating Revenues US$415.2 Million Cargo Carried 219.4K ton (+10.
 OTP: 85.8% SLF: 73.3% Subsidiaries Operating Revenues US$415.2 Million Cargo Carried 219.4K ton (+10.") Value* 14.78 3.36 4.97 Volume** 32.85 9.59 13.43 Last Price 423 342 348 Market Cap.*** 8.74 8.85 9.01 Note: * Average Value in Billion Rupiah ** Average Volume in Million *** Market Capitalization in Trillion
Value* 14.78 3.36 4.97 Volume** 32.85 9.59 13.43 Last Price 423 342 348 Market Cap.*** 8.74 8.85 9.01 Note: * Average Value in Billion Rupiah ** Average Volume in Million *** Market Capitalization in Trillion
Finnair Q Result
 Finnair Q1 2015 Result 7 May 2015 CEO Pekka Vauramo, Interim CFO Mika Stirkkinen 1 Turbulent market environment The weakness of the Finnish economy continued to be reflected in the demand in the first
Airports of Thailand Plc.
 Airports of Thailand Plc. For The Fiscal Year 2017 (October 2016 September 2017) Investor Relations Department, E-mail: aotir@airportthai.co.th, Tel: (662) 535-5900, Fax (662) 535-5909 Disclaimer This
UBS 14 th Global Emerging Markets Conference. New York, November 2016
 UBS 14 th Global Emerging Markets Conference New York, November 2016 This presentation may include forward-looking comments regarding the Company s business outlook and anticipated financial and operating
Finnair Group Annual Report 1 January 31 December 2006
 Finnair Group Annual Report 1 January 31 December 2006 2006: A year for restructuring Scheduled Passenger Traffic transforming to meet Asian traffic demands Labour negotiations to cut 670 jobs 80 million
Fourth Quarter and Full Year 2009
 Investor and analyst meeting: Fourth Quarter and Full Year 29 25 th February 21 2 The views expressed here contain some information derived from publicly available sources that have not been independently
Presentation on Results for the 2nd Quarter FY Idemitsu Kosan Co.,Ltd. November 14, 2018
 Presentation on Results for the 2nd Quarter FY 2018 Idemitsu Kosan Co.,Ltd. November 14, 2018 Table of Contents 1. FY 2018 2nd Quarter Financials (1) Overview (2) Segment Information 2. Reference Materials
Tiger Airways Holdings Limited FY11 Results
 Tiger Airways Holdings Limited FY11 Results May 2011 Financial Year Ended 31 March 2011 Disclaimer The information contained in this presentation (the "Information") is provided by Tiger Airways Holdings
Quarterly Meeting# 4/2018
 Quarterly Meeting# 4/2018 3Q18 & 9M18 Performance & Outlook 14 November 2018 1 2016 ERAWAN. All rights reserved. The views expressed here contain some information derived from publicly available sources
Finnair Group Interim Report 1 January 30 September 2008
 Finnair Group Interim Report 1 January 30 September 2008 1 31/10/2008 Presentation name / Author Airline industry at a historical turning point Expensive fuel price in the beginning of 2008 has dramatical
FIRST QUARTER 2017 RESULTS. 4 May 2017
 FIRST QUARTER 2017 RESULTS 4 May 2017 A resilient start of the year, traffic up 4.2% 20.9 million passengers carried, up 5.2%, traffic (RPK) up 4.2%, capacity (ASK) up 3.3% and load factor up 0.7pts Confirmation
Santander 22 nd Annual Latin American Conference. Cancun, January 2018
 Santander 22 nd Annual Latin American Conference Cancun, January 2018 This presentation may include forward-looking comments regarding the Company s business outlook and anticipated financial and operating
Presentation on Results for the 2nd Quarter FY Idemitsu Kosan Co.,Ltd. November 1, 2016
 Presentation on Results for the 2nd Quarter FY 2016 Idemitsu Kosan Co.,Ltd. November 1, 2016 Table of Contents 1. 2nd Quarter FY 2016 Financials (1) Overview (2) Segment Information 2. Reference Materials
NORWEGIAN AIR SHUTTLE ASA QUARTERLY REPORT SECOND QUARTER 2006 [This document is a translation from the original Norwegian version]
![NORWEGIAN AIR SHUTTLE ASA QUARTERLY REPORT SECOND QUARTER 2006 [This document is a translation from the original Norwegian version]](/thumbs/74/71229964.jpg "NORWEGIAN AIR SHUTTLE ASA QUARTERLY REPORT SECOND QUARTER 2006 [This document is a translation from the original Norwegian version]") NORWEGIAN AIR SHUTTLE ASA QUARTERLY REPORT SECOND QUARTER 2006 SECOND QUARTER IN BRIEF had earnings before tax of MNOK 24.8 (20.6) in the second quarter. The operating revenue increased by 44 % this quarter,
NORWEGIAN AIR SHUTTLE ASA QUARTERLY REPORT SECOND QUARTER 2006 SECOND QUARTER IN BRIEF had earnings before tax of MNOK 24.8 (20.6) in the second quarter. The operating revenue increased by 44 % this quarter,
Third Quarter 2014 Results. 29 October 2014
 Third Quarter 2014 Results 29 October 2014 Highlights of the Third Quarter Operating environment Air France-KLM Economic environment remains weak Further currency volatility affecting revenues and results