Statistical Yearbook. of Abu Dhabi 2018
|
|
|
- Owen Black
- 5 years ago
- Views:
Transcription
1 2018 Statistical Yearbook of Abu Dhabi 2018
2 Statistical Yearbook of Abu Dhabi 2018 Copyrights Reserved for Statistics Centre - Abu Dhabi


3 His Highness Sheikh Khalifa bin Zayed Al Nahyan President of the United Arab Emirates

4 His Highness Sheikh Mohammad bin Zayed Al Nahyan Crown Prince of Abu Dhabi and Deputy Supreme Commander of the UAE Armed Forces
5
6 Foreword The Statistics Centre - Abu Dhabi (SCAD) is pleased to present the Abu Dhabi Statistical Yearbook 2018, this annual publication, closely monitors a whole spectrum of indicators that gauge the comprehensive development taking place across the Emirate under the wise leadership of HH Sheikh Khalifa bin Zayed Al Nahyan, President of the United Arab Emirates and Ruler of Abu Dhabi, and the sustained support and guidance of his HH General Sheikh Mohammed bin Zayed Al Nahyan, Crown Prince of Abu Dhabi, Deputy Supreme Commander of the Armed Forces and Chairman of the Executive Council of the Emirate of Abu Dhabi. The publication of Abu Dhabi Statistical Yearbook 2018 translates SCAD s belief in the importance of timely access to statistical data and information in decision support and policy making at all public and private levels. SYB 2018 covers a wide range of developments and highlights the major transformations experienced by the emirate in all spheres, including the economy, the population, the society and the environment. collecting data, conducting surveys and compiling various indicators for this statistical abstract, the credit for the widespread interest in this release among broad segments of society goes also to the collaboration of our strategic partners, namely, local government entities, Federal ministries, and private enterprises, which supplied the centre with a considerable proportion of the datasets required for this publication, realizing the importance of working in true team spirit for the progress of the nation. In line with the Paperless Centre initiative and the transformation towards fully electronic operations, hard copies of the Statistical Year Book have been discontinued, with only the digital copy made available to meet users needs and support the emirate's decision-making and policy planning. Rashed Lahej Al Mansoori Chairman October 2018
7 Units and Abbreviations
8 na, - = Figure not available 0 (0.0) = Less than half of unit concerned blank = Not applicable C o = Degree Celsius GDP = Gross Domestic Product No. = Number mm = Millimetre kg = Kilogram km = Kilometre kwh = Kilowatt per hour mwh = Megawatt per hour BTU = British Thermal Unit '000 = in thousands AED = UAE Dirham FDI = Foreign Direct Investment GCC = Gulf Cooperation Council CPI = Consumer Price Index MCM = Million Cubic Metres LNG = Liquefied Natural Gas Sq. = Square hpa = Hectopascal mph = Miles per hour h = Hour mcg = Microgram Donum = One thousand square meters Figures in italics are not nal and subject to revision. Due to rounding, some totals may not equal the sum of components. Unless otherwise indicated, all the tables of this book pretail to the Emirate of Abu Dhabi. However, when mentioned in table titles or within table cells "Abu Dhabi" refers only to the Region of Abu Dhabi and not the whole Emirate.
9 Contents
10 1. Economy Economic Aggregates Merchandise Foreign Trade Prices Financial Statistics Government Finance Wages and Compensation Foreign Investment 2. Industry and Business Business Environment Manufacturing Oil and Gas Petrochemicals Electricity and Water Construction Transportation Information and Communication Technology Hotels 3. Population and Demography Population Vital Statistics 4. Social Education Health Social Welfare Culture and Heritage 5. Labour Force Labour Force Structure Employment Unemployment Outside Labour Force Population and Economic Dependency Ratio 6. Agriculture and Environment Agriculture Environment Energy and Water
11

12 1. Economy Economic Aggregates Merchandise Foreign Trade Prices Financial Statistics Government Finance Wages and Compensation Foreign Investment
13 1. Economy Creating strategies to ensure development and reform towards a diversi ed economy in the Emirate of Abu Dhabi are amongst the key objectives of the supreme leadership of the Emirate. The sustained focus on these and other supporting objectives, combined with the competitive edge the emirate enjoys, placed Abu Dhabi's economy in a strong position, regionally and internationally. The Gross Domestic Product (GDP) is one of the most important economic indicators. It comprises the total of all goods and services produced in an economy, minus the intermediate goods and services consumed as inputs in the production process. It is also de ned as the total value added to the economy by resident producers during the year. Non-oil GDP is another important indicator because it allows more in-depth analysis of developments in the economy by excluding the in uence from the oil activity and its price uctuations. Abu Dhabi's economy has strengthened continuously during recent times because of the focus towards the establishment of structures that is supportive of economic diversi cation and comprehensive development. As the most dynamic economy in the region, it has moved away from signi cant dependence on the public sector expenditures and reliance on unstable revenues from the oil sector towards an economy, which became more diverse across a wide range of core activities. The tables and graphs presented in this chapter of the statistical yearbook describe the performance of all economic activities in the Emirate. The data and indicators presented supports policies and decision makers and illustrate the growth and stability achieved by Abu Dhabi's economy during the previous years. The tables also represent data on national accounts, such as the Gross Domestic Product by economic activity at current and at constant prices, which removes the effect of prices and in ation. In addition, growth rates, contribution of economic activities to the GDP and per capita gross domestic product statistics are provided. The chapter also presents data on capital formation by economic activities, compensation of employees at current prices, Abu Dhabi Government nance and other diverse data of economic interest. Statistical Yearbook of Abu Dhabi
14 2017 GDP at Current Prices (Million AED) 832,470 GDP at 2007 Constant Prices (Million AED) 785,591 GDP at Current Prices Growth Rate (%) 9.5 Oil Share in GDP at Current Prices (%) 35.9 GDP Per Capita at Current Prices (Thousand AED) GDP Per Capita at 2007 Constant Prices (Thousand AED) Gross Fixed Capital Formation (Million AED) 182,341 Foreign Direct Investment (Million AED), ,887 Oil, Gas and Oil Products Exports of the Emirate of Abu Dhabi (Million AED) 174,893 Non-oil Exports of the Emirate of Abu Dhabi (Million AED) 22,347 Re-exports through the Ports of the Emirate of Abu Dhabi (Million AED) 21,771 Imports of the Emirate of Abu Dhabi (Million AED) 112,120 Inflation Rate (%) Economic Aggregates This section of the statistical book includes detailed statistics on macroeconomic variables, which accurately monitor the most important economic developments, thus contributing to provide a true picture of the economy of the Emirate of Abu Dhabi. It includes statistics of GDP by economic activity at current and constant prices, annual growth rates, the contribution of economic activities to GDP, in addition to the xed capital formation by economic activity, and other data related to the economy of the Emirate. Abu Dhabi's 2017 GDP estimates at current prices was AED 832,470 million compared with AED 760,396 million in As other data of 2017 indicate, the GDP per capita at current prices amounted to AED thousand, total xed capital formation was AED 182,341 million, while the compensation of employees was AED 233,573 million. GDP at constant prices depicts how much goods and services were produced in volume terms and is measured by holding prices constant. GDP at constant prices was AED 785,591 million in 2017 compared with AED 789,716 million in The GDP per capita at constant prices amounted to AED thousand in 2017 compared to AED thousand in Statistical Yearbook of Abu Dhabi 2018
15 1.1.1 Gross Domestic Product by Economic Activity at Current Prices (Million AED) Economic Activity * Total 639, , , , ,470 Agriculture, forestry and fishing 4,359 5,517 5,699 5,932 6,224 Mining and quarrying (includes crude oil and natural gas) 315, , , , ,814 Manufacturing 34,268 51,900 50,324 49,842 54,021 Electricity, gas, and water supply; waste management 16,088 23,765 29,831 30,524 34,182 Construction 78,051 83,812 88,782 85,306 82,288 Wholesale and retail trade; repair of motor vehicles and motorcycles 26,640 37,187 41,038 47,671 47,425 Transportation and storage 20,096 36,166 37,065 27,624 27,752 Accommodation and food services 7,249 9,013 9,244 9,828 10,161 Information and communication 18,611 20,643 21,293 22,261 23,066 Financial and insurance 26,878 61,331 68,555 73,244 75,010 Real estate 21,852 35,972 41,177 46,814 45,268 Professional, scientific and technical 17,415 18,545 19,016 19,467 20,006 Administrative and support services 7,491 10,173 10,811 12,047 13,136 Public administration and defence; compulsory social security 30,662 51,620 52,383 55,309 60,574 Education 6,443 11,463 11,719 13,214 13,419 Human health and social work 3,429 11,224 11,604 12,560 13,186 Arts, recreation and other services 3,314 2,294 2,381 2,563 2,688 Activities of households as employers 1,572 4,052 4,502 5,042 5,249 Source: Statistics Centre - Abu Dhabi * Preliminary estimates Statistical Yearbook of Abu Dhabi
16 1.1.2 Gross Domestic Product by Economic Activity at Constant Prices (2007) (Million AED) Economic Activity * Total 587, , , , ,591 Agriculture, forestry and fishing 4,293 5,009 5,084 5,240 5,369 Mining and quarrying (includes crude oil and natural gas) 302, , , , ,886 Manufacturing 30,683 40,481 42,791 44,140 46,379 Electricity, gas, and water supply; waste management 14,975 19,787 24,372 24,923 27,503 Construction 78,505 80,917 84,678 82,643 79,300 Wholesale and retail trade; repair of motor vehicles and motorcycles 22,253 26,750 28,664 32,844 32,160 Transportation and storage 15,834 22,103 21,329 16,463 16,071 Accommodation and food services 5,593 7,688 7,842 8,528 9,161 Information and communication 18,752 19,931 20,584 22,027 23,002 Financial and insurance 23,588 48,598 53,493 55,949 57,784 Real estate 17,478 27,913 29,867 32,059 31,795 Professional, scientific and technical 14,598 14,429 14,094 14,241 14,405 Administrative and support services 6,279 7,915 8,012 8,813 9,458 Public administration and defence; compulsory social security 19,248 29,748 30,175 31,283 33,721 Education 6,388 7,346 7,560 8,284 8,329 Human health and social work 2,238 7,100 7,298 7,445 7,550 Arts, recreation and other services 2,946 1,785 1,765 1,875 1,936 Activities of households as employers 1,318 3,153 3,336 3,689 3,779 Source: Statistics Centre - Abu Dhabi * Preliminary estimates 16 Statistical Yearbook of Abu Dhabi 2018
17 1.1.3 GDP Per Capita at Current Prices Item * GDP (Million AED) 639, , , , ,470 Oil GDP (Million AED) 315, , , , ,814 Non-oil GDP (Million AED) 324, , , , ,656 GDP per capita (Thousand AED) Oil GDP per capita (Thousand AED) Non-oil GDP per capita (Thousand AED) GDP per capita annual growth (%) Oil GDP per capita annual growth (%) Non-oil GDP per capita annual growth (%) Source: Statistics Centre - Abu Dhabi * Preliminary estimates GDP Per Capita at Constant Prices (2007) Item * GDP (Million AED) 587, , , , ,591 Oil GDP (Million AED) 302, , , , ,886 Non-oil GDP (Million AED) 284, , , , ,704 GDP per capita (Thousand AED) Oil GDP per capita (Thousand AED) Non-oil GDP per capita (Thousand AED) GDP per capita annual growth (%) Oil GDP per capita annual growth (%) Non-oil GDP per capita annual growth (%) Source: Statistics Centre - Abu Dhabi * Preliminary estimates Statistical Yearbook of Abu Dhabi
18 1.1.5 Annual Growth Rates of the GDP by Economic Activity at Current Prices (%) Economic Activity * Total Agriculture, forestry and fishing Mining and quarrying (includes crude oil and natural gas) Manufacturing Electricity, gas, and water supply; waste management Construction Wholesale and retail trade; repair of motor vehicles and motorcycles Transportation and storage Accommodation and food services Information and communication Financial and insurance Real estate Professional, scientific and technical Administrative and support services Public administration and defence; compulsory social security Education Human health and social work Arts, recreation and other services Activities of households as employers Source: Statistics Centre - Abu Dhabi * Preliminary estimates 18 Statistical Yearbook of Abu Dhabi 2018
19 1.1.6 Annual Growth Rates of the GDP by Economic Activity at Constant Prices (2007) (%) Economic Activity * Total Agriculture, forestry and fishing Mining and quarrying (includes crude oil and natural gas) Manufacturing Electricity, gas, and water supply; waste management Construction Wholesale and retail trade; repair of motor vehicles and motorcycles Transportation and storage Accommodation and food services Information and communication Financial and insurance Real estate Professional, scientific and technical Administrative and support services Public administration and defence; compulsory social security Education Human health and social work Arts, recreation and other services Activities of households as employers Source: Statistics Centre - Abu Dhabi * Preliminary estimates Statistical Yearbook of Abu Dhabi
20 1.1.7 Percentage Distribution of the GDP by Economic Activity at Current Prices (%) Economic Activity * Total Agriculture, forestry and fishing Mining and quarrying (includes crude oil and natural gas) Manufacturing Electricity, gas, and water supply; waste management Construction Wholesale and retail trade; repair of motor vehicles and motorcycles Transportation and storage Accommodation and food services Information and communication Financial and insurance Real estate Professional, scientific and technical Administrative and support services Public administration and defence; compulsory social security Education Human health and social work Arts, recreation and other services Activities of households as employers Source: Statistics Centre - Abu Dhabi * Preliminary estimates 20 Statistical Yearbook of Abu Dhabi 2018
21 1.1.8 Percentage Distribution of the GDP by Economic Activity at Constant Prices (2007) (%) Economic Activity * Total Agriculture, forestry and fishing Mining and quarrying (includes crude oil and natural gas) Manufacturing Electricity, gas, and water supply; waste management Construction Wholesale and retail trade; repair of motor vehicles and motorcycles Transportation and storage Accommodation and food services Information and communication Financial and insurance Real estate Professional, scientific and technical Administrative and support services Public administration and defence; compulsory social security Education Human health and social work Arts, recreation and other services Activities of households as employers Source: Statistics Centre - Abu Dhabi * Preliminary estimates Statistical Yearbook of Abu Dhabi
22 1.1.9 Gross Fixed Capital Formation by Economic Activity at Current Prices (Million AED) Economic Activity * Total 142, , , , ,341 Agriculture, forestry and fishing Mining and quarrying (includes crude oil and natural gas) ,716 29,176 44,082 60,343 55,354 Manufacturing 28,740 19,691 12,911 11,611 12,353 Electricity, gas, and water supply; waste management 12,634 7,912 10,185 5,059 5,832 Construction 4,541 4,438 4,526 3,811 3,763 Wholesale and retail trade; repair of motor vehicles and motorcycles 1,205 2,743 3,168 3,555 3,587 Transportation and storage 11,253 22,630 25,047 17,012 17,079 Accommodation and food services Information and communication 505 1,162 1,047 1,149 1,263 1,979 2,087 2,981 2,500 2,722 Financial and insurance 5,687 2,884 3,501 3,604 3,718 Real estate 9,446 34,345 37,420 38,169 39,025 Professional, scientific and technical Administrative and support services Public administration and defence; compulsory social security ,585 1,628 1,816 1,949 26,842 29,272 21,993 31,856 28,622 Education 3,181 2,873 3,634 2,687 2,958 Human health and social work Arts, recreation and other services 1,592 3,259 3,761 2,243 2, Source: Statistics Centre - Abu Dhabi * Preliminary estimates 22 Statistical Yearbook of Abu Dhabi 2018
23 Percentage Distribution of Gross Fixed Capital Formation by Economic Activity at Current Prices (%) Economic Activity * Total Agriculture, forestry and fishing Mining and quarrying (includes crude oil and natural gas) Manufacturing Electricity, gas, and water supply; waste management Construction Wholesale and retail trade; repair of motor vehicles and motorcycles Transportation and storage Accommodation and food services Information and communication Financial and insurance Real estate Professional, scientific and technical Administrative and support services Public administration and defence; compulsory social security Education Human health and social work Arts, recreation and other services Source: Statistics Centre - Abu Dhabi * Preliminary estimates Statistical Yearbook of Abu Dhabi
24 Gross Fixed Capital Formation by Economic Activity as a Percentage of the GDP at Current Prices (%) Economic Activity * Total Agriculture, forestry and fishing Mining and quarrying (includes crude oil and natural gas) Manufacturing Electricity, gas, and water supply; waste management Construction Wholesale and retail trade; repair of motor vehicles and motorcycles Transportation and storage Accommodation and food services Information and communication Financial and insurance Real estate Professional, scientific and technical Administrative and support services Public administration and defence; compulsory social security Education Human health and social work Arts, recreation and other services Source: Statistics Centre - Abu Dhabi * Preliminary estimates 24 Statistical Yearbook of Abu Dhabi 2018
25 Annual Growth Rates of Gross Fixed Capital Formation by Economic Activity at Current Prices (%) Economic Activity * Total Agriculture, forestry and fishing Mining and quarrying (includes crude oil and natural gas) Manufacturing Electricity, gas, and water supply; waste management Construction Wholesale and retail trade; repair of motor vehicles and motorcycles Transportation and storage Accommodation and food services Information and communication Financial and insurance Real estate Professional, scientific and technical Administrative and support services Public administration and defence; compulsory social security Education Human health and social work Arts, recreation and other services Source: Statistics Centre - Abu Dhabi * Preliminary estimates Statistical Yearbook of Abu Dhabi
26 1.2. Merchandise Foreign Trade Foreign trade in goods is of paramount importance to the economy of the Emirate of Abu Dhabi and contribute to a considerable proportion of the Emirate's GDP. In 2017, net trade in goods accounted for 12.8% of the GDP, re ecting the contribution of foreign trade to the economy in general. The non-oil merchandise trade statistics presented in this section comprises trade in goods which entered or exited the territory of the Emirate of Abu Dhabi through the ports of Abu Dhabi (comprising air, sea and road ports). It should be noted that foreign trade data presented in this report do not cover non-oil exports, re-exports and imports through ports of the other Emirates in the UAE. Commodity imports in goods through the ports of the Emirate Abu Dhabi were valued at AED billion in 2017 compared with AED billion in The main imports during 2017 were 'Machinery, sound recorder, reproducers and parts', which accounted for 24.9% of the total value. The United States of America was the main country for imports, from which the Emirate received goods worth AED 16.9 billion. Non-oil exports were valued at AED 22.3 billion, with 'Plastic, rubber and articles thereof' contributing 42.7% of the total. China was the top destination of Abu Dhabi non-oil exports, receiving goods worth AED 4.1 billion from the Emirate in Re-exports in 2017 were valued at AED 21.8 billion compared with AED 24.8 billion in The top category during 2017 was 'Machinery, sound recorders, reproducers and parts', which contributed 24.9% of the re-exports total. The China was the top country destination for re-exports with goods valued at AED 3.4 billion. The value of imports in goods from Asian countries through the ports of the Emirate of Abu Dhabi was AED 54.3 billion during 2017 compared with AED 55.2 billion in The value of non-oil exports in goods to Asian countries through the ports of the Emirate of Abu Dhabi was AED 15.6 billion while reexports to Asian countries amounted to AED 18.1 billion Statistics of Foreign Trade in Goods through the Ports of the Emirate of Abu Dhabi (Million AED) Item Total trade in goods 387, , , ,740* 331,131* Total exports of goods 300, , , ,924* 219,010* Oil, gas and oil products 278, , , ,136* 174,893* Non-oil exports of goods 11,611 18,964 30,803 28,029 22,347 Re-exports 10,986 25,316 18,826 24,759 21,771 Imports of goods 86, , , , ,120 Net trade in goods 214, , ,203 75,107* 106,890* Source: Statistics Centre - Abu Dhabi * Preliminary estimates Oil, gas and oil products 2015 and 2016 does not include Exports of liquefied natural gas data 26 Statistical Yearbook of Abu Dhabi 2018
27 1.2.2 The Components of Foreign Trade in Goods as a Percentage of Total Trade in Goods through the Ports of the Emirate of Abu Dhabi (%) Item Total trade in goods Total exports of goods * 66.1* Oil, gas and oil products * 52.8* Non-oil exports of goods Re-exports Imports of goods Net trade in goods * 32.3* Source: Statistics Centre - Abu Dhabi * Preliminary estimates Indicators of Foreign Trade through the Ports of the Emirate of Abu Dhabi as a Percentage of the GDP at Current Prices (%) Item Total trade in goods * 39.8* Total exports of goods * 26.3* Oil, gas and oil products * 21.0* Non-oil exports of goods Re-exports Imports of goods Net trade in goods * 12.8* Source: Statistics Centre - Abu Dhabi * Preliminary estimates Figure Non-oil Foreign Trade in Goods Statistics through the Ports of the Emirate of Abu Dhabi, % 14.3% 13.9%. Non-oil Exports. Re-exports. Imports Statistical Yearbook of Abu Dhabi
28 1.2.4 Trade Balance of Non-oil Trade in Goods through the Ports of the Emirate of Abu Dhabi by Sections of the Harmonized System (HS), 2017 (Million AED) Description Exports Re- exports Imports Balance Total 22, , , ,551.1 Live animals and products thereof , ,820.7 Vegetable products , ,018.5 Animals or vegetable fats, oil and waxes Foodstuffs, beverages, spirits and tobacco , ,029.7 Mineral products , ,356.5 Products of the chemical or allied industries , ,715.1 Plastic, rubber and articles thereof 9, , ,568.8 Articles of leather and animal gut; travel goods Articles of wood, cork; basketware and wickerwork Pulp of wood, waste, scrap and article of paper , Textiles and textile articles , ,436.3 Footwear, umbrella, articles of feather and hair Articles of stone, mica; ceramic products and glass , ,096.4 Pearls, stones, precious metals and articles thereof , , ,333.7 Base metals and articles of base metals 9, , ,775.5 Machinery, sound recorder, reproducers and parts , , ,765.7 Transport vehicles , , ,355.0 Photographic, medical, musical instruments and parts , ,794.7 Arms and ammunition; parts and accessories Miscellaneous manufactured articles , Work of art, collectors pieces and antiques , ,744.9 Source: Statistics Centre - Abu Dhabi 28 Statistical Yearbook of Abu Dhabi 2018
29 1.2.5 Total Non-oil Exports of Goods to Imports of Goods Ratio for the Emirate of Abu Dhabi by Sections of the Harmonized System (HS) (%) Description Total Live animals and products thereof Vegetable products Animals or vegetable fats, oil and waxes Foodstuffs, beverages, spirits and tobacco Mineral products Products of the chemical or allied industries Plastic, rubber and articles thereof Articles of leather and animal gut; travel goods Articles of wood, cork; basketware and wickerwork Pulp of wood, waste, scrap and article of paper Textiles and textile articles Footwear, umbrella, articles of feather and hair Articles of stone, mica; ceramic products and glass Pearls, stones, precious metals and articles thereof , Base metals and articles of base metals Machinery, sound recorder, reproducers and parts Transport vehicles Photographic, medical, musical instruments and parts Arms and ammunition; parts and accessories Miscellaneous manufactured articles Work of art, collectors pieces and antiques Source: Statistics Centre - Abu Dhabi Statistical Yearbook of Abu Dhabi
30 1.2.6 Key Indicators of Non-oil Exports of Goods of the Emirate of Abu Dhabi (Million AED) Non-oil Exports of Goods Total 11, , , , ,346.5 Agricultural raw materials exports Food products , , Manufactured products 10, , , , ,740.2 Ores and metals , , , ,167.6 Other goods , , Source: Statistics Centre - Abu Dhabi 30 Statistical Yearbook of Abu Dhabi 2018
31 1.2.7 Non-oil Exports of Goods of the Emirate of Abu Dhabi by Sections of the Harmonized System (HS) (Million AED) Description Total 11, , , , ,346.5 Live animals and products thereof Vegetable products Animals or vegetable fats, oil and waxes Foodstuffs, beverages, spirits and tobacco Mineral products Products of the chemical or allied industries Plastic, rubber and articles thereof 2, , , , ,540.2 Articles of leather and animal gut; travel goods Articles of wood, cork; basket ware and wickerwork Pulp of wood, waste, scrap and article of paper Textiles and textile articles Footwear, umbrella, articles of feather and hair Articles of stone, mica; ceramic products and glass Pearls, stones, precious metals and articles thereof , , Base metals and articles of base metals 1, , , , ,440.1 Machinery, sound recorder, reproducers and parts Transport vehicles 5, Photographic, medical, musical instruments and parts Arms and ammunition; parts and accessories Miscellaneous manufactured articles Work of art, collectors pieces and antiques Source: Department of Finance - Customs Administration Statistical Yearbook of Abu Dhabi
32 1.2.8 Non-oil Exports by Utilization of Items of the Emirate of Abu Dhabi (Million AED) Non-oil Exports of Goods Total 11, , , , ,346.5 Capital goods 5, , Intermediate goods 5, , , , ,597.6 Final consumption goods , , ,316.8 Source: Statistics Centre - Abu Dhabi Non-oil Exports of Creative and Technology Goods of the Emirate of Abu Dhabi (Million AED) Non-oil Exports of Goods Total Creative goods Information and communication technology (ICT) goods High-tech products Source: Statistics Centre - Abu Dhabi Non-oil Exports of Goods of the Emirate of Abu Dhabi by Continent (Million AED) Continent Value % Value % Total 28, , Africa 2, , Asia 21, , Australia and Oceania Europe 3, , Northern America , South America Source: Statistics Centre - Abu Dhabi 32 Statistical Yearbook of Abu Dhabi 2018
33 Top Trade in Goods Partners of the Emirate of Abu Dhabi (Non-oil Exports) (Million AED) Countries Value % Value % Total 28, , China 5, , Saudi Arabia 3, , United States of America , India 2, , Oman , Netherlands , Singapore 1, Kuwait Qatar 1, Egypt Others 8, , Source: Department of Finance - Customs Administration Non-oil Exports of Goods through the Ports of the Emirate of Abu Dhabi to GCC Countries (Million AED) Countries Value % Value % Total 7, , Saudi Arabia 3, , Oman , Kuwait Qatar 1, Kingdom of Bahrain Source: Department of Finance - Customs Administration Non-oil Exports of Goods through the Ports of the Emirate of Abu Dhabi by Mode of Shipping (Million AED) Mode of Shipping Value % Value % Total 28, , Sea 17, , Land 7, , Air 3, Source: Department of Finance - Customs Administration Statistical Yearbook of Abu Dhabi
34 The Emirate of Abu Dhabi exported 0.48 billion barrels of crude oil in Japan was the top importer receiving around 31.4% of the Emirate'stotal crude oil exports. In 2017, the Emirate exported 32.5 million metric tons of re ned petroleum products, of which Japan bought 14.2%, followed by Netherlands, which purchased 12.0%. The Emirate imported billion cubic feet of natural gas in 2017, at a daily average of 2.1 billion cubic feet Exports of Crude Oil through the Ports of the Emirate of Abu Dhabi by Country (Thousand Barrels) Countries 2016* 2017* Volume % Volume % Total 581, , Japan 187, , India 88, , Singapore 41, , Thailand 75, , South Korea 55, , Pakistan 30, , China 45, , Taiwan 14, , New Zealand 9, , Bangladesh 4, , Philippines 1, , South Africa 4, , Australia 5, , Sri Lanka 12, , Malaysia 2, , others 1, , Source: Abu Dhabi National Oil Company - ADNOC * Preliminary estimates 34 Statistical Yearbook of Abu Dhabi 2018
35 Exports of Refined Petroleum Products through the Ports of the Emirate of Abu Dhabi by Country (Metric Tons) Countries 2016* 2017* Volume % Volume % Total 23,203, ,480, Japan 3,630, ,628, Netherlands 3,506, ,903, China 1,448, ,805, India 1,880, ,514, South Korea 2,357, ,386, Singapore 2,248, ,459, Indonesia 65, ,547, Taiwan 921, ,274, South Africa 507, ,119, United State of America 27, ,014, Kenya 858, , Gibraltar 756, , France 1,424, , Malaysia 435, , Sudan , Italy 374, , Thailand 232, , Eritrea 171, , Mozambique , Oman 675, , Argentina 43, , Vietnam , Tanzania 312, , Saudi Arabia 144, , Pakistan 13, , Others 1,164, , Source: Abu Dhabi National Oil Company - ADNOC * Preliminary estimates Statistical Yearbook of Abu Dhabi
36 Natural Gas Imports of the Emirate of Abu Dhabi (Million Cubic Feet) Item Volume of imports 794, , , , ,530.0 Daily average 2, , , , ,067.2 Source: Statistics Centre - Abu Dhabi Key Indicators of Re-exports through the Ports of the Emirate of Abu Dhabi (Million AED) Re-exports of Goods Total 10, , , , ,771.1 Agricultural raw materials Food products Manufactured products 10, , , , ,804.8 Ores and metals Other goods , , , ,352.2 Source: Statistics Centre - Abu Dhabi 36 Statistical Yearbook of Abu Dhabi 2018
37 Re-exports through the Ports of the Emirate of Abu Dhabi by Sections of the Harmonized System (HS) (Million AED) Description Total 10, , , , ,771.1 Live animals Vegetable products Animal or vegetable fats, oil and waxes Foodstuffs, beverages, spirits and tobacco Mineral products Products of the chemical or allied industries , Plastics, rubber and articles thereof Articles of leather and animal gut; travel goods Articles of wood, crook, basket ware and wickerwork Pulp of wood, waste, scrap and articles of paper Textiles and textile articles 1, , , , ,117.3 Footwear, umbrellas, articles of feather and hair Articles of stone, mica, ceramic products and glass Pearls, stones, precious metals and its articles 5.6 9, , , ,249.2 Base metals and articles of base meta Machinery, sound recorders, reproducers and parts 5, , , , ,770.0 Vehicles of transport 1, , , , ,103.4 Photographic, medical, musical instruments and parts Arms and ammunition, parts and accessories Miscellaneous manufactured articles Pieces and antiques, works of art, collectors Source: Department of Finance - Customs Administration Statistical Yearbook of Abu Dhabi
38 Re-exports by Utilization of Items of the Emirate of Abu Dhabi (Million AED) Re-exports of Goods Total 10, , , , ,771.1 Capital goods 4, , , , ,607.4 Intermediate goods 2, , , , ,904.9 Final consumption goods 3, , , , ,258.9 Source: Statistics Centre - Abu Dhabi Re-exports of Creative and Technology Goods of the Emirate of Abu Dhabi (Million AED) Re-exports of Goods Total 7, , , , ,549.7 Creative goods , Information and communication technology (ICT) goods 3, , , , ,402.0 High-tech products 3, , , , ,735.6 Source: Statistics Centre - Abu Dhabi Re-exports through the Ports of the Emirate of Abu Dhabi by Continent (Million AED) Continent Value % Value % Total 24, , Africa Asia 19, , Australia and Oceania Europe 4, , Northern America South America Source: Statistics Centre - Abu Dhabi 38 Statistical Yearbook of Abu Dhabi 2018
39 Top Trade Partners through the Ports of the Emirate of Abu Dhabi (Reexports) (Million AED) Countries Value % Value % Total 24, , China 2, , Kuwait 1, , Saudi Arabia 3, , Kingdom of Bahrain 2, , Germany France United Kingdom 2, Qatar 1, Hong Kong India Others 9, , Source: Department of Finance - Customs Administration Re-exports through the Ports of the Emirate of Abu Dhabi to GCC Countries (Million AED) Countries Value % Value % Total 9, , Kuwait 1, , Saudi Arabia 3, , Kingdom of Bahrain 2, , Qatar 1, Oman Source: Department of Finance - Customs Administration Re-exports through the Ports of the Emirate of Abu Dhabi by Mode of Shipping (Million AED) Mode of shipping Value % Value % Total 24, , Air 19, , Sea 3, , Land 1, , Source: Department of Finance - Customs Administration Statistical Yearbook of Abu Dhabi
40 Key Indicators of Imports of Goods of the Emirate of Abu Dhabi (Million AED) Imports of Goods Total 86, , , , ,120.4 Agricultural raw materials Food products 6, , , , ,670.6 Manufactured products 73, , , , ,066.1 Ores and metals 4, , , , ,726.1 Other goods , , , ,167.5 Source: Statistics Centre - Abu Dhabi 40 Statistical Yearbook of Abu Dhabi 2018
41 Imports of Goods through the Ports of the Emirate of Abu Dhabi by Sections of the Harmonized System (HS) (Million AED) Description Total 86, , , , ,120.4 Live animals 1, , , , ,067.3 Vegetable products 2, , , , ,130.0 Animal or vegetable fats, oil and waxes Foodstuffs, beverages, spirits and tobacco 1, , , , ,098.5 Mineral products 2, , , , ,506.6 Products of the chemical or allied industries 4, , , , ,014.4 Plastics, rubber and articles thereof 4, , , , ,226.0 Articles of leather and animal gut; travel goods Articles of wood, crook, basket ware and wickerwork Pulp of wood, waste, scrap and articles of 1, , , , ,109.2 paper Textiles and textile articles Footwear, umbrellas, articles of feather and hair Articles of stone, mica, ceramic products and 2, , , , ,365.9 glass Pearls, stones, precious metals and its articles , , ,963.3 Base metals and articles of base meta 15, , , , ,581.6 Machinery, sound recorders, reproducers 24, , , , ,871.4 and parts Vehicles of transport 20, , , , ,760.5 Photographic, medical, musical instruments and 1, , , , ,147.2 parts Arms and ammunition, parts and accessories Miscellaneous manufactured articles , , , ,062.3 Pieces and antiques, works of art, collectors ,969.7 Source: Department of Finance - Customs Administration Statistical Yearbook of Abu Dhabi
42 Imports by Utilization of Items of the Emirate of Abu Dhabi (Million AED) Imports of Goods Total 86, , , , ,120.4 Capital goods 16, , , , ,380.6 Intermediate goods 49, , , , ,489.2 Final consumption goods 20, , , , ,250.7 Source: Statistics Centre - Abu Dhabi Imports of Creative and Technology Goods of the Emirate of Abu Dhabi (Million AED) Imports of Goods Total 10, , , , ,900.0 Creative goods 1, , , ,890.0 Information and communication technology (ICT) goods 2, , , , ,210.9 High-tech products 7, , , , ,799.1 Source: Statistics Centre - Abu Dhabi Imports of Goods through the Ports of the Emirate of Abu Dhabi by Continent (Million AED) Continent Value % Value % Total 117, , Africa 4, , Asia 55, , Australia and Oceania 2, , Europe 30, , Northern America 23, , South America 2, , Source: Statistics Centre - Abu Dhabi 42 Statistical Yearbook of Abu Dhabi 2018
43 Top Trade in Goods Partners of the Emirate of Abu Dhabi (Imports) (Million AED) Countries Value % Value % Total 117, , United States of America 21, , Saudi Arabia 11, , Japan 9, , South Korea 7, , Germany 6, , France 4, , China 7, , United Kingdom 4, , Italy 4, , India 3, , Others 37, , Source: Department of Finance - Customs Administration Imports of Goods through the Ports of the Emirate of Abu Dhabi from GCC Countries by Value (Million AED) Countries Value % Value % Total 15, , Saudi Arabia 11, , Kingdom of Bahrain 1, , Oman 2, , Kuwait Qatar 1, Source: Department of Finance - Customs Administration Note: Table does not include imports from free trade zones located in the UAE Imports of Goods through the Ports of the Emirate of Abu Dhabi by Mode of Shipping (Million AED) Mode of Shipping Value % Value % Total 117, , Sea 64, , Air 34, , Land 18, , Source: Department of Finance - Customs Administration Statistical Yearbook of Abu Dhabi
44 1.3. Prices The price index is de ned as a tool for measuring the rate of change in prices of a set of goods and services between two periods. The period against which prices are compared is known as the base period and the period under review is known as the comparison period. Price statistics and indices include data on price levels in different sectors such as consumer, construction materials, and producers, in addition to a number of economic indicators such as in ation and the index of industrial production quantities. The annual and monthly in ation rates of the Emirate of Abu Dhabi are calculated through the consumer price index. The consumer price index is calculated according to the type of household, the level of family welfare and by region. The most important results of calculating the consumer price index for 2017 with a 2014 base year are as follows: Consumer price in ation reached 1.6% during 2017 compared with The index reached 108.1% in 2016, while it was 106.4% in The 'Housing, Water, Electricity, Gas and Other Fuels' group contributed 34.4% of the total rate of increase. This contribution was due to the high prices of this group which rose by 1.6%. The 'Transportation' group contributed 37.2% of the total rate of increase achieved during 2017 compared with 2016, while prices of this group increased by 4.3%. The 'Miscellaneous goods and services' group contributed 27.3% of the total rate of increase achieved during This contribution was due to the increase in the prices of this group by 6.4%. Prices of the 'Food and Beverages' group increased by 1.2% in 2017, and this group contributed 9.1% of the total rate of increase achieved in 2017 compared to The producer price index covers the manufacturing sector and is calculated quarterly. The construction of the producer price index is based on the list of major products in the manufacturing activities of ISIC4. The most important result of calculating the index of industrial producer prices for 2017 compared with 2016 was the 4.0% increase in prices. The quantitative index of industrial producers covers the manufacturing sector. The calculation is based on the list of major products in the manufacturing activities of ISIC 4. The most important results of calculating the industrial production index for the year 2017 compared with 2016 was the decrease of 4.6% in industrial production. The prices of building materials are considered to be important economic indicators for planning and research in various elds. They are also used in the compilation of indices of the construction activity and for the calculation of GDP at constant prices. As a result of the continuous development of the Emirate of Abu Dhabi and the continuous growth in the construction sector, the Statistics Center - Abu Dhabi regularly collects data on the prices of these materials. The annual relative change in construction materials prices for 2017 compared 2016, relative change for the year of 2016 compared to 2015, and so on up to 2012 compared to Statistical Yearbook of Abu Dhabi 2018
45 Figure Annual Rates of Inflation Source: Statistics Centre - Abu Dhabi Contribution of Different Expenditure Groups to the Overall Annual Percentage Change in Prices in 2017 Compared with 2016 (%) Major Expenditure Groups Weight (100.0) Relative Change Contribution Food and beverages Tobacco Clothing and footwear Housing, water, electricity, gas, and other fuels Fixtures and fittings, household equipment, and routine household maintenance Health Transportation Communication Recreation and culture Education Hotels and restaurants Miscellaneous goods and services Source: Statistics Centre - Abu Dhabi Statistical Yearbook of Abu Dhabi
46 Figure Relative Change in Average Prices for the Main Expenditure Groups in 2017 Compared with 2016 (%) Clothing and footwear Communication ecreation and culture Hotels and restaurants Food and beverages Housing, water, electricity, gas, and other fuels Fixtures and fittings, household equipment, and routine household maintenance Health Transportation Education Miscellaneous goods and services Tobacco Source: Statistics Centre - Abu Dhabi Relative Change in the Prices of the Main Expenditure Groups (2014=100) Groups of Commodities and Services Weight (100.0) Relative Change % Food and beverages Tobacco Clothing and footwear Housing, water, electricity, gas and other fuels Furnishing, household equipment and routine household maintenance Health Transport Communication Recreation and culture Education Restaurant and hotels Miscellaneous goods and services Source: Statistics Centre - Abu Dhabi 46 Statistical Yearbook of Abu Dhabi 2018
47 Figure Annual Inflation Rates for the months of Jan Feb Mar Apr May Jun Jul Aug Sep Oct Nov Dec Source: Statistics Center - Abu Dhabi Figure Monthly CPI 2016, 2017 (2014=100) January February March April May June July August September October November December Source: Statistics Center - Abu Dhabi Statistical Yearbook of Abu Dhabi
48 1.3.3 Annual CPI and Inflation Rates Year CPI Inflation Rate (%) Source: Statistics Centre - Abu Dhabi 48 Statistical Yearbook of Abu Dhabi 2018
49 1.3.4 Annual CPI and relative change by Household Type 2016, 2017 Year Citizen Non-Citizen Share Relative Change % Source: Statistics Centre - Abu Dhabi Figure Relative Change in CPI by Household Type in 2017 compared with Citizen Non-Citizen Share Source: Statistics Center - Abu Dhabi Statistical Yearbook of Abu Dhabi
50 1.3.5 CPI by Household Welfare Level for 2016 and 2017 (2014=100) Year Bottom Bottom- Middle Middle Top-Middle Top Relative Change % Source: Statistics Centre - Abu Dhabi Figure Relative Change in the CPI by Household Welfare Level in 2017 Compared with Bottom Bottom- Middle Middle Top-Middle Top Source: Statistics Center - Abu Dhabi 50 Statistical Yearbook of Abu Dhabi 2018
51 1.3.6 Relative Change in the Price Averages of the Main Groups of Building Materials during (Price in AED) Relative Relative Relative Relative Groups Change 2014 Change 2015 Change 2016 Change 2017 /2013 (%) /2014 (%) /2015 (%) /2016 (%) Cement Aggregates & sand Concrete Steel Wood Block Roofing materials Waterproofing products Waterproofing bituminous membrane Natural stone Tiles and marble Sanitary ware Bathroom set without accessories Bathroom set with accessories Sink stainless steel with mixer-single False ceiling Paints Glass Pipes (PVC) Pipes (UPVC) Pipes Wires Small building Apartments Residential towers Power cable Transport equipment Employment / with all services Diesel Source: Statistics Centre - Abu Dhabi Statistical Yearbook of Abu Dhabi
52 Figure Relative Change in Price Averages of the Main Groups of Building Materials in 2017 Compared with Cement Aggregates and sand Concrete Steel Wood Block Roofing materials Waterproofing products Natural stone Tiles and marble Bathroom set without accessories Bathroom Set with Accessories Sink Stainless Steel With Mixer-Single False ceiling Paints Glass (PVC) Pipes (upvc) Pipes Small Building Apartments Residential Towers Power Cable Transport equipment Employment / with all services Diesel Source: Statistics Center - Abu Dhabi 52 Statistical Yearbook of Abu Dhabi 2018
53 1.3.7 Industrial Producer Price Index during 2016 and 2017 (2012=100) Economic Activities weight of Percentage PPI 2016 PPI 2017 base year change Manufacturing Manufacture of food products Manufacture of beverages Manufacture of textiles Manufacture of wearing apparel Manufacture of leather and related products Manufacture of wood and of products of wood and cork, except furniture; manufacture of articles of straw and plaiting materials Manufacture of paper and paper products Printing and reproduction of recorded media Manufacture of coke and refined petroleum products Manufacture of chemicals and chemical products Manufacture of pharmaceuticals, medicinal chemical and botanical products Manufacture of rubber and plastics products Manufacture of other non-metallic mineral products Manufacture of basic metals Manufacture of fabricated metal products, except machinery and equipment Manufacture of computer, electronic and optical products Manufacture of electrical equipment Manufacture of machinery and equipment n.e.c Manufacture of motor vehicles, trailers and semi-trailers Manufacture of other transport equipment Manufacture of furniture Other manufacturing Repair and installation of machinery and equipment Source: Statistics Centre - Abu Dhabi Statistical Yearbook of Abu Dhabi
54 1.3.8 Industrial Production Index during 2016 and 2017 (2012=100) Economic Activities weight of Percentage IPI 2016 IPI 2017 base year change Manufacturing Manufacture of food products Manufacture of beverages Manufacture of textiles Manufacture of wearing apparel Manufacture of leather and related products Manufacture of wood and of products of wood and cork, except furniture; manufacture of articles of straw and plaiting materials Manufacture of paper and paper products Printing and reproduction of recorded media Manufacture of coke and refined petroleum products Manufacture of chemicals and chemical products Manufacture of pharmaceuticals, medicinal chemical and botanical products Manufacture of rubber and plastics products Manufacture of other non-metallic mineral products Manufacture of basic metals Manufacture of fabricated metal products, except machinery and equipment Manufacture of computer, electronic and optical products Manufacture of electrical equipment Manufacture of machinery and equipment n.e.c Manufacture of motor vehicles, trailers and semi-trailers Manufacture of other transport equipment Manufacture of furniture Other manufacturing Repair and installation of machinery and equipment Source: Statistics Centre - Abu Dhabi Statistical Yearbook of Abu Dhabi 2018
55 1.3.9 Price indecies for Construction Cost Index groups for 2015, 2016 and 2017 (2013=100) Commodity weight of base year 2013 CCI 2015 CCI 2016 CCI 2017 General Index Construction materials Finishing materials Electrical works materials Mechanical works - plumbing and drainage materials Mechanical works - fire fighting Mechanical works - A/C Equipment Manpower Services Finances and bonds Source: Statistics Centre - Abu Dhabi Monthly agriculture producer price Index for the period of (2016=100) Month January February March April May June July August September October November December Source: Statistics Centre - Abu Dhabi Statistical Yearbook of Abu Dhabi
56 Education price index by regions of Abu Dhabi 2017 (2016=100) Group Abu Dhabi Al Ain Al Dhafra Abu Dhabi Emirate Education Primary and pre-primary education high school Post-secondary non-tertiary education Higher Education Education not defined at level Source: Statistics Centre - Abu Dhabi 56 Statistical Yearbook of Abu Dhabi 2018
57 Imports unit value index and relative change for the the year of 2017 compared to the year 2016 by the "Harmonized System" (2014=100) Group Relative Change % General Index Live animals Vegetable products Animal or vegetable fats, oil and waxes Foodstuffs, beverages, spirits and tobacco Mineral products Products of the chemical or allied industries Plastics, rubber and articles thereof Articles of leather and animal gut; travel goods Articles of wood, crook, basket ware and wickerwork Pulp of wood, waste, scrap and articles of paper Textiles and textile articles Footwear, umbrellas, articles of feather and hair Articles of stone, mica, ceramic products and glass Pearls, stones, precious metals and its articles Base metals and articles of base meta Machinery, sound recorders, reproducers and parts Vehicles of transport Photographic, medical, musical instruments and parts Miscellaneous manufactured articles Source: Statistics Centre - Abu Dhabi Statistical Yearbook of Abu Dhabi
58 Export unit value index and relative change for the the year of 2017 compared to the year 2016 by the "Harmonized System" (2014=100) Group Relative Change % General Index Live animals Vegetable products Animal or vegetable fats, oil and waxes Foodstuffs, beverages, spirits and tobacco Mineral products Products of the chemical or allied industries Plastics, rubber and articles thereof Articles of leather and animal gut; travel goods Articles of wood, crook, basket ware and wickerwork Pulp of wood, waste, scrap and articles of paper Textiles and textile articles Footwear, umbrellas, articles of feather and hair Articles of stone, mica, ceramic products and glass Pearls, stones, precious metals and its articles Base metals and articles of base meta Machinery, sound recorders, reproducers and parts Vehicles of transport Photographic, medical, musical instruments and parts Miscellaneous manufactured articles Source: Statistics Centre - Abu Dhabi 58 Statistical Yearbook of Abu Dhabi 2018
59 1.4 Financial Statistics Financial intermediation is an important productive activity, which plays a vital role in the development of the Emirate of Abu Dhabi, and acts as the main nancing vehicle for other economic activities. This section provides key indicators of the nancial intermediation activity including statistics from the banks and nancial institutions survey, in addition to the main performance indicators of the Abu Dhabi Securities Market. Registered banks dominated nancial intermediation in Abu Dhabi, although there are a substantial number of non-bank nancial institutions, such as holding companies, trusts, and nancial leasing institutions. The majority of Abu Dhabi's registered banks are subsidiaries or branches of overseas banks. The number of registered banks on December 31, 2017 totaled 51 banks, of which seven are based in Abu Dhabi. This section shows that the total value of shares traded on the Abu Dhabi Securities Exchange during 2017 amounted to AED 48.1 billion. The market capitalization of shares in the Abu Dhabi stock market in 2017 rose by 3.0% compared with Key Statistics of the Financial and Insurance Activity Indicators * Share in GDP at current prices (%) Share in non-oil GDP at current prices (%) Gross output (% of GDP at current prices) Capital formation (% of GDP at current prices) Compensation of employees (Million AED) 12,008 13,069 13,629 13,906 Source: Statistics Centre-Abu Dhabi * Preliminary estimates Statistical Yearbook of Abu Dhabi
60 1.4.2 Key Statistics of the Abu Dhabi Securities Market Indicators Total listed domestic companies Total listed foreign companies Market capitalization (Billion AED) Market capitalization (% of GDP at current prices) Value traded (Billion AED) Value traded (% of GDP at current prices) Shares Turnover Ratio (%) (No. of Domestic Traded Shares / No. of Domestic Issued shares) INDEX (Point) 2,402 4,529 4,307 4,546 4,398 Source: Statistics Centre-Abu Dhabi, Abu Dhabi Securities Exchange-ADX Banks Statistics for Abu Dhabi Based Banks, 2017 Indicators Q1 Q2 Q3 Q4 Net Income for Abu Dhabi based banks (million AED) 7,678 7,608 7,725 7,815 Average compensation of employees per worker for Abu Dhabi based banks (AED) 43,525 39,268 40,352 43,579 Source: Central Bank - UAE 60 Statistical Yearbook of Abu Dhabi 2018
61 1.5 Government Finance Government Financial Statistics in this section includes percentage distribution of revenues and expenditures of the Abu Dhabi Government. The revenue in 2017 increased by 44.9% compared with The increased could mainly be attributed to higher Petroleum royalties and tax revenues. Current expenditure as a percentage of total public expenditure increased from 82.5% in 2016 to 85.8% in The sub items of current transfers, goods and services, and salaries and wages contributed 45.1%, 19.7% and 20.9% of total expenditure respectively. Capital expenditure as a percentage of total public expenditure decreased from 17.5% in 2016 to 14.2% in Capital transfers, development expenditures on government projects and capital expenditure on goods and services respectively contributed 8.9%, 4.3% and 1.0% of total expenditure Percentage Distribution of Government Revenues (%) Item * Total Petroleum royalties and tax revenue Department collections revenue Capital revenue Source: Statistics Centre - Abu Dhabi * Preliminary estimates Figure Percentage Distribution of Government Revenues, % 11.5% 79.3%. Petroleum royalties and tax revenue. Department collections revenue. Capital revenue Source: Statistics Centre-Abu Dhabi Statistical Yearbook of Abu Dhabi
62
63 1.6. Wages and Compensation The compensation of employees indicator provides important information for the national accounts in particular and the economy in general, as it re ects the income obtained by employees in all economic activities in the Emirate of Abu Dhabi. Compensation of employees at current prices increased from AED 226,921 million in 2016 to AED 233,573 million in The main economic activities contributing to the growth in 2017 were 'Public administration and defence; compulsory social security', and 'Human health and social work' with increases of 9.5% and 6.6% respectively. Statistical Yearbook of Abu Dhabi
64 1.6.1 Compensation of Employees by Economic Activity at Current Prices (Million AED) Economic Activity * Total 138, , , , ,573 Agriculture, forestry and fishing 1,394 1,946 2,022 2,056 2,133 Mining and quarrying (includes crude oil and 8,265 15,646 18,493 16,996 16,080 natural gas) Manufacturing 11,044 17,499 19,021 19,002 19,972 Electricity, gas, and water supply; waste management 2,176 2,417 2,370 2,366 2,445 Construction 23,638 29,758 30,325 29,345 28,007 Wholesale and retail trade; repair of motor vehicles and 8,281 12,553 13,122 14,158 14,109 motorcycles Transportation and storage 6,934 10,955 11,915 13,610 13,539 Accommodation and food services 3,172 4,969 5,234 5,440 5,751 Information and communication 4,740 5,161 5,518 4,857 5,037 Financial and insurance 7,743 12,008 13,069 13,629 13,906 Real estate 1,692 2,156 2,307 2,784 2,698 Professional, scientific and technical 9,449 10,549 11,071 10,450 10,605 Administrative and support services 3,388 6,586 6,925 7,409 7,764 Public administration and defence; compulsory social 30,662 51,620 52,383 55,309 60,574 security Education 6,334 10,800 11,156 12,060 12,502 Human health and social work 6,883 9,372 10,320 10,902 11,623 Arts, recreation and other services 1,210 1,446 1,420 1,507 1,578 Activities of households as employers 1,572 4,052 4,502 5,042 5,249 Source: Statistics Centre - Abu Dhabi * Preliminary estimates 64 Statistical Yearbook of Abu Dhabi 2018
65 1.6.2 Annual Growth Rates of Compensation of Employees by Economic Activity at Current Prices (%) Economic Activity * Total Agriculture, forestry and fishing Mining and quarrying (includes crude oil and natural gas) Manufacturing Electricity, gas, and water supply; waste management Construction Wholesale and retail trade; repair of motor vehicles and motorcycles Transportation and storage Accommodation and food services Information and communication Financial and insurance Real estate Professional, scientific and technical Administrative and support services Public administration and defence; compulsory social security Education Human health and social work Arts, recreation and other services Activities of households as employers Source: Statistics Centre - Abu Dhabi * Preliminary estimates Statistical Yearbook of Abu Dhabi
66 1.6.3 Compensation of Employees by Economic Activity as a Percentage of the GDP at Current Prices (%) Economic Activity * Total Agriculture, forestry and fishing Mining and quarrying (includes crude oil and natural gas) Manufacturing Electricity, gas, and water supply; waste management Construction Wholesale and retail trade; repair of motor vehicles and motorcycles Transportation and storage Accommodation and food services Information and communication Financial and insurance Real estate Professional, scientific and technical Administrative and support services Public administration and defence; compulsory social security Education Human health and social work Arts, recreation and other services Activities of households as employers Source: Statistics Centre - Abu Dhabi * Preliminary estimates 66 Statistical Yearbook of Abu Dhabi 2018
67 1.7. Foreign Investment The Abu Dhabi Government has made vast strides in establishing favorable conditions and enhancing investor con dence in the economy. A transparent tax structure, with a supporting judicial system, investment encouraging business legislation and industrial zones enhances international investor perception about business opportunities in the Emirate. The total value of Foreign Direct Investment (FDI) at the end of 2016 was AED 100,887 million, up from AED 88,095 million at the end of This increase could mainly be attributed to 'Real estate ', which attracted FDI worth AED 27,954 in 2016, compared with AED 23,793 million in 'Manufacturing industries' accounted for 18.0% of FDI stocks in 2016 compared with 19.5% in FDI from the GCC region amounted to AED 2,866 million or 2.8% of total FDI in 2016 compared with AED 3,213 million or 3.6% in Investments from other Arab countries totaled AED 6,414 and AED 8,034 million of FDI for the years 2015 and 2016, respectively. FDI from European countries increased from AED 36,021 million in 2015 to AED 45,201 million in Total portfolio investments in the Emirate of Abu Dhabi consisting of equity securities including debt securities amounted to AED131,354 million in Other investments amounted to AED 227,290 million in 2016, compared with AED 177,111 million in Statistical Yearbook of Abu Dhabi
68 1.7.1 Total stock of Foreign Investment by Economic Activity (Million AED) Economic Activity Total 264, , , ,531 Mining and quarrying (includes crude oil and natural gas) 9,046 8,342 8,921 18,217 Manufacturing 25,086 15,865 17,662 18,566 Electricity, gas, and water supply; waste management 17,961 18,792 24,115 23,752 Construction 6,390 8,247 7,246 8,200 Wholesale and retail trade; repair of motor vehicles and motorcycles** ,374 Transportation and storage** 4,158 4,056 4,947 1,300 Accommodation and food services Information and communication 7,139 31,306 31,287 33,362 Financial and insurance 159, , , ,541 Real estate* 31,157 27,398 27,632 36,673 Professional, scientific and technical 1,938 3,177 3,409 4,566 Administrative and support services** Education Human health and social work Arts, recreation and other services** Public administration and defence; compulsory social security ,403 Source: Statistics Centre - Abu Dhabi Note: Figures may not sum to totals due to rounding * Includes real estate sales to non-residents ** In 2016 the change in some activities it due to the transfer of some establishments between ISIC 4 classifications 68 Statistical Yearbook of Abu Dhabi 2018
69 1.7.2 Total stock of Foreign Direct Investment by Economic Activity (Million AED) Economic Activity Total 71,931 81,112 88, ,887 Mining and quarrying (includes crude oil and natural gas) 7,267 7,045 8,354 17,414 Manufacturing 13,043 15,502 17,204 18,113 Electricity, gas, and water supply; waste management 6,904 8,279 10,190 9,929 Construction 5,891 7,281 6,379 8,010 Wholesale and retail trade; repair of motor vehicles and motorcycles** ,362 Transportation and storage** 1,992 1,850 3,523 1,246 Accommodation and food services Information and communication Financial and insurance 10,137 12,731 13,338 10,497 Real estate* 23,599 23,513 23,793 27,954 Professional, scientific and technical 1,782 3,015 3,198 4,327 Administrative and support services** Education Human health and social work Arts, recreation and other services** Source: Statistics Centre - Abu Dhabi Note: Figures may not sum to totals due to rounding * Includes real estate sales to non-residents ** In 2016 the change in some activities it due to the transfer of some establishments between ISIC 4 classifications Statistical Yearbook of Abu Dhabi
70 Figure Total stock of Foreign Investment (Million AED) , , , , ,000. Foreign Direct Investment. Portfolio Investment. Other Investment Source: Statistics Centre - Abu Dhabi Total stock of Foreign Direct Investment by Economic Activity as a Percentage of the GDP at Current Prices (%) Economic Activity Total Mining and quarrying (includes crude oil and natural gas) Manufacturing Electricity, gas, and water supply; waste management Construction Wholesale and retail trade; repair of motor vehicles and motorcycles Transportation and storage Financial and insurance Real estate* Professional, scientific and technical Administrative and support services Education Source: Statistics Centre - Abu Dhabi Note: Figures may not sum to totals due to rounding * Includes real estate sales to non-residents 70 Statistical Yearbook of Abu Dhabi 2018
71 1.7.4 Percentage Distribution of Foreign Direct Investment by Economic Activity (%) Economic Activity Total Mining and quarrying (includes crude oil and natural gas) Manufacturing Electricity, gas, and water supply; waste management Construction Wholesale and retail trade; repair of motor vehicles and motorcycles** Transportation and storage** Information and communication Financial and insurance Real estate* Professional, scientific and technical Administrative and support services** Education Human health and social work Arts, recreation and other services** Source: Statistics Centre - Abu Dhabi Note: Figures may not sum to totals due to rounding * Includes real estate sales to non-residents ** In 2016 the change in some activities it due to the transfer of some establishments between ISIC 4 classifications Statistical Yearbook of Abu Dhabi
72 1.7.5 Total stock of Foreign Direct Investment by Top Ten Countries (Million AED) Countries Value % Value % Total 88, , United Kingdom 5, , Austria 13, , France 7, , Japan 3, , South Korea 4, , Libya 2, , Cayman Islands 1, , Netherlands 3, , Jordan 1, , United States 3, , Other* 41, , Source: Statistics Centre - Abu Dhabi Note: Figures may not sum to totals due to rounding * Includes real estate sales to non-residents Total stock of Foreign Direct Investment by Region (Million AED) Region Total 71,931 81,112 88, ,887 GCC countries 1,614 2,820 3,213 2,866 Other Arab countries 6,637 6,643 6,414 8,034 Other Asian countries 6,342 7,982 11,013 12,582 Other African countries European countries 26,684 32,980 36,021 45,201 North America 1,744 1,796 5,094 3,867 Latin America 1,613 1,701 1, Other regions* 27,115 27,190 25,018 28,174 Source: Statistics Centre - Abu Dhabi Note: Figures may not sum to totals due to rounding * Includes real estate sales to non-residents The change in the share of some countries in 2016 is includes movement of ownership between countries 72 Statistical Yearbook of Abu Dhabi 2018
73 1.7.7 Percentage Distribution of Foreign Direct Investment by Region (%) Region Total GCC countries Other Arab countries Other Asian countries Other African countries European countries North America Latin America Other regions* Source: Statistics Centre - Abu Dhabi Note: Figures may not sum to totals due to rounding The change in the share of some countries in 2016 is includes movement of ownership between countries * Includes real estate sales to non-residents Figure Percentage Distribution of Foreign Direct Investment by Region, % 3.8% 27.9% 2.8% 8.0% 12.5% 44.8%. GCC countries. Other Arab countries. Other Asian countries. European countries. North America. Latin America. Other regions Source: Statistics Centre - Abu Dhabi Statistical Yearbook of Abu Dhabi
74 1.7.8 Total stock of Other Investment by Economic Activity (Million AED) Economic Activity Total 135, , , ,290 Mining and quarrying (includes crude oil and natural gas) 1,779 1, Manufacturing 12, Electricity, gas, and water supply; waste management 10,916 10,512 13,642 8,393 Construction Wholesale and retail trade; repair of motor vehicles and motorcycles* ,975 Transportation and storage* 2,166 2,206 1, Information and communication 6,994 31,154 31,148 30,070 Financial and insurance 100, , , ,455 Real estate Professional, scientific and technical Administrative and support services* Education Source: Statistics Centre - Abu Dhabi Note: Figures may not sum to totals due to rounding * In 2016 The change in some activities it due to the transfer of some establishments between ISIC 4 classifications 74 Statistical Yearbook of Abu Dhabi 2018
75 1.7.9 Percentage Distribution of Other Investment by Economic Activity (%) Economic Activity Total Mining and quarrying (includes crude oil and natural gas) Manufacturing Electricity, gas, and water supply; waste management Construction Wholesale and retail trade; repair of motor vehicles and motorcycles* Transportation and storage* Information and communication Financial and insurance Real estate Professional, scientific and technical Source: Statistics Centre - Abu Dhabi Note: Figures may not sum to totals due to rounding * In 2016 The change in some activities it due to the transfer of some establishments between ISIC 4 classifications Total stock of Portfolio Investment by Economic Activity (Million AED) Economic Activity Total 57,125 57,283 87, ,354 Mining and quarrying (includes crude oil and natural gas) Manufacturing Electricity, gas, and water supply; waste management ,430 Construction Wholesale and retail trade; repair of motor vehicles and motorcycles ,037 Information and communication ,801 Financial and insurance 49,657 53,405 83,702 95,590 Real estate 7,328 3,878 3,831 8,697 Public administration and defence; compulsory social security ,403 Source: Statistics Centre - Abu Dhabi Note: Figures may not sum to totals due to rounding Statistical Yearbook of Abu Dhabi
76

77 2. Industry and Business Investment climate Manufacturing Oil and Gas Petrochemicals Electricity and Water Construction Transportation ICT Hotels
78 2. Industry and Business The key indicators in the Industry and Business chapter provide statistical data on all economic activities of the Emirate of Abu Dhabi and re ect the growing economy of the Emirate. The 'Mining and quarrying' activity is particularly important. Manufacturing activity accounted for 6.5% based on preliminary estimates of the GDP in In the "Tourism" activity, the total number of hotel establishments was 162 in Over the same period, the number of guests increased by 10.1 %, the number of rooms by 0.9 % and the occupancy rate was 72.0%, while the average length of stay reached 2.5 nights. In the "Transport" activity, the number of passengers travelling through the Emirate's airports totaled 23.6 million during 2017 compared with 24.6 million during In the "Information and communication" activity, the number of xed telephone subscriptions was 15 per 100 inhabitants, and the xed broadband subscribers was 12 per 100 inhabitants in Total Number of Business Licenses (New & renewed) 91,742 Production of Petrochemicals Products (Metric Tons) 6,246,038 Domestic Sales of Petrochemical Products (Metric Tons) 467,678 Number of Building Permits Issued in the Emirate of Abu Dhabi 7,003 Number of Passengers Using the Emirate's Airports (Million) 23.6 Fixed Telephone Subscribers Per 100 Inhabitants 15 Fixed broadband subscribers per 100 Inhabitants 12 Number of Hotel Establishments 162 Number of Hotel Establishments Guests (Thousand) 4, Statistical Yearbook of Abu Dhabi 2018
79 2.1. Business Environment Abu Dhabi Government adopted a long-term plan to facilitate the transformation of the Emirate's economy with the objective of creating an ideal business environment, reducing the reliance on the oil sector and establishing a greater focus on a knowledge-based economy in the future. The Emirate of Abu Dhabi has made signi cant progress in this regard and the Emirate's economic development and achievements can largely be attributed to the presence of such an environment. There are several underlying factors contributing to the Emirate's attractive business environment, including the policies followed in the Emirate of Abu Dhabi for the implementation of Abu Dhabi Vision 2030, strategic geographic location, highly developed infrastructure, miscellaneous facilities offered by the Emirate's industrial zones, very low taxation and easy access to energy sources and efficient credit facilities. The Abu Dhabi Government has a strong commitment to establish and grow local entrepreneurship while at the same time establishing an economy, which is well integrated with the global economy A total of 9,417 new business licenses were registered in 2017, while 2,596 licenses were cancelled during the same year General Indicators of the Business Environment Indicators Number of registered new business licenses 9,934 9,228 8,963 9,417 Number of renewed business licenses 73,055 75,392 77,709 82,325 Number of canceled business licenses 1,820 7,313 2,114 2,596 Source: Department of Economic Development Key Statistics of Wholesales and Retail Trade and Repairing Services Indicators * Share in GDP (% ) Share in non-oil GDP (% ) Gross Output (% of GDP) Capital Formation (% of GDP) Compensation of Employees (Million AED) 12,553 13,122 14,158 14,109 Source: Statistics Centre - Abu Dhabi * Preliminary estimates Statistical Yearbook of Abu Dhabi
80 2.2. Manufacturing Manufacturing is one of the strategically important economic activities in the Emirate of Abu Dhabi. The long-term economic development plan places focus on the manufacturing sector to contribute signi cantly to the development of the non-oil economy and ensure more stable economic growth in the Emirate. The Manufacturing activity accounted for 6.5% based on preliminary estimates of the GDP in 2017 and 10.1% based on preliminary estimates of the non- oil GDP in Key Statistics of the Manufacturing Activity Indicators * Share in GDP at current prices (% ) Share in non-oil GDP at current prices (% ) Gross output (% of GDP at current prices) Capital formation (% of GDP at current prices) Compensation of employees (Million AED) 17,499 19,021 19,002 19,972 Source: Statistics Centre - Abu Dhabi * Preliminary estimates 80 Statistical Yearbook of Abu Dhabi 2018
81 2.2.2 Gross Output and Value Added of the Manufacturing Activity (Million AED) Type of Manufacturing Activity Gross Output Value Added Gross Output Value Added Total 171,556 52, ,908 51,938 Food, beverages and tobacco 9,759 3,690 9,860 3,716 Textiles, garments and leather products 2,239 1,066 2,262 1,091 Wood and wood products Paper, printing, publishing and reproduction media Chemicals and plastics and related products 89,275 22,764 89,009 21,168 Non-metallic mineral products (except oil) 11,617 3,570 11,406 3,543 Manufacture of basic metal 23,254 6,434 22,562 6,459 Structural metal products except machinery and equipment 11,240 4,436 10,047 3,839 Machinery, equipment and devices 9,110 3,285 8,591 3,146 Furniture Repair and installation of machinery,equipment and other manufacturing 12,573 6,195 15,697 7,837 Source: Statistics Centre - Abu Dhabi Statistical Yearbook of Abu Dhabi
82 2.2.3 Gross Fixed Capital Formation of the Manufacturing Activity (Million AED) Type of Manufacturing Activity Total 12,911 11,611 Food, beverages and tobacco Textiles, garments and leather products Wood and wood products Paper, printing, publishing and reproduction media Chemicals and plastics and related products 8,144 6,441 Non-metallic mineral products (except oil) Manufacture of basic metal 1,098 1,152 Structural metal products except machinery and equipment Machinery, equipment and devices Furniture Repair and installation of machinery,equipment and other manufacturing 1,582 1,736 Source: Statistics Centre - Abu Dhabi Figure Value Added of the Manufacturing Activity 25,000 20,000 15,000 10,000 5,000 0 Food, beverages and tobacco Textiles, garments and leather products Wood and wood products Paper, printing, publishing and reproduction media Million AED Chemicals and plastics and related products Non-metallic mineral products (except oil) Manufacture of basic metal Structural metal products except machinery and equipment Machinery, equipment and devices Furniture Repair and installation of machinery, equipment and other manufacturing Source: Statistics Centre - Abu Dhabi 82 Statistical Yearbook of Abu Dhabi 2018
83 2.2.4 Key Statistics of the Basic Metal of Manufacturing Activity Indicators * Share in GDP at current prices (% ) Share in non-oil GDP at current prices (% ) Gross output (% of GDP at current prices) Capital formation (% of GDP at current prices) Compensation of employees (Million AED) 1,837 1,860 1,837 2,022 Imports (% of total imports) Exports (% of total non-oil exports) Source: Statistics Centre - Abu Dhabi * Preliminary estimates Statistical Yearbook of Abu Dhabi
84 2.3. Oil and Gas Key Statistics of Oil and Gas Activity Indicators * Share in GDP at current prices (%) Gross output (% of GDP at current prices) Capital formation (% of GDP at current prices) Compensation of employees (Million AED) 13,339 15,530 14,220 13,252 Source: Statistics Centre - Abu Dhabi * Preliminary estimates 84 Statistical Yearbook of Abu Dhabi 2018
85
86 2.4.3 Export Prices of Petrochemicals Products ($/Metric Tons) Type of Products Ammonia Urea fertilizer Polyethylene 1,576 1,602 1,295 1,186 1,263 Polypropylene 1,539 1,569 1,177 1,044 1,159 Source: Abu Dhabi National Oil Company - ADNOC 86 Statistical Yearbook of Abu Dhabi 2018
87 2.5. Electricity and Water Key Statistics of Electricity and Water Activities Indicators * Share in GDP at current prices (% ) Share in non-oil GDP at current prices (% ) Gross output (% of GDP at current prices) Capital formation (% of GDP at current prices) Compensation of employees (Million AED) 2,191 2,155 2,140 2,209 Source: Statistics Centre - Abu Dhabi * Preliminary estimates Statistical Yearbook of Abu Dhabi
88 2.6. Construction Several focus sectors have been identi ed by the Abu Dhabi government for their potential to provide long-term, sustainable growth and diversi cation of the Emirate of Abu Dhabi's economy over the next two decades and beyond. New infrastructure such as hotels and resorts are required for development of the tourism industry in the Emirate of Abu Dhabi and construction as one of the enabler industries will contribute to the development and support of the targeted future growth sectors. Construction activity contributed 9.9% based on preliminary estimates of the GDP in Building permits statistics show that the number of residential building permits issued (Residential,Residential and commercial) in 2017 reached 5,891. In addition 1,112 non-residential building permits were issued in 2017 compared with 1,162 in The number of building permits issued for construction of new buildings represented 10.9% of the total number of building permits issued in Key Statistics of the Construction Activity Indicators * Share in GDP at current prices (% ) Share in non-oil GDP at current prices (% ) Gross output (% of GDP at current prices) Capital formation (% of GDP at current prices) Compensation of employees (Million AED) 29,758 30,325 29,345 28,007 Source: Statistics Centre - Abu Dhabi * Preliminary estimates 88 Statistical Yearbook of Abu Dhabi 2018
89 2.6.2 Number of Permits Issued by Type-Abu Dhabi Region Type of Permits Total 18,065 19,830 19,155 17,705 New buildings 1,350 1,322 1,972 1,733 Permits renewal or amendments 5,124 5,813 6,904 5,953 Additions 2,662 2,823 2,900 3,273 Improvements and decorations 4,414 4,054 1,959 1,101 Temporary 1,010 1, Demolition Others 3,288 4,546 5,176 5,360 Source:Department of Urban Planning and Municipalities, Abu Dhabi city Municipality Number of Permits Issued by Type-Al Ain Region Type of Permits Total 3,377 4,615 4,292 3,238 3,616 New buildings 1, ,295 1,243 1,009 Permits renewal or amendments ,404 Additions 982 3, Improvements and decorations , Temporary Demolition Others Source:Department of Urban Planning and Municipalities, Al Ain city Municipality Statistical Yearbook of Abu Dhabi
90 2.6.4 Number of Permits Issued by Type-Al Dhafra Region Type of Permits Total ,011 6,909 5,650 New buildings Permits renewal or amendments Additions Improvements and decorations Temporary Demolition Others ,279 6,097 4,923 Source:Department of Urban Planning and Municipalities,Al Dhafra Region Municipality Number of Permits Issued by Building Usage-Abu Dhabi Region Building Usage Total 7,268 18,065 19,830 19,155 17,705 Residential 4,473 10,413 10,953 10,714 10,955 Commercial 968 2,753 2,782 1,959 1,668 Industrial 638 1,013 1,487 1,357 1,273 Public utilities , Agricultural Residential and commercial 6 1,217 1,089 1,174 1,422 Temporary Others 821 1,978 2,424 3,112 1,733 Source:Department of Urban Planning and Municipalities, Abu Dhabi city Municipality Note: Data includes all types of licenses 90 Statistical Yearbook of Abu Dhabi 2018
91 2.6.6 Number of Permits Issued by Building Usage -Al Ain Region Building Usage Total 3,377 4,615 4,292 3,238 3,616 Residential 2,422 3,493 3,122 2,853 2,881 Commercial Industrial Public utilities Agricultural Residential and commercial Others Source: Department of Urban Planning and Municipalities, Al Ain city Municipality Note: Data includes all types of licenses Number of Permits Issued by Building Usage-Al Dhafra Region Building Usage Total ,011 6,909 5,650 Residential ,947 4,262 3,624 Commercial Industrial Public utilities Agricultural Others Source: Department of Urban Planning and Municipalities,Al Dhafra Region Municipality Note: Data includes all types of licenses Statistical Yearbook of Abu Dhabi
92 2.6.8 Number of Building Permits Issued by Type and Building Usage - Abu Dhabi Region Building Usage New Buildings Additions New Buildings Additions Total 1,972 2,900 1,733 3,273 Residential 1,576 2,337 1,366 2,715 Commercial Industrial Agricultural Public utilities Residential and commercial Others Source:Department of Urban Planning and Municipalities, Abu Dhabi city Municipality Number of Building Permits Issued by Type and Building Usage - Al Ain Region Building Usage New Buildings Additions New Buildings Additions Total 1, , Residential 1, Commercial Industrial Agricultural Public utilities Residential and commercial Others Source:Department of Urban Planning and Municipalities, Al Ain city Municipality 92 Statistical Yearbook of Abu Dhabi 2018
93 Number of Building Permits Issued by Type and Building Usage -Al Dhafra Region Building Usage New Buildings Additions New Buildings Additions Total Residential Commercial Industrial Agricultural Public utilities Others Source:Department of Urban Planning and Municipalities,Al Dhafra Region Municipality Statistical Yearbook of Abu Dhabi
94 2.7. Transportation The Abu Dhabi Government attaches increasing attention to the transportation activity as it is considered one of the catalyst activities of economic development in the Emirate. New transport means are created to keep pace with economic and urban development taking place in the Emirate. The existing infrastructure is continuously upgraded to enhance connections between the Emirate's geographical regions and with global markets.ongoing investment in the Emirate's transport infrastructure contributed to the transport activity maintaining a signi cant share in Gross Domestic Product. The total aircraft movements in 2017 were about 184 thousand ights compared with 194 thousand ights in 2016, a decrease of 5.1% compared with The number of passengers equaled 23.5 million in 2017, an decrease of 4.2% compared with Key Statistics of Transportation and Storage Indicators * Share in GDP at current prices (% ) Share in non-oil GDP at current prices (% ) Gross output (% of GDP at current prices) Capital formation (% of GDP at current prices) Compensation of employees (Million AED) 10,955 11,915 13,610 13,539 Source: Statistics Centre - Abu Dhabi * Preliminary estimates Fuel prices at service stations Indicator Pump price for diesel fuel (AED per litre) Pump price for gasoline (AED per litre)* Source: Statistics Centre - Abu Dhabi * Pump price of gasoline E-Plus 94 Statistical Yearbook of Abu Dhabi 2018
95 2.7.3 External Road Details, 2016 (length in km) Length Region Abu Dhabi Al Ain Al Dhafra Total 1Lanex , ,852 2Lanesx ,315 2,771 4,856 3Lanesx ,906 4Lanesx2 1, ,288 5Lanesx Source: Department of Transport Note: The length of the road is multiplied by the number of lanes External Road Details, 2017 (length in km) Length Region Abu Dhabi Al Ain Al Dhafra Total 1Lanex , ,852 2Lanesx ,315 2,771 4,856 3Lanesx ,906 4Lanesx2 1, ,288 5Lanesx Source: Department of Transport Note: The length of the road is multiplied by the number of lanes Length of Internal Roads (length in km) Region Total 18,219 18,549 19,443 19,512 Abu Dhabi Region 13,200* 13,528 14,497 14,552 Al Ain Region 2,115 2,115 2,115 2,115 Al Dhafra Region 2,904 2,906 2,831 2,845 Source: Department of Urban Planning and Municipalities, Abu Dhabi city Municipality - Al Ain city -Al Dhafra Region Note: The length of the road is multiplied by the number of lanes * Preliminary estimates Statistical Yearbook of Abu Dhabi
96 2.7.6 Aircraft Movement by Airport and Month Airport / Month Abu Dhabi international airport* 186, , , ,543 January 14,905 14,117 14,233 14,190 February 14,058 12,807 13,092 12,754 March 15,333 14,414 14,117 13,959 April 15,056 13,982 13,718 13,249 May 15,790 14,447 14,137 13,238 June 15,492 14,117 13,538 12,272 July 15,400 14,689 14,478 12,871 August 15,672 14,964 14,681 13,091 September 15,747 14,130 14,201 12,364 October 16,146 14,304 14,402 12,247 November 15,922 13,753 13,853 12,063 December 16,686 14,265 14,085 12,245 Al Ain international airport 26,993 24,579 25,749 29,797 January 3,304 1,534 2,069 2,059 February 3,423 2,019 2,082 2,465 March 2,523 2,376 1,634 2,865 April 2,887 2,749 2,640 3,282 May 2,329 2,884 2,086 2,627 June 2,464 2,420 2,291 2,047 July 2,406 2,038 1,982 2,300 August 3,376 2,118 2,391 2,731 September 2,578 1,656 2,550 2,464 October 341 1,435 2,193 2,439 November 485 1,575 1,728 2,451 December 877 1,775 2,103 2,067 Source: Abu Dhabi Airports Company * Abu Dhabi International Airport figures include Al Bateen excutive Airport 96 Statistical Yearbook of Abu Dhabi 2018
97 2.7.7 Air Transport by Airport, Passengers and Freights Item Abu Dhabi international airport* Aircraft Movement 186, , , ,543 Passengers: Arrival 9,797,879 11,564,563 12,139,014 11,678,045 Departure 9,782,403 11,558,557 12,213,371 11,717,679 Transit 284, , ,734 25,869 Freights (tons): In 431, , , ,574 Out 365, , , ,716 Mail (tons): In 3,093 3,975 5,433 6,973 Out 5,907 6,113 7,847 7,651 Al Ain international airport Aircraft Movement 26,993 24,579 25,749 29,797 Passengers: Arrival 22,718 25,992 34,579 62,341 Departure 19,652 23,746 30,640 51,709 Transit 27,179 11,443 31,460 22,469 Freights (tons): In Out Mail (tons): In Out Source: Abu Dhabi Airports Company * Abu Dhabi International Airport figures include Al Bateen Excutive Airport Statistical Yearbook of Abu Dhabi
98 2.7.8 Air Cargo Discharged by Region (Tons) Region Total 431, , , ,574 GCC countries 11,053 9,787 8,848 8,588 Other Arab countries 9,700 12,453 14,902 13,495 Asia (except Arab) 205, , , ,804 Europe 146, , , ,166 North America 17,893 20,102 16,511 17,416 South America 5,005 3,487 3, Africa (except Arab) 17,031 16,611 15,965 19,782 Australia 17,850 13,387 19,356 21,379 Others Source: Abu Dhabi Airports Company Note: Data Abu Dhabi international airport only / Data exclude passengers baggage, diplomatic cargo and aircraft store Air Cargo Loaded by Region of Destination (Tons) Region Total 365, , , ,716 GCC countries 45,286 43,114 40,565 32,200 Other Arab countries 15,058 14,096 17,191 15,033 Asia (except Arab) 106, , , ,416 Europe 139, , , ,342 North America 16,737 15,329 14,000 15,461 South America 2,129 1,797 1, Africa (except Arab) 28,427 28,043 21,541 16,183 Australia 12,975 11,853 11,790 12,904 Others Source: Abu Dhabi Airports Company Note: Data Abu Dhabi international airport only / Data exclude passengers baggage, diplomatic cargo and aircraft store 98 Statistical Yearbook of Abu Dhabi 2018
99 Air Passengers Arrivals by Region of Embarkation Region Total 9,797,879 11,564,563 12,139,014 11,678,045 GCC countries 1,652,283 1,753,222 1,805,190 1,529,150 Other Arab countries 574, , , ,680 Asia (except Arab) 4,009,320 4,839,961 5,114,609 4,995,176 Europe 2,324,205 2,825,223 2,852,072 2,851,746 North America 471, , , ,836 South America 75,213 72,579 89,781 25,012 Africa (except Arab) 270, , , ,123 Australia 418, , , ,415 Others 2,708 3,541 4,367 4,907 Source: Abu Dhabi Airports Company Note: Data Abu Dhabi international airport only / Data exclude transit passengers who continued their journey on the same flight Statistical Yearbook of Abu Dhabi
100 Air Passengers Departures by Region of Disembarkation Region Total 9,782,403 11,558,557 12,213,371 11,717,679 GCC countries 1,723,745 1,839,812 1,909,195 1,543,583 Other Arab countries 559, , , ,669 Asia (except Arab) 3,942,482 4,628,598 4,956,530 4,927,300 Europe 2,359,144 2,917,315 2,947,608 2,934,192 North America 478, , , ,497 South America 76,390 76,815 90,026 24,573 Africa (Except Arab) 242, , , ,693 Australia 397, , , ,026 Others 2,815 3,689 4,288 5,146 Source: Abu Dhabi Airports Company Note: Data Abu Dhabi international airport only / Data exclude transit passengers who continued their journey on the same flight 100 Statistical Yearbook of Abu Dhabi 2018
101 Main Indicators for Goods Vessels Movement Item Number of vessels 40,762 41,645 40,548 36,299 Container TEUs* Total TEUs 1,137,679 1,504,293 1,531,384 1,400,436 Discharged 568, , , ,260 Loaded 569, , , ,176 General cargo (metric tons) Total cargo 12,804,248 15,292,840 17,825,624 18,568,887 Discharged 11,901,968 14,339,966 16,731,767 17,632,183 Loaded 902, ,874 1,093, ,704 Vehicle unit Total units 106, , , ,247 Discharged 105, , , ,490 Loaded ,721 14,611 13,757 Source: Abu Dhabi Port Company * Twenty- foot Equivalent Unit (TEU) Vessels Turnaround in Abu Dhabi ports 2017 Item Zayed Port Khalifa Port Number of vessels 817 1,482 Total turnaround (Hours)* 1,282 1,639 Average turnaround 1:35 1:06 Total stay (Hours)* 2,801 4,611 Total gross tonnage (M.T) 18,328,290 59,200,996 Source: Abu Dhabi Port Company * Note: There is difference in the methodology calculation in 2017 compared with previous years from the source. Statistical Yearbook of Abu Dhabi
102 Distribution of Container TEUs Incoming and Outgoing by Region Region Incoming Outgoing Incoming Outgoing Total 761, , , ,176 United Arab Emirates* 530, , , ,061 Other GCC Countries 76,727 22, ,935 28,855 Total Middle East (Non- GCC) 37,963 11,688 30,242 11,048 Indian Sub Continent 9,154 26,873 13,750 28,743 South East Asia 17,864 83,556 14,444 63,760 Far East 53, ,575 57, ,502 North Africa 3,727 7,777 3,748 9,396 South Africa East Africa 4,569 2,420 3,049 3,191 West Africa Western Europe Mediterranean 24,134 7,677 12,724 7,198 Scandinavia Eastern Europe North America Caribbean Central America South America Australasia Others 2,563 5,727 7,930 2,417 Source: Abu Dhabi Port Company * Containers TEUs of UAE are from other emirates of UAE 102 Statistical Yearbook of Abu Dhabi 2018
103 Post Offices and Mail Boxes Item Number of post offices Number of mail boxes for private and Corporate 144, , ,684 Number of mail boxes for public Source: Emirates Post Postal Traffic by Type Postal Traffic Registered letters Internal 1,317,036 1,023, ,778 External outgoing 73,229 65,189 52,166 External incoming 225, , ,062 Parcels Internal External outgoing 47,989 45,493 40,898 External incoming 33,449 33,922 31,039 Express mail Internal 17,973 18,874 20,740 External outgoing 61,508 62,570 31,784 External incoming 63,352 57,006 57,105 Source: Emirates Post Statistical Yearbook of Abu Dhabi
104 2.8. Information and Communication Technology In order to keep pace with information technology advancement, the Abu Dhabi Government launched an ambitious national strategy, which will enhance the Information and Communication Technology (ICT) infrastructure. It will also encourage both local and foreign investment in the area of advanced technologies. Abu Dhabi is striving to achieve a knowledge-based economy by deploying advanced technologies throughout the Emirate. Given the increasing importance of efficient ICT in all areas of life, Statistics Centre - Abu Dhabi is keen to publish these most essential ICT statistics and indicators for the Emirate of Abu Dhabi. Fixed broadband subscribers per 100 inhabitants amounted to 12, and the Fixed telephone subscribers per 100 inhabitants totaled 15 in Key Statistics of Information and Communication Technology Indicators * Share in GDP at current prices (% ) Share in non-oil GDP at current prices (% ) Gross output (% of GDP at current prices) Capital formation (% of GDP at current prices) Compensation of employees (Million AED) 5,161 5,518 4,857 5,037 Source: Statistics Centre - Abu Dhabi * Preliminary estimates The Information and Communication Technology Indicators Indicators Fixed broadband subscribers per 100 inhabitants Fixed telephone subscribers per 100 inhabitants Mobile cellular subscribers per 100 inhabitants Percentage of population covered by mobile network Source: Telecommunications Regulatory Authority 104 Statistical Yearbook of Abu Dhabi 2018
105 2.8.3 Tariff of Telecommunications Services (AED/Month) Type of Services Tariff Consumer fixed broadband internet access tariff (256 kbps) Business fixed broadband internet access tariff (512 kbps) * 465* Fixed line telephone tariff: Home user Business user Mobile cellular prepaid tariff (100 minutes/month) Source: Telecommunications Regulatory Authority * (4 Mbps) Statistical Yearbook of Abu Dhabi
106
107 2.9.3 Hotel Establishments Indicators by Region, 2017 Item Abu Dhabi Region Al Ain Region Al Dhafra Region Total Number of hotel establishments Number of hotel rooms 27,117 2,562 1,203 30,882 Number of guests (Thousand) 4, ,888 Number of guest nights (Thousand) 11, ,293 Average length of stay (nights) Occupancy rate (%) Source: Department of Culture and Tourism Guests of Hotel Establishments by Nationality Nationality Total 3,494,063 4,105,846 4,440,314 4,888,252 United Arab Emirates 1,152,085 1,379,589 1,462,015 1,499,220 Other GCC countries 240, , , ,681 Other Arab countries 389, , , ,307 Asia (except Arab) 723, ,425 1,051,732 1,243,047 Australia and Pacific 57, ,701 60,377 63,952 Africa (except Arab) 53, ,845 64,847 74,195 Europe 651,804 60, , ,162 North and South America 185,023 64, , ,638 Not Specified 40,831 66,865 50,567 62,050 Source: Department of Culture and Tourism Statistical Yearbook of Abu Dhabi
108 2.9.5 Guestnights of Hotel Establishments by Nationality Nationality Total 10,463,137 12,243,096 12,031,567 12,292,916 United Arab Emirates 2,639,751 3,788,032 3,228,614 3,105,373 Other GCC countries 529, , , ,855 Other Arab countries 1,020,839 1,135,386 1,322,513 1,340,158 Asia (except Arab) 2,166,878 2,331,090 2,544,572 2,593,556 Australia and Pacific 192,480 2,910, , ,194 Africa (except Arab) 169, , , ,045 Europe 2,800, ,807 2,923,512 3,226,206 North and South America 842, , , ,744 Not Specified 101, , , ,785 Source: Department of Culture and Tourism Guests of Hotel Establishments by Nationality and Classification, 2017 Nationality 5- stars 4- stars 3- stars or Hotel less* Apartments Total Total 2,014,245 1,576, , ,504 4,888,252 United Arab Emirates 686, , , ,226 1,499,220 Other GCC countries 120,325 79,961 46,647 37, ,681 Other Arab countries 149, , ,118 64, ,307 Asia (except Arab) 432, , , ,176 1,243,047 Australia and Pacific 27,253 19,265 11,978 5,456 63,952 Africa (except Arab) 19,082 25,163 19,859 10,091 74,195 Europe 444, ,015 95,821 61, ,162 North and South America 114,165 87,988 31,269 25, ,638 Not Specified 21,473 20,020 12,683 7,874 62,050 Source: Department of Culture and Tourism * Includes: 3, 2 and 1 stars hotel establishments 108 Statistical Yearbook of Abu Dhabi 2018
109 2.9.7 Guestnights for Hotel Establishments by Nationality and Classification, 2017 Nationality 5- stars 4- stars 3- stars or Hotel less* Apartments Total Total 4,888,229 3,098,374 1,752,779 2,553,534 12,292,916 United Arab Emirates 1,368, , , ,499 3,105,373 Other GCC countries 266, ,216 81,711 98, ,855 Other Arab countries 326, , , ,969 1,340,158 Asia (except Arab) 705, , , ,248 2,593,556 Australia and Pacific 64,058 44,144 22,841 44, ,194 Africa (except Arab) 53,833 54,983 46,973 52, ,045 Europe 1,681, , , ,002 3,226,206 North and South America 360, ,171 75, , ,744 Not Specified 62,176 20,352 21,517 32, ,785 Source: Department of Culture and Tourism * Includes:3, 2 and 1 stars hotel establishments Average Length of Stay for Hotel Establishments by Nationality Nationality Difference Average United Arab Emirates Other GCC countries Other Arab countries Asia (except Arab) Australia and Pacific Africa (except Arab) Europe North and South America Not Specified Source: Statistics Centre-Abu Dhabi, Department of Culture and Tourism Statistical Yearbook of Abu Dhabi
110 2.9.9 Occupancy Rate of Hotel Establishments by Month Month Average January February March April May June July August September October November December Source: Department of Culture and Tourism Total Revenue of Hotel Establishments (Thousand AED) Item Total revenue 6,284,414 6,624,260 6,032,722 5,619,501 Room revenue 3,264,862 3,488,243 3,159,557 2,940,764 Food & beverage revenue 2,339,341 2,321,950 2,099,201 1,968,783 Other revenue 680, , , ,953 Source: Department of Culture and Tourism Figure Total Revenue of Hotel Establishments 6,800,000 6,600,000 6,400,000 6,200,000 6,000,000 5,800,000 5,600,000 5,400, Source: Department of Culture and Tourism 110 Statistical Yearbook of Abu Dhabi 2018

111

112 3. Population and Demography Population Births and Deaths Marriage and Divorce Statistical Yearbook of Abu Dhabi
113 , 2016, 2016, , 2017, , , , , , ,
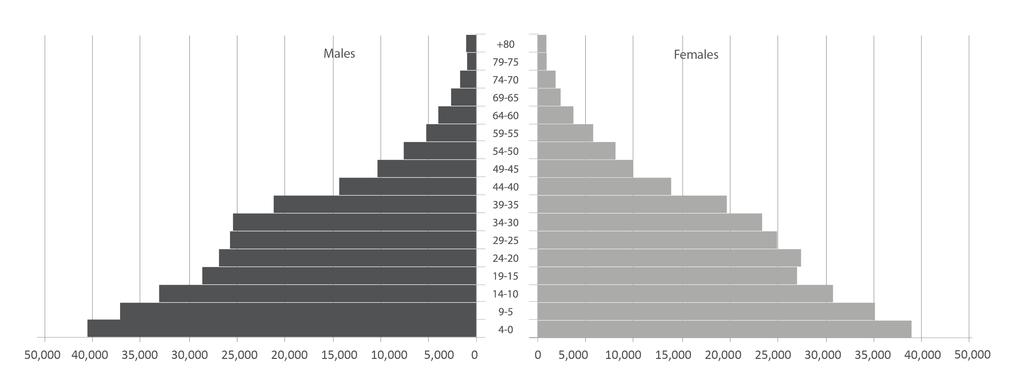
114
115
116
117
118
119
120
121
122
123
124
125
126
127
128
129
130
131
132
133
134
135
136
137
138
139
140
141
142
143 143
144 144
145 145
146 146
147 147
148 148
149 149
150 150
151 151
152 152
153 153
154 154
155 155
156 156
157 157
158 158
159 159
160 160
161

162 4. Social Education Health Social Welfare Culture and Heritage
163 4. Social Social development represents a signi cant objective and driving motivation behind policies and initiatives pursued by Abu Dhabi government. Key elements of the Emirate's vision for the social development describe a society characterized by the provision of worldclass healthcare, education and other services that lead to a safe and secure society and the preservation of cultural heritage of Abu Dhabi, where individuals are valued and their unique skills and contributions are ethically leveraged toward achieving a better quality of life for all. This chapter provides a range of statistics that demonstrate progress towards positive outcomes in education, health, social welfare and culture and heritage Schools 441 Pupils 373,586 Pupils per Teacher 13.9 Hospital 60 Physicians per 1000 populations 3.3 Visitors of Museums 505,345 Benefits of Social Aid Paid (million AED) Statistical Yearbook of Abu Dhabi
164
165 2017 Government Education Schools 250 Classrooms 5,707 Pupils Teachers 11,430 Administrators 3,973 Private Education Schools 191 Classrooms 11,005 Pupils 241,488 Teachers 15,523 Administrators 8,172 Total Education Pupils per teacher 13.9 Pupils per classroom 22.4 Gross Enrollment ratio, first cycle ( 5 years primary education stage) 98.8 Figure Number of Schools by Region and Sector, Abu Dhabi Region Al Ain Region Al Dhafra Region. Government Education. Private Education Source: Statistics Centre - Abu Dhabi, Department of Education and Knowledge Statistical Yearbook of Abu Dhabi
166 4.1.1 Government and Private Schools by Educational Stage, Stage Government Private Total Total Kindergarten Cycle Cycle Secondary Multi-Stage Source: Department of Education and Knowledge Higher Education Institutions by Type and Sector Type Total Government Private Source: Department of Education and Knowledge Government and Private Classrooms by Educational Stage, Stage Government Private Total Total 5,707 11,005 16,712 Kindergarten 829 2,094 2,923 Cycle1 2,132 4,422 6,554 Cycle2 1,551 2,825 4,376 Secondary 1,195 1,664 2,859 Source: Department of Education and Knowledge 168 Statistical Yearbook of Abu Dhabi 2018
167 4.1.4 Government and Private Pupils by Educational Stage, Stage Government Private Total Total 132, , ,586 Kindergarten 18,769 44,824 63,593 Cycle1 47, , ,837 Cycle2 39,525 60, ,493 Secondary 26,075 30,588 56,663 Source: Department of Education and Knowledge Schools, Classrooms, pupils, Teachers and Administrators in Government and Private Education* Item Total Education Schools Classrooms 13,528 14,879 16,004 17,118 16,712 Pupils 306, , , , ,586 Teachers 22,218 23,339 23,571 23,745 26,953 Administrators 8,107 8,827 10,171 10,265 12,145 Government Education Schools Classrooms 5,618 5,399 5,511 5,646 5,707 Pupils 125, , , , ,098 Teachers 11,384 10,993 11,288 11,786 11,430 Administrators 2,201 2,336 3,665 3,872 3,973 Private Education Schools Classrooms 7,910 9,480 10,493 11,472 11,005 Pupils 180, , , , ,488 Teachers 10,834 12,346 12,283 11,959 15,523 Administrators 5,906 6,491 6,506 6,393 8,172 Source: Department of Education and Knowledge * Table comprises all stages Statistical Yearbook of Abu Dhabi
168 4.1.6 Pupils, Teachers and Administrators by Region,Gender and Sector, * Region,Gender and Sector Pupils Teachers Administrators Total Education Abu Dhabi Emirate 373,586 26,953 12,145 Males 190,378 6,505 4,389 Females 183,208 20,448 7,756 Abu Dhabi Region 234,197 15,842 6,921 Males 119,305 3,511 2,649 Females 114,892 12,331 4,272 Al Ain Region 119,677 9,302 4,449 Males 60,916 2,433 1,521 Females 58,761 6,869 2,928 Al Dhafra Region 19,712 1, Males 10, Females 9,555 1, Government Education Abu Dhabi Emirate 132,098 11,430 3,973 Males 63,002 3, Females 69,096 8,051 3,026 Abu Dhabi Region 66,447 5,287 1,853 Males 31,835 1, Females 34,612 3,749 1,393 Al Ain Region 55,872 5,049 1,768 Males 26,401 1, Females 29,471 3,575 1,375 Al Dhafra Region 9,779 1, Males 4, Females 5, Private Education Abu Dhabi Emirate 241,488 15,523 8,172 Males 127,376 3,126 3,442 Females 114,112 12,397 4,730 Abu Dhabi Region 167,750 10,555 5,068 Males 87,470 1,973 2,189 Females 80,280 8,582 2,879 Al Ain Region 63,805 4,253 2,681 Males 34, ,128 Females 29,290 3,294 1,553 Al Dhafra Region 9, Males 5, Females 4, Source: Department of Education and Knowledge * Table comprises all stages 170 Statistical Yearbook of Abu Dhabi 2018

169 Figure Pupils by Region and Gender in Government and Private Education, , , ,000 80,000 60,000 40,000 20,000 0 Abu Dhabi Region Al Ain Region Al Dhafra Region Source: Department of Education and Knowledge. Males. Females Figure Pupils, Teachers and Administrators in Government Schools by Region, Statistical Yearbook of Abu Dhabi
170 4.1.7 Pupils in Government and Private Schools by Educational Stage and Gender and Females per 100 Males, Stage Males Females Total Females per 100 Males Total Education 190, , , Kindergarten 32,471 31,122 63, Cycle1 78,560 74, , Cycle2 51,022 49, , Secondary 28,325 28,338 56, Government Education 63,002 69, , Kindergarten 9,254 9,515 18, Cycle1 22,860 24,869 47, Cycle2 18,587 20,938 39, Secondary 12,301 13,774 26, Private Education 127, , , Kindergarten 23,217 21,607 44, Cycle1 55,700 49, , Cycle2 32,435 28,533 60, Secondary 16,024 14,564 30, Source: Statistics Centre - Abu Dhabi, Department of Education and Knowledge 172 Statistical Yearbook of Abu Dhabi 2018
171 4.1.8 Percent of Pupils in Government Schools by Region, Citizenship, Gender and Educational Stage, * (%) Region, Citizenship and Gender Cycle 1 Cycle 2 Secondary Total Abu Dhabi Emirate Males Females Citizens Males Females Non-Citizens Males Females Abu Dhabi Region Males Females Citizens Males Females Non-Citizens Males Females Al Ain Region Males Females Citizens Males Females Non-Citizens Males Females Al Dhafra Region Males Females Citizens Males Females Non-Citizens Males Females Source: Statistics Centre - Abu Dhabi, Department of Education and Knowledge * Excluding Kindergarten Pupils Statistical Yearbook of Abu Dhabi
172 4.1.9 Percent of Pupils in Private Schools by Region, Citizenship, Gender and Educational Stage, * (%) Region, Citizenship and Gender Cycle 1 Cycle 2 Secondary Total Abu Dhabi Emirate Males Females Citizens Males Females Non-Citizens Males Females Abu Dhabi Region Males Females Citizens Males Females Non-Citizens Males Females Al Ain Region Males Females Citizens Males Females Non-Citizens Males Females Al Dhafra Region Males Females Citizens Males Females Non-Citizens Males Females Source: Statistics Centre - Abu Dhabi, Department of Education and Knowledge * Excluding Kindergarten Pupils 174 Statistical Yearbook of Abu Dhabi 2018
173 Ratio of Citizen Pupils to Non-Citizen Pupils by Region and Sector (Citizen Pupils per 100 Non-Citizen Pupils) Region and Sector Total Education Abu Dhabi Region Al Ain Region Al Dhafra Region Government Education Abu Dhabi Region Al Ain Region Al Dhafra Region Private Education Abu Dhabi Region Al Ain Region Al Dhafra Region Source: Statistics Centre - Abu Dhabi, Department of Education and Knowledge Statistical Yearbook of Abu Dhabi
174 The Determined Ones in Government Education by Disability Type and Region, Disability Type Abu Dhabi Al Ain Al Dhafra Region Region Region Total Total 4,674 3, ,382 Learning disabilities 2,379 2, ,798 Visually impaired students Students with hearing disabilities Students of speech and language disorders Students with Physically disabled Students with health problems Emotional behavioral disability Autism spectrum disorders Intellectual disability and mental impairment Other Disabilities Source: Department of Education and Knowledge Teachers by Educational Stage and Gender in Government Education, Stage Males Females Total Total 3,379 8,051 11,430 Kindergarten* 1 1,298 1,299 Cycle ,405 2,810 Cycle ,796 Secondary ,488 Multi-Stage 1,460 2,577 4,037 Source: Department of Education and Knowledge * All Kindergarten teachers are females 176 Statistical Yearbook of Abu Dhabi 2018
175 Teachers by Region, Citizenship, Gender and Educational Stage in Government Education, * Region, Citizenship and Gender Cycle 1 Cycle 2 Secondary Total Abu Dhabi Emirate 2,810 1,796 1,488 6,094 Males ,918 Females 2, ,176 Citizens 1, ,497 Males Females 1, ,227 Non-Citizens 1,571 1, ,597 Males ,648 Females 1, ,949 Abu Dhabi Region 1, ,171 Males ,158 Females 1, ,013 Citizens ,137 Males Females Non-Citizens ,034 Males Females ,067 Al Ain Region 1, ,549 Males Females ,919 Citizens ,296 Males Females ,220 Non-Citizens ,253 Males Females Al Dhafra Region Males Females Citizens Males Females Non-Citizens Males Females Source: Department of Education and Knowledge * Number of teachers does not include teachers in Kindergarten and Multi-Stage schools Statistical Yearbook of Abu Dhabi
176 Teachers by Region,Citizenship and Gender in Private Education, Region and Citizenship Males Females Total Abu Dhabi Emirate 3,126 12,397 15,523 Citizens Non-Citizens 3,126 12,357 15,483 Abu Dhabi Region 1,973 8,582 10,555 Citizens Non-Citizens 1,973 8,566 10,539 Al Ain Region 959 3,294 4,253 Citizens Non-Citizens 959 3,286 4,245 Al Dhafra Region Citizens Non-Citizens Source: Department of Education and Knowledge Number of Pupils per Teacher by Region, Educational Stage and Gender in Government Education, Region and Stage Males Females Total Abu Dhabi Emirate Cycle Cycle Secondary Multi-Stage Abu Dhabi Region - - Cycle Cycle Secondary Multi-Stage Al Ain Region - - Cycle Cycle Secondary Multi-Stage Al Dhafra Region - - Cycle Cycle Secondary Multi-Stage Source: Statistics Centre - Abu Dhabi, Department of Education and Knowledge * In cycle 1, pupils per teacher ratios by gender are not calculated, because of mixed classes, with female teachers. 178 Statistical Yearbook of Abu Dhabi 2018
177 Number of Pupils per Classroom and Number of Teachers per Classroom by Region and Educational Stage in Government Education, * Region and Gender Cycle 1 Cycle 2 Secondary Total Abu Dhabi Emirate Pupils/Classroom Teachers/Classroom Abu Dhabi Region Pupils/Classroom Teachers/Classroom Al Ain Region Pupils/Classroom Teachers/Classroom Al Dhafra Region Pupils/Classroom Teachers/Classroom Source: Statistics Centre - Abu Dhabi, Department of Education and Knowledge * Number of classrooms is not avilable in Multi-stage schools Pupils per Classroom by Region and Educational Stage in Private Education, Region Cycle 1 Cycle 2 Secondary Total Abu Dhabi Emirate Abu Dhabi Region Al Ain Region Al Dhafra Region Source: Statistics Centre - Abu Dhabi, Department of Education and Knowledge Statistical Yearbook of Abu Dhabi
178 Pupils per Teacher and Number of Teachers per Classroom by Region in Private Education, Region Pupils per Teacher Teachers per Classroom Abu Dhabi Emirate Abu Dhabi Region Al Ain Region Al Dhafra Region Source: Statistics Centre - Abu Dhabi, Department of Education and Knowledge Figure Percentage Distribution of Pupils by Sector & Stage, Kg Cycle 1 Cycle 2 Secondary. Government Education. Private Education Source: Statistics Centre - Abu Dhabi, Department of Education and Knowledge 180 Statistical Yearbook of Abu Dhabi 2018
179 Educational Enrollment Ratios Gross Enrollment Ratio by Educational Stage and Gender, Stage Males Females Total Kindergarten Grade Cycle Cycle Secondary Source: Statistics Centre - Abu Dhabi Percent of Pupils Enrolled in Private Education to All Pupils by Region* (%) Region Abu Dhabi Emirate Abu Dhabi Region Al Ain Region Al Dhafra Region Source: Statistics Centre - Abu Dhabi * Table comprises all stages Statistical Yearbook of Abu Dhabi
180 Progression Percent of Progression to Secondary School by Gender, Stage Males Females Both Genders Class 10 ( ) 10,726 10,634 21,360 Class 9 ( ) 11,242 10,994 22,236 % Source: Department of Education and Knowledge, Statistics Center- Abu Dhabi Adult Education Literacy Centres, Adult Education and Home Schooling by Type Centers Total Family Development Centres Home Schooling Source: Department of Education and Knowledge Literacy Centres, Adult Education and Home Schooling by Region and Gender Region and Gender Abu Dhabi Emirate Males Females Abu Dhabi Region Males Females Al Ain Region Males Females Al Dhafra Region Males Females Source: Department of Education and Knowledge 182 Statistical Yearbook of Abu Dhabi 2018
181 Pupils in Literacy Centres and Adult Education by Region, Citizenship, Gender and Stage, Region, Citizenship and Gender Cycle 1 Cycle 2 Secondary Total Abu Dhabi Emirate 1, ,005 4,419 Males ,046 1,712 Females 1, ,707 Citizens ,647 2,948 Males ,278 Females ,670 Non-Citizens ,471 Males Females ,037 Abu Dhabi Region ,084 Males Females ,317 Citizens ,390 Males Females Non-Citizens Males Females Al Ain Region ,804 Males Females ,117 Citizens ,170 Males Females Non-Citizens Males Females Al Dhafra Region Males Females Citizens Males Females Non-Citizens Males Females Source: Department of Education and Knowledge Statistical Yearbook of Abu Dhabi
182 Pupils in Home Schooling by Region, Citizenship, Gender and Stage, Region, Citizenship and Gender Cycle 2 Secondary Total Abu Dhabi Emirate 745 2,888 3,633 Males 432 1,845 2,277 Females 313 1,043 1,356 Citizens 465 2,274 2,739 Males 329 1,549 1,878 Females Non-Citizens Males Females Abu Dhabi Region 375 1,412 1,787 Males ,051 Females Citizens 221 1,067 1,288 Males Females Non-Citizens Males Females Al Ain Region 308 1,345 1,653 Males ,108 Females Citizens 210 1,112 1,322 Males Females Non-Citizens Males Females Al Dhafra Region Males Females Citizens Males Females Non-Citizens Males Females Source: Department of Education and Knowledge 184 Statistical Yearbook of Abu Dhabi 2018
183 Teachers in Literacy Centres and Adult Education by Region, Citizenship and Gender Region,Citizenship and Gender Abu Dhabi Emirate Males Females Citizens Males Females Non-Citizens Males Females Abu Dhabi Region Males Females Citizens Males Females Non-Citizens Males Females Al Ain Region Males Females Citizens Males Females Non-Citizens Males Females Al Dhafra Region Males Females Citizens Males Females Non-Citizens Males Females Source: Department of Education and Knowledge Statistical Yearbook of Abu Dhabi
184 Educational Attainment Higher Education Students by Citizenship, Sector and Gender, Citizenship and Sector Males Females Total Grand Total 18,246 33,789 52,035 Government 11,001 25,554 36,555 Private 7,245 8,235 15,480 Citizens 12,322 25,727 38,049 Government 8,655 22,278 30,933 Private 3,667 3,449 7,116 Non-Citizens 5,924 8,062 13,986 Government 2,346 3,276 5,622 Private 3,578 4,786 8,364 Source: Sources: Department of Education and Knowledge Higher Education Graduates by Citizenship, Sector and Gender, Citizenship and Sector Males Females Total Grand Total 2,582 5,500 8,082 Government 1,634 3,645 5,279 Private 948 1,855 2,803 Citizens 1,615 3,275 4,890 Government 1,072 2,810 3,882 Private ,008 Non-Citizens 967 2,225 3,192 Government ,397 Private 405 1,390 1,795 Source: Sources: Department of Education and Knowledge 186 Statistical Yearbook of Abu Dhabi 2018
185 Illiteracy Rate Among Population (10 years and above) by Citizenship and Gender (%) Citizenship and Gender Grand Total Males Females Citizens Males Females Non-Citizens Males Females Source: Statistics Centre - Abu Dhabi Literacy Rate Among Population (10 years and above) by Citizenship and Gender (%) Citizenship and Gender Grand Total Males Females Citizens Males Females Non-Citizens Males Females Source: Statistics Centre - Abu Dhabi Statistical Yearbook of Abu Dhabi
186 Illiteracy Rate Among Youth Population (15-24 years) by Citizenship and Gender (%) Citizenship and Gender Grand Total Males Females Citizens Males Females Non-Citizens Males Females Source: Statistics Centre - Abu Dhabi Literacy Rate Among Youth Population (15-24 years) by Citizenship and Gender (%) Citizenship and Gender Grand Total Males Females Citizens Males Females Non-Citizens Males Females Source: Statistics Centre - Abu Dhabi 188 Statistical Yearbook of Abu Dhabi 2018
187 Percentage Distribution of Population (10 years and over) by Education Attainment and Gender, 2017 Education Attainment Males Females Total Total Less than primary Primary Lower Secondary Upper Secondary Post-secondary Bachelor Higher Education Unknown Source: Statistics Centre - Abu Dhabi Percentage Distribution of Citizens Population ( 10 years and over) by Education Attainment and Gender, 2017 Education Attainment Males Females Total Total Less than primary Primary Lower Secondary Upper Secondary Post-secondary Bachelor Higher Education Unknown Source: Statistics Centre - Abu Dhabi Statistical Yearbook of Abu Dhabi
188 Percentage Distribution of Estimated Non-Citizens Population (10 years and over) by Education Attainment and Gender, 2017 Education Attainment Males Females Total Total Less than primary Primary Lower Secondary Upper Secondary Post-secondary Bachelor Higher Education Unknown Source: Statistics Centre - Abu Dhabi 190 Statistical Yearbook of Abu Dhabi 2018
189 4.2. Health Health services in Abu Dhabi have experienced remarkable expansion and transformation over past years. This is most evident in the signi cant rise in the number of hospitals and other health facilities over this period. The number of hospitals grew to 60 in 2017, including new private hospitals opened in the region of Abu Dhabi. In general, the Emirate has also witnessed a remarkable increase in the number of health centres and clinics. In 2017, there were 3.3 physicians per 1000 population, 9.5 nurses per 1000 population and 1.9 beds per 1000 population. Physicians per 1000 populations 3.3 Beds per 1000 populations 1.9 Nurses per 1000 population 9.5 Hospitals Hospital Beds 5,536 Health centres 944 Clinics 700 Pharmacies 802 Physicians 9,444 Nurses 27,568 Figure Health Establishments by Type and Region, Abu Dhabi Region Al Ain Region Al Dhafra Region. Hospitals. Health Centre. Clinics Source: Statistics Centre - Abu Dhabi, Department of Health -Abu Dhabi Statistical Yearbook of Abu Dhabi
190 4.2.1 Summary of Government Health Statistics Details * Hospitals Beds 2,475 2,507 2,952 2,981 2,914 Patients Admitted 96, , , , ,297 Doctors 2,072 2,508 2,534 2,506 2,549 Out - Patients 2,376,100 2,469,683 2,704,000 2,830,825 2,614,916 Source: Department of Health -Abu Dhabi * Preliminary Data Hospitals by Region and Sector Region and Sector ** Abu Dhabi Emirate Government Private Military* Abu Dhabi Region Government Private Military* Al Ain Region Government Private Military* Al Dhafra Region Government Private Military* Source: Department of Health -Abu Dhabi * Military Hospitals are excluded from 2014 ** Preliminary Data 192 Statistical Yearbook of Abu Dhabi 2018
191 4.2.3 Health Establishments by Type and Region Region * Abu Dhabi Emirate Hospitals Health Centres Clinics Abu Dhabi Region Hospitals Health Centres Clinics Al Ain Region Hospitals Health Centres Clinics Al Dhafra Region Hospitals Health Centres Clinics Source: Department of Health -Abu Dhabi * Preliminary Data Statistical Yearbook of Abu Dhabi
192 4.2.4 Death Rate (Per 100,000 Population) by Causes of Death, 2017* Causes of Death Rate Diseases of the Circulatory System 41.4 External Causes of Morbidity and Mortality 16.3 Neoplasms 18.1 Diseases of the respiratory System 6.0 Certain conditions originating in the prenatal period 4.9 Certain Infectious and Parasitic Diseases 3.9 Injury, Poisoning and certain other consequences of external causes 3.1 Diseases of the digestive system 3.1 Symptoms, signs and abnormal clinical and laboratory findings not elsewhere classified 3.6 Congenital Malformations, Deformations and Chromosomal 2.7 Endocrine, Nutritional and Metabolic diseases 2.1 Diseases of the genitourinary system 2.1 Diseases of the nervous system 1.6 Diseases of the musculoskeletal system and connective tissues 0.3 Diseases of the blood and blood - forming organs and certain disorders involving the immune mechanism 0.6 Factors influencing health status and contact with health services 0.3 Pregnancy, childbirth and the puerperoum 0.1 Diseases of the skin and subcutaneous tissues 0.1 Mental and behavioral disorders 0.1 NA 2.3 Source: Statistics Centre - Abu Dhabi, Department of Health -Abu Dhabi * Preliminary Data 194 Statistical Yearbook of Abu Dhabi 2018
193 4.2.5 Clinicians Rate (Per 100,000 Population) by Region Region * Abu Dhabi Emirate Physicians Nurses Dentists Abu Dhabi Region Physicians Nurses Dentists Al Ain Region Physicians Nurses Dentists Al Dhafra Region Physicians Nurses Dentists Source: Sources: Department of Health -Abu Dhabi, Statistics Centre - Abu Dhabi * Preliminary Data Statistical Yearbook of Abu Dhabi
194 4.2.6 Notifications of Infectious Diseases Infectious Diseases Total 14,166 14,157 15,981 18,547 24,270 Seasonal Influenza ,499 2,847 6,774 Chickenpox 7,429 4,581 4,660 4,614 4,819 Scabies 654 1,001 1,475 1,579 1,907 Malaria 1,415 2,203 2,415 1,940 1,848 Other Food Poisoning 469 1, ,233 1,392 Viral Hepatitis B ,121 1,139 Viral Hepatitis C Other STIs Pulmonary Tuberculosis Viral Hepatitis A Syphilis Mumps Scarlet Fever Extra Pulmonary Tuberculosis Typhoid Fever Giardia Lambia Gonorrhoea Viral Meningitis Brucellosis Rubella Measles Whooping Cough Acute Encephalitis Other Viral Hepatitis Corona Virus Acute Flaccid Paralysis Tetanus Other 315 1,268 1,874 1,287 1,856 Source: Department of Health -Abu Dhabi 196 Statistical Yearbook of Abu Dhabi 2018
195 4.2.7 Beds and Admissions in Government Hospitals by Region Region * Abu Dhabi Emirate Beds 2,582 2,507 2,952 2,981 2,914 Patients Admitted 86, , , , ,297 Abu Dhabi Region Beds 1,504 1,446 1,864 1,772 1,832 Patients Admitted 48,409 67,640 66,400 69,945 66,022 Al Ain Region Beds Patients Admitted 31,870 42,382 42,100 43,632 42,840 Al Dhafra Region Beds Patients Admitted 5,857 8,356 8,700 9,435 9,435 Source: Department of Health -Abu Dhabi * Preliminary Data Statistical Yearbook of Abu Dhabi
196 4.2.8 Persons Insured by Health Insurance Companies* Insurance Company ** Thiqa 422, , , , ,116 Daman Basic 1,204,418 1,386,448 1,421,899 1,415,009 1,297,694 Enhanced 1,044,734 1,539,298 1,380,119 1,134,822 1,069,676 Source: Department of Health -Abu Dhabi ** Preliminary Data * Some numbers may be inflated, since cancellations are not always excluded. Except Thiqa and Daman Basic, all insurers are considered Enhanced Figure Persons Insured by Insurance Companies 1,800,000 1,600,000 1,400,000 1,200,000 1,000, , , , , Thiqa. Daman Basic. Enhanced Source: Statistics Centre - Abu Dhabi, Department of Health -Abu Dhabi 198 Statistical Yearbook of Abu Dhabi 2018
197 4.3. Social Welfare The social welfare services provided in Abu Dhabi Emirate contributed signi cantly in supporting individuals of the society, the total value of aid provided to citizens was million AED for the year 2017, an increase of3.6% compared with There are 2,219 students enrolled in government and private care centres, of whom 72.4% were citizens and 27.6% were non-citizens in Non-Government Organizations by Type of Activity Type of Activity Total Women Professional Popular Art Cultural and Public Services Humanitarian Services Theatres Foreign Associations Source: Ministry of Community Development Statistical Yearbook of Abu Dhabi
198 4.3.2 Cases and Beneficiaries of Social Aid Offered to Citizens by Reason and Gender, 2017 Reason of Aid Cases Beneficiaries Males Females Males Females Total 3,904 9,793 8,500 16,962 Old Age 1,165 2,865 2,767 6,217 Orphanhood Handicapped 1,448 1,008 1,595 1,198 Illegitimate Health Disability ,867 1,642 Limited Income Widowhood ,482 Abandonment Divorce 0 3, ,043 Never Married Married to Foreigner 0 1, ,453 Prisoner's Families Exceptions Married Students Unemployed for reasons beyond Source: Statistics Centre - Abu Dhabi, Ministry of Community Development 200 Statistical Yearbook of Abu Dhabi 2018
199 Figure Percentage Distribution of Beneficiaries of Social Aid by Reason of Aid, Old Age Orphanhood Handicapped Illegitimate Health Disability Limited Income Widowhood Abandonment Divorce Never Married Married to Foreigner Prisoner's Families Exceptions Unemployed for reasons beyond Source: Statistics Centre - Abu Dhabi, Ministry of Community Development Benefits of Social Aid Paid by Month, 2017 (AED) Month Benefits (AED) Total 884,688,445 January 72,473,737 February 72,692,549 March 73,075,720 April 73,549,991 May 74,014,995 June 73,773,862 July 73,717,907 August 73,828,589 September 74,199,154 October 74,377,798 November 74,577,647 December 74,406,496 Source: Ministry of Community Development Statistical Yearbook of Abu Dhabi
200 4.3.4 Nurseries, Employees and Children in Nurseries Item Number of Nurseries Number of Employees 836 2,205 2,314 2,818 3,139 Number of Children 6,225 11,756 12,456 13,595 15,247 Source: Ministry of Community Development, Department of Education and Knowledge 202 Statistical Yearbook of Abu Dhabi 2018
201 4.3.5 Nurseries, Employees and Children Ratios in Nurseries Item Children per Nursery Children per Employee Employees per Nursery Source: Statistics Centre - Abu Dhabi, Ministry of Community Development, Department of Education and Knowledge Children in Nurseries by Citizenship, Gender and Age Items Citizenship 2,275 12,456 13,595 15,247 Citizens 481 5,185 5,754 7,590 Non-Citizens 1,794 7,227 7,688 7,657 Unknown Gender Males 1,172 6,593 7,152 8,218 Females 1,103 5,863 6,443 7,029 Age Infants 321 2,058 2,319 2,736 Non-Infants 1,954 10,291 11, Source: Ministry of Community Development, Department of Education and Knowledge The determined ones in Government and Private Care Centres by Citizenship and Gender, 2017 Citizenship Males Females Total Total Citizens Non-Citizens Source: Ministry of Community Development Statistical Yearbook of Abu Dhabi
202 4.4. Culture and Heritage The Emirate of Abu Dhabi is endowed with natural and archaeological sites that represent a unique and valuable contribution to the richness of global culture and heritage. All these resources merit special measures to ensure their preservation. As a contribution to cultural enrichment in Abu Dhabi Emirate, the number of books at National Library reached about 380 thousands book in 2017, the number of visitors and borrowers were 55 thousands visitors and 14.3 thousands borrowers in The number of visitors to the museums in Abu Dhabi Emirate increased by more than half million visitors in 2017, especially after the opining of the louver museum. Figure Books Available at National Library by Subject, 2017 Religious Historical Arts Applied Science Pure science General Information Languages Literature Philosophy and Psychology Social Studies 0 20,000 40,000 60,000 80, , ,000 Source: Statistics Centre - Abu Dhabi, Abu Dhabi Tourism & Culture Authority 204 Statistical Yearbook of Abu Dhabi 2018
203 4.4.1 Books Available at National Library by Subject Subject Total 422, , , , ,969 Religious 66,497 22,753 23,951 24,678 29,918 Historical 58,438 33,741 35,147 38,120 35,286 Arts 13,654 1,871 2,015 2,672 9,961 Applied Science 38,114 10,769* 12,523* 14,608* 27,318 Pure science 34, ,151 General Information 27, , , , ,559 Languages 8,113 49,487 50,497 50,664 31,965 Literature 65,351 24,450 27,472 30,069 60,074 Philosophy and Psychology 2,109 12,867 13,130 13,174 8,385 Social Studies 108,739 25,215 26,354 28,446 56,352 Source: Abu Dhabi Tourism & Culture Authority * The number of books is for Pure Science and Applied Science Visitors and Borrowers at the National Library by Gender Item Visitors 135, ,000 94,718 55,015 Males 93,142 98,766-26,023 Females 42,831 41,234-28,992 Borrowers 30,437 10,153 13,699 14,335 Males 20,971 6, Females 9,466 3, Source: Abu Dhabi Tourism & Culture Authority Islamic Facilities by Region, 2017 Item Abu Dhabi Al Ain Al Dhafra Abu Dhabi Region Region Region Emirate Mosques 724 1, ,139 Mosques under construction Quran Memorization Centres Hajj and Umra Campaigns Source: General Authority of Islamic Affairs and Endowments Statistical Yearbook of Abu Dhabi
204 4.4.4 Preachers, Imams and Muezzins by Region, 2017 Item Abu Dhabi Region Al Ain Region Al Dhafra Region Abu Dhabi Emirate Preachers and Imams ,600 Imams who rhetoric ,294 Muezzins Source: General Authority of Islamic Affairs and Endowments Visitors to Zoo, Museums and Public Parks Facilities Total 2,628,486 2,606,494 2,676,280 3,415,738 Zoo 619, , , ,717 Hili Fun City 235, , ,273 Public Parks 1,664,640 1,469,054 1,412,887 1,918,403 Al Ain Museum 53,110 50,834 48,933 46,211 Al Ain Palace Museum 56, , , ,321 Dalma Museum - 2,875 3,325 3,078 Al Jahili Fort Museum - 41,346 40,112 39,374 Qasr Al Muwaiji Museum ,151 16,429 Louvre Museum* ,932 Source: Municipality of Abu Dhabi City, Western Region Municipality,Al Hili Fun City, Al Ain Wildlife park and Resort and Abu Dhabi Tourism & Culture Authority * Started in Number of Live Programs that Broadcasted from Abu Dhabi Radio Station Type of Program Total Religious Cultural News Variety Special and Services Sports Other Source: Abu Dhabi Media Company 206 Statistical Yearbook of Abu Dhabi 2018
205 Figure Percentage Distribution of Number of Live Programs that Broadcasted from Abu Dhabi Radio Station by Type of Program, % 23.3% 44.2% 27.9%. Special and Services. Variety. News. Other Programs Source: Statistics Centre - Abu Dhabi, Abu Dhabi Media Company Statistical Yearbook of Abu Dhabi
206

207 5. Labour Force Labour Force structure Employment Unemployment Outside Labour Force Population and Economic Dependency Ratio
208 5. Labour Force According to estimates based on the labour force survey covering the fourth quarter of 2017, the labour force constitutes 66.1% as a percentage of the total population and 79.8% as a percentage of the population aged 15+. Females made up 25.1% of the total labour force. The economic dependency ratio was of 51.2% 2017 Percentage of Employed to Total Population Aged 15 Years and Above 75.8 Unemployment Rate 5.0 Crude Participation Rate 66.1 Refined Participation Rate 79.8 Females as a percentage of total labour force 25.1 Economic Dependency Ratio Statistical Yearbook of Abu Dhabi 2018

209 5.1. Labour Force Structure The labour force includes employed and unemployed individuals who are aged 15 years and above Data showed that Abu Dhabi Region had the largest share of the labour force with 62.3%, followed by Al Ain Region with 23.3%, and Al Dhafra Region with 14.4%. Data on age structure of the labour force in 2017 indicated that the 30 to 34 years age group accounted for the largest share of the labour force with 21.5%. Re ned Economic Participation Rate by region was highest in the Al Dhafra Region, followed by Abu Dhabi Region and Al Ain Region 90.5%, 79.6% and 74.8%, respectively. Figure Distribution of the population (15 Years and Over) by Economically Active Status, 2017 Statistical Yearbook of Abu Dhabi
210 5.1.1 Labour Force by Economically Active Status and Citizenship, Census Years (Persons) Indicator * Labour Force Citizens Non-Citizens Employed Citizens Non-Citizens Unemployed Citizens Non-Citizens Source: Ministry of Economy, Department of Economic Development and Statistics Centre - Abu Dhabi * 2011 Estimated, all numbers are rounded to the nearest 100 persons, therefore, numbers may not add to totals Average Annual Growth Rates in Labour Force in Intercensal Periods by Citizenship and Gender (%) Citizenship and Gender Grand Total Males Females Citizens Males Females Non-Citizens Males Females Source: Ministry of Economy, Department of Economic Development and Statistics Centre - Abu Dhabi 212 Statistical Yearbook of Abu Dhabi 2018
211 5.1.3 Distribution of Labour Force Estimates (15 Years and Over) by Citizenship, Gender and Region, 2017 (%) Citizenship and Gender Abu Dhabi Region Al Ain Region Al Dhafra Region Abu Dhabi Emirate Grand Total Males Females Citizens Males Females Non-Citizens Males Females Source: Statistics Centre - Abu Dhabi Distribution of Labour Force Estimates (15 Years and Over) by Region, Gender and Economically Active Status, 2017 (%) Region and Gender Labour Force Employed Unemployed Abu Dhabi Emirate Males Females Abu Dhabi Region Males Females Al Ain Region Males Females Al Dhafra Region Males Females Source: Statistics Centre - Abu Dhabi Statistical Yearbook of Abu Dhabi
212 5.1.5 Distribution of Labour Force Estimates (15 Years and Over) by Region, Age Group and Gender, 2017 (%) Age Group and Region Males Females Total Abu Dhabi Emirate Abu Dhabi Region Al Ain Region Al Dhafra Region Source: Statistics Centre - Abu Dhabi 214 Statistical Yearbook of Abu Dhabi 2018
213 5.1.6 Refined Participation Rate by Region, Age Group and Gender, 2017 (%) Age Group and Region Males Females Total Abu Dhabi Emirate Abu Dhabi Region Al Ain Region Al Dhafra Region Source: Statistics Centre - Abu Dhabi Statistical Yearbook of Abu Dhabi
214 5.1.7 Refined Participation Rate For Citizens by Region, Age Group and Gender, 2017 (%) Age Group and Region Males Females Total Abu Dhabi Emirate Abu Dhabi Region Al Ain Region Al Dhafra Region Source: Statistics Centre - Abu Dhabi 216 Statistical Yearbook of Abu Dhabi 2018
215 5.1.8 Refined Participation Rate For Non-Citizens by Region, Age Group and Gender, 2017 (%) Age Group and Region Males Females Total Abu Dhabi Emirate Abu Dhabi Region Al Ain Region Al Dhafra Region Source: Statistics Centre - Abu Dhabi Statistical Yearbook of Abu Dhabi
216 5.2. Employment Labour force estimates indicate that the largest proportion (62.5%) of the employed population was in Abu Dhabi Region. The distribution by employment status revealed that the majority of employed persons in the Emirate of Abu Dhabi were paid employees (98.3%), while 1.2% were ownaccount workers. A distribution by educational attainment, indicates that the largest proportion (21.2%) of the employed population had less than primary education, followed by primary education (19.4%), Among citizen's, a bachelor's degree was most common (39.3%). A classi cation by main occupation indicates that Elementary occupations had the largest percentage of the employed population with 25.6%, followed by Professionals with 17.1%. Among employed citizens, Professionals accounted for the largest share, making up 37.9% of this segment, while the largest share (28.0%) of employed non-citizens was in the Elementary occupations. The largest proportion of the employed population was in the 'Activities of households as employers undifferentiated goods and services activity' with 25.1%, followed by Construction activity with 20.2%. 'Public administration and defense'; Compulsory Social security activities accounted for the largest proportion (60.2%) of employed citizens, while 'Activities of households as employers undifferentiated goods and services' activity accounted for the largest proportion (27.5%) of employed non-citizens. As labour force data indicates, the private sector engaged the largest proportion (53.0%) of the employed population, while 16.3% worked for the government sector. As for employed citizen, 86.8% worked in the government sector and 5.5% in the private sector. Labour Force Survey data also showed that the majority of the employed in the Emirate of Abu Dhabi are married (74.3%), while 24.0% of the employed never married. The survey data also showed that 57.8% of the total employed population in the Emirate of Abu Dhabi were working more than 48 hours per week. 218 Statistical Yearbook of Abu Dhabi 2018
217 5.2.1 Distribution of Employed Population Estimates (15 Years and Over) by Region, Age Group and Gender, 2017 (%) Region and Age Group Males Females Total Abu Dhabi Emirate Abu Dhabi Region Al Ain Region Al Dhafra Region Source: Statistics Centre - Abu Dhabi Statistical Yearbook of Abu Dhabi
218 5.2.2 Distribution of Employed Population Estimates (15 Years and Over) by Citizenship, Work Status and Gender, 2017 (%) Citizenship and Work Status Males Females Total Grand Total Employer Own-account worker Paid employee Family Employed for Pay or Profit Unknown Citizens Employer Own-account worker Paid employee Family Employed for Pay or Profit Unknown Non-Citizens Employer Own-account worker Paid employee Family Employed for Pay or Profit Unknown Source: Statistics Centre - Abu Dhabi 220 Statistical Yearbook of Abu Dhabi 2018
219 5.2.3 Distribution of Employed Population Estimates (15 Years and Over) by Citizenship, Educational Attainment and Gender, 2017 (%) Citizenship and Educational Attainment Males Females Total Grand Total Less than primary Primary Lower Secondary Upper Secondary Post-secondary Bachelor or equivalent Higher Education Not Stated Citizens Less than primary Primary Lower Secondary Upper Secondary Post-secondary Bachelor or equivalent Higher Education Not Stated Non-Citizens Less than primary Primary Lower Secondary Upper Secondary Post-secondary Bachelor or equivalent Higher Education Not Stated Source: Statistics Centre - Abu Dhabi Statistical Yearbook of Abu Dhabi
220 Figure Percentage Distribution of Employed Population Estimates (15 Years and Over) by Main Occupation, Manager 11.1% 0.3% 25.6% 13.7% Source: Statistics Centre - Abu Dhabi 10.2% 5.1% 17.1% 1.5% 12.2% 3.1%. Professional. Technician or Associate professional. Clerical support worker. Service or sales worker. Agricultural, forestry or fishery worker. Craft or related trades. Plant or machine operator. Elementary occupation. Not Stated 222 Statistical Yearbook of Abu Dhabi 2018
221 5.2.4 Distribution of Employed Population Estimates (15 Years and Over) by Citizenship, Main Occupation and Gender, 2017 (%) Citizenship and Main Occupation Males Females Total Grand Total Manager Professional Technician or Associate professional Clerical support worker Service or sales worker Agricultural, forestry or fishery worker Craft or related trades Plant or machine operator Elementary occupation Not Stated Citizens Manager Professional Technician or Associate professional Clerical support worker Service or sales worker Agricultural, forestry or fishery worker Craft or related trades Plant or machine operator Elementary occupation Not Stated Non-Citizens Manager Professional Technician or Associate professional Clerical support worker Service or sales worker Agricultural, forestry or fishery worker Craft or related trades Plant or machine operator Elementary occupation Not Stated Source: Statistics Centre - Abu Dhabi Statistical Yearbook of Abu Dhabi
222 5.2.5 Distribution of Employed Population Estimates (15 Years and Over) by Citizenship, Main Occupation and Gender, Abu Dhabi Region, 2017 (%) Citizenship and Main Occupation Males Females Total Grand Total Manager Professional Technician or Associate professional Clerical support worker Service or sales worker Agricultural, forestry or fishery worker Craft or related trades Plant or machine operator Elementary occupation Not Stated Citizens Manager Professional Technician or Associate professional Clerical support worker Service or sales worker Agricultural, forestry or fishery worker Craft or related trades Plant or machine operator Elementary occupation Not Stated Non-Citizens Manager Professional Technician or Associate professional Clerical support worker Service or sales worker Agricultural, forestry or fishery worker Craft or related trades Plant or machine operator Elementary occupation Not Stated Source: Statistics Centre - Abu Dhabi 224 Statistical Yearbook of Abu Dhabi 2018
223 5.2.6 Distribution of Employed Population Estimates (15 Years and Over) by Citizenship, Main Occupation and Gender, Al Ain Region, 2017 (%) Citizenship and Main Occupation Males Females Total Grand Total Manager Professional Technician or Associate professional Clerical support worker Service or sales worker Agricultural, forestry or fishery worker Craft or related trades Plant or machine operator Elementary occupation Not Stated Citizens Manager Professional Technician or Associate professional Clerical support worker Service or sales worker Agricultural, forestry or fishery worker Craft or related trades Plant or machine operator Elementary occupation Not Stated Non-Citizens Manager Professional Technician or Associate professional Clerical support worker Service or sales worker Agricultural, forestry or fishery worker Craft or related trades Plant or machine operator Elementary occupation Not Stated Source: Statistics Centre - Abu Dhabi Statistical Yearbook of Abu Dhabi
224 5.2.7 Distribution of Employed Population Estimates (15 Years and Over) by Citizenship, Main Occupation and Gender, Al Dhafra Region, 2017 (%) Citizenship and Main Occupation Males Females Total Grand Total Manager Professional Technician or Associate professional Clerical support worker Service or sales worker Agricultural, forestry or fishery worker Craft or related trades Plant or machine operator Elementary occupation Not Stated Citizens Manager Professional Technician or Associate professional Clerical support worker Service or sales worker Agricultural, forestry or fishery worker Craft or related trades Plant or machine operator Elementary occupation Not Stated Non-Citizens Manager Professional Technician or Associate professional Clerical support worker Service or sales worker Agricultural, forestry or fishery worker Craft or related trades Plant or machine operator Elementary occupation Not Stated Source: Statistics Centre - Abu Dhabi 226 Statistical Yearbook of Abu Dhabi 2018
225 5.2.8 Distribution of Employed Population Estimates (15 Years and Over) by Economic Activity and Gender, 2017 (%) Economic Activity Males Females Total Total Agriculture, forestry & fishing Mining and quarrying Manufacturing Electricity, gas, steam & air conditioning supply Water supply; sewerage, waste management & remediation activities Construction Wholesale & retail trade repair of motor vehicles and motorcycles Transportation & storage Accommodation & food service activities Information & communication Financial & insurance activities Real estate activities Professional, scientific & technical activities Administrative & support service activities Public administration & defence; compulsory social security Education Human health & social work activities Arts, entertainment & recreation Other service activities Activities of households as employers undifferentiated goods & services Activities of extraterritorial organizations & bodies Not Stated Source: Statistics Centre - Abu Dhabi Statistical Yearbook of Abu Dhabi
226 5.2.9 Distribution of Citizens Employed Population Estimate (15 Years and Over) by Economic Activity and Gender, 2017 (%) Economic Activity Males Females Total Total Agriculture, forestry & fishing Mining and quarrying Manufacturing Electricity, gas, steam & air conditioning supply Water supply; sewerage, waste management & remediation activities Construction Wholesale & retail trade repair of motor vehicles and motorcycles Transportation & storage Accommodation & food service activities Information & communication Financial & insurance activities Real estate activities Professional, scientific & technical activities Administrative & support service activities Public administration & defence; compulsory social security Education Human health & social work activities Arts, entertainment & recreation Other service activities Activities of households as employers undifferentiated goods & services Activities of extraterritorial organizations & bodies Not Stated Source: Statistics Centre - Abu Dhabi 228 Statistical Yearbook of Abu Dhabi 2018
227 Distribution of Non-Citizens Employed Population Estimates (15 Years and Over) by Economic Activity and Gender, 2017 (%) Economic Activity Males Females Total Total Agriculture, forestry & fishing Mining and quarrying Manufacturing Electricity, gas, steam & air conditioning supply Water supply; sewerage, waste management & remediation activities Construction Wholesale & retail trade repair of motor vehicles and motorcycles Transportation & storage Accommodation & food service activities Information & communication Financial & insurance activities Real estate activities Professional, scientific & technical activities Administrative & support service activities Public administration & defence; compulsory social security Education Human health & social work activities Arts, entertainment & recreation Other service activities Activities of households as employers undifferentiated goods & services Activities of extraterritorial organizations & bodies Not Stated Source: Statistics Centre - Abu Dhabi Statistical Yearbook of Abu Dhabi
228 Figure Distribution of Employed Population Estimates (15 Years and Over) by Work Sector and Gender, Government Private Joint Private Households Others. Males. Females Source: Statistics Centre - Abu Dhabi 230 Statistical Yearbook of Abu Dhabi 2018
229 Distribution of Employed Population Estimates (15 Years and Over) by Citizenship, Work Sector and Gender, 2017 (%) Citizenship and Work Sector Males Females Total Grand Total Government Private Joint (Gov. and Private) Foreign Diplomatic Non-Profit Organization Without Establishment Private Households Others Not Stated Citizens Government Private Joint (Gov. and Private) Foreign Diplomatic Non-Profit Organization Without Establishment Private Households Others Not Stated Non-Citizens Government Private Joint (Gov. and Private) Foreign Diplomatic Non-Profit Organization Without Establishment Private Households Others Not Stated Source: Statistics Centre - Abu Dhabi Statistical Yearbook of Abu Dhabi
230 Distribution of Employed Population Estimates (15 Years and Over) by Citizenship, Work Sector and Gender, Abu Dhabi Region, 2017 (%) Citizenship and Work Sector Males Females Total Grand Total Government Private Joint (Gov. and Private) Foreign Diplomatic Non-Profit Organization Without Establishment Private Households Others Not Stated Citizens Government Private Joint (Gov. and Private) Foreign Diplomatic Non-Profit Organization Without Establishment Private Households Others Not Stated Non-Citizens Government Private Joint (Gov. and Private) Foreign Diplomatic Non-Profit Organization Without Establishment Private Households Others Not Stated Source: Statistics Centre - Abu Dhabi 232 Statistical Yearbook of Abu Dhabi 2018
231 Distribution of Employed Population Estimates (15 Years and Over) by Citizenship, Work Sector and Gender, Al Ain Region, 2017 (%) Citizenship and Work Sector Males Females Total Grand Total Government Private Joint (Gov. and Private) Foreign Diplomatic Non-Profit Organization Without Establishment Private Households Others Not Stated Citizens Government Private Joint (Gov. and Private) Foreign Diplomatic Non-Profit Organization Without Establishment Private Households Others Not Stated Non-Citizens Government Private Joint (Gov. and Private) Foreign Diplomatic Non-Profit Organization Without Establishment Private Households Others Not Stated Source: Statistics Centre - Abu Dhabi Statistical Yearbook of Abu Dhabi
232 Distribution of Employed Population Estimates (15 Years and Over) by Citizenship, Work Sector and Gender, Al Dhafra Region, 2017 (%) Citizenship and Work Sector Males Females Total Grand Total Government Private Joint (Gov. and Private) Foreign Diplomatic Non-Profit Organization Without Establishment Private Households Others Not Stated Citizens Government Private Joint (Gov. and Private) Foreign Diplomatic Non-Profit Organization Without Establishment Private Households Others Not Stated Non-Citizens Government Private Joint (Gov. and Private) Foreign Diplomatic Non-Profit Organization Without Establishment Private Households Others Not Stated Source: Statistics Centre - Abu Dhabi 234 Statistical Yearbook of Abu Dhabi 2018
233 Distribution of Employed Population Estimates (15 Years and Over) by Citizenship, Marital Status and Gender, 2017 (%) Citizenship and Marital Status Males Females Total Grand Total Never Married Married Divorced Widowed Citizens Never Married Married Divorced Widowed Non-Citizens Never Married Married Divorced Widowed Source: Statistics Centre - Abu Dhabi Statistical Yearbook of Abu Dhabi
234 Distribution of Employed Population Estimates (15 Years and Over) by Citizenship, Actual Weekly Working Hours and Gender, 2017 (%) Citizenship and Actual Weekly Working Hours Males Females Total Grand Total * Not Stated Citizens * Not Stated Non-Citizens * Not Stated Source: Statistics Centre - Abu Dhabi * 0: Employed Persons who were absent from a work during the previous seven days. 236 Statistical Yearbook of Abu Dhabi 2018
235 5.3 Unemployment The unemployment rate in 2017 was about 5.0%, Increase from 4.4% according to 2016 estimates. The 25 to 29 years age group accounted for the largest proportion of the unemployed persons (24.9%). Data shows female unemployment rate in 2017 was higher than that of male, averaging 10.9%. A distribution by educational attainment reveals that the majority of the unemployed (39.4%), hold an bachelor's degree, followed by upper secondary education 33.1%, while those with an educational attainment less than primary made up the lowest percentage (2.2%) of the unemployed. As the survey results indicate, 48.8% of the unemployed in the Emirate of Abu Dhabi are married, while 47.9% of them never married. Figure Unemployment Rate by Gender and Years Males. Females Source: Ministry of Economy, Department of Economic Development and Statistics Centre - Abu Dhabi Unemployment Rate by Gender and Years (%) Gender * 2015* 2016* 2017* Grand Total Males Females Source: Statistics Centre - Abu Dhabi * Estimated from Labour Force Survey, 2014, 2015,2016 and 2017 Statistical Yearbook of Abu Dhabi
236 5.3.2 Distribution of Unemployed Population Estimates (15 Years and Over) by Age Group and Gender, 2017 (%) Age Group Males Females Total Total Source: Statistics Centre - Abu Dhabi 238 Statistical Yearbook of Abu Dhabi 2018
237 5.3.3 Distribution of Unemployed Population Estimates (15 Years and Over) by Educational attainment and Gender, 2017 (%) Educational attainment Males Females Total Grand Total Less than primary Primary Lower Secondary Upper Secondary Post-secondary Bachelor or equivalent Higher Education Source: Statistics Centre - Abu Dhabi Distribution of Unemployed Population Estimate (15 Years and Over) by Marital Status and Gender, 2017 (%) Marital Status Males Females Total Grand Total Never Married Married Divorced Widowed Source: Statistics Centre - Abu Dhabi Statistical Yearbook of Abu Dhabi
238 5.4 Outside Labour Force Population and Economic Dependency Ratio As estimates indicate, the economic dependency ratio in Abu Dhabi Emirate was 51.2 dependents per 100 in the labour force for the total population, 28.0 for males and for females. 20.2% of the total population aged 15 years and over were Outside Labour Force in year 2017, of which most were individuals engaged in household duties or students Economic Dependency Ratio by Citizenship, Region and Gender, 2017 (per 100 in the labour force) Citizenship and Region Males Females Total Grand Total Abu Dhabi Region Al Ain Region Al Dhafra Region Citizens Abu Dhabi Region Al Ain Region Al Dhafra Region Non- Citizens Abu Dhabi Region Al Ain Region Al Dhafra Region Source: Statistics Centre - Abu Dhabi Distribution of Outside Labour Force Population Estimates (15 Years and Over) by Economic Inactive Status and Gender, 2017 (%) Economic Inactive Status Males Females Total Total Household duties Student Unable to work Retired Over 65 of Age and Doesn't Work Independent income Social Circumstances Unwilling to work Didn't Find suitable Work Others Source: Statistics Centre - Abu Dhabi 240 Statistical Yearbook of Abu Dhabi 2018
239 5.4.3 Distribution of Outside Labour Force Population Estimates (15 Years and Over) by Citizenship, Age Group and Gender, 2017 (%) Citizenship and Age Group Males Females Total Grand Total Citizens Non-citizens Source: Statistics Centre - Abu Dhabi Statistical Yearbook of Abu Dhabi
240

241 6. Agriculture and Environment Agriculture Environment Energy and Water
2. Industry and Business
 72 Statistical Yearbook of Abu Dhabi 2016 2. Industry and Business Business Enviroment Manufacturing Oil and Gas Petrochemicals Electricity and Water Construction Transport Information and Communication
Major Groups. Food & beverages Percentage Change. Dec-12. Sep-13. Jun-13. Mar-13 SEPTEMBER 2013 QTR KEY POINTS
 2.5 2.0 1.5 1.0 0.5 0.0-0.5-1.0 Movement of Consumer Price Index Sep-12 Dec-12 Mar-13 Jun-13 Sep-13 Major Groups QTR on QTR YR on YR %Change Food & Beverage -0.3 3.4 Alcohol, tobacco & betel nut -2.0 1.9
CONTENTS Executive Summary... iii 1. Introduction Major Destinations for Zambia s Exports Major Source Countries for Zambia s
 Bank of Zambia CONTENTS Executive Summary... iii 1. Introduction... 1 2. Major Destinations for Zambia s Exports... 1 3. Major Source Countries for Zambia s Imports... 3 4. Conclusion... 6 ii Executive
CONTENTS Executive Summary... iii 1. Introduction Major Destinations for Zambia s Exports Major Source Countries for Zambia s
 Bank of Zambia CONTENTS Executive Summary... iii 1. Introduction... 1 2. Major Destinations for Zambia s Exports... 1 3. Major Source Countries for Zambia s Imports... 4 4. Conclusion... 6 ii Executive
1.0 Introduction Zambia s Major Trading Partners Zambia s Major Export Markets... 4
 Bank of Zambia CONTENTS 1.0 Introduction... 3 2.0 Zambia s Major Trading Partners... 3 3.0 Zambia s Major Export Markets... 4 4.0 Major Source Countries Of Zambia s Imports... 5 5.0 Direction Of Trade
Benchmarking Travel & Tourism in United Arab Emirates
 Benchmarking Travel & Tourism in United Arab Emirates How does Travel & Tourism compare to other sectors? Summary of Findings, November 2013 Sponsored by: Outline Introduction... 3 UAE summary...... 8
DOMESTIC AND FOREIGN DIRECT INVESTMENT REALIZATION IN QUARTER II AND JANUARY JUNE 2013
 Invest in remarkable indonesia Invest in indonesia Invest in remarkable indonesia Invest in remarkable indonesia Invest in Invest in remarkable indonesia Invest in indonesia Invest in remarkable indonesia
CONTENTS Executive Summary... iii 1. Introduction Major Destinations for Zambia s Exports Major Source Countries for Zambia s
 Bank of Zambia CONTENTS Executive Summary... iii 1. Introduction... 1 2. Major Destinations for Zambia s Exports... 1 3. Major Source Countries for Zambia s Imports... 4 4. Conclusion... 6 ii Executive
1.0 Introduction Zambia s Major Trading Partners Zambia s Major Export Markets... 4
 Bank of Zambia CONTENTS 1.0 Introduction... 3 2.0 Zambia s Major Trading Partners... 3 3.0 Zambia s Major Export Markets... 4 4.0 Major Source Countries Of Zambia s Imports... 5 5.0 Direction Of Trade
Asia-Pacific Trade Briefs: New Zealand
 i Asia-Pacific Trade Briefs: New Zealand Merchandise Trade New Zealand has a trade-to-gdp ratio of 51.96%. Merchandise trade accounted for 73.1% of New Zealand's total trade in 2017. New Zealand's merchandise
MONTHLY NATURAL GAS SURVEY. November 2009
 MONTHLY NATURAL GAS SURVEY November 2009 INTERNATIONAL ENERGY AGENCY INTERNATIONAL ENERGY AGENCY Next Release: 12 March 2010 MONTHLY NATURAL GAS SURVEY - 1 CONTENTS TABLE 1 Natural Gas Balances in OECD
Benchmarking Travel & Tourism in Russia
 Benchmarking Travel & Tourism in Russia How does Travel & Tourism compare to other sectors? Sponsored by: Summary of Findings, November 2013 Outline Introduction... 3 Russia summary..... 8 Data sources
Fiji s Tourism Satellite Accounts
 Asia-Pacific Economic Statistics Week Bangkok 2 4 May 2016 Fiji s Tourism Satellite Accounts Mr. Bimlesh Krishna Divisional Manager Economic Statistics Fiji s Tourism Satellite Introduction The Tourism
Import Summery Report United Arab Emirates
 Import Summery Report United Arab Emirates Contents 1. 2. 3. 3.1 3.2 3.3 3. 3.5. 5. 5.1 5.2 Disclaimer Overview of UAE Imports Non-Oil Imports Overview of UAE Import Sectors Food Products Building Materials
United Kingdom. How does Travel & Tourism compare to other sectors? GDP. Size. Share. UK GDP Impact by Industry. UK GDP Impact by Industry
 United Kingdom Stonehenge in Wiltshire Agriculture Automotive Banking Chemicals Communications Education Financial Mining Other Service Manufacturing Manufacturing Services Exports Retail (without wholesale)
Mexico. How does Travel & Tourism compare to other sectors? GDP. Size. Share. Mexico GDP Impact by Industry. Mexico GDP Impact by Industry
 Mexico Chapultepec Castle in Mexico City Agriculture Automotive Manufacturing Banking Chemicals Manufacturing Communications Education Financial Services Mining Other Service Exports Retail (without wholesale)
QATAR. Its total population is 2,123,160(2014) and it is at number 146 in the world.
 and it is at number 146 in the world.") QATAR Qatar, officially the State of Qatar, is a sovereign Arab country located in Southwest Asia. Its sole land border is with Saudi Arabia to the south with the rest of its territory surrounded by the
QATAR Qatar, officially the State of Qatar, is a sovereign Arab country located in Southwest Asia. Its sole land border is with Saudi Arabia to the south with the rest of its territory surrounded by the
1.0 Introduction Zambia s Major Trading Partners Zambia s Major Export Markets... 4
 Bank of Zambia CONTENTS 1.0 Introduction... 3 2.0 Zambia s Major Trading Partners... 3 3.0 Zambia s Major Export Markets... 4 4.0 Major Source Countries Of Zambia s Imports... 5 5.0 Direction Of Trade
Newfoundland and Labrador s Merchandise Trade with the World
 Newfoundland and Labrador s Merchandise Trade with the World Publication No. 2013-40-E 26 June 2013 Michaël Lambert-Racine Economics, Resources and International Affairs Division Parliamentary Information
Travel & Tourism Sector Ranking South Korea
 Travel & Tourism Sector Ranking South Korea Summary of Findings, November 2013 Introduction Sector Ranking Analysis In order to better understand the importance of the Travel & Tourism industry in a global
Textile Per Capita Consumption
 January 2018 Textile Per Capita Consumption 2005-2022 Part 2: Upper middle income countries - - CHF500.- Table of Contents Preface... 4 Sources... 5 Definitions... 6 Charts... 7 Executive Summary... 10
Travel & Tourism Sector Ranking United Kingdom. Summary of Findings, November 2013
 Travel & Tourism Sector Ranking United Kingdom Summary of Findings, November 2013 Introduction Sector Ranking Analysis In order to better understand the importance of the Travel & Tourism industry in a
Benchmarking Travel & Tourism in Australia
 Benchmarking Travel & Tourism in Australia How does Travel & Tourism compare to other sectors? Sponsored by: Summary of Findings, November 2013 Outline Introduction... 3 Australia summary..... 8 Data sources
Australia. A: Definitions and sources of data
 Australia A: Definitions and sources of data Data on foreign direct investment (FDI) in Australia are reported by the Australian Bureau of Statistics (ABS). The definition of FDI is essentially in line
EXPORT PERFORMANCE MONITOR
 India s Exports Recorded High Growth Provisional figures available for April, 2007 show that India s merchandise exports during April 2007 are valued at US $ 10575.11 million ($ 10.57 billion) which is
THAILAND HOW DOES TRAVEL & TOURISM COMPARE TO OTHER SECTORS? BENCHMARK REPORT THAILAND 1 SPONSORS OF BENCHMARKING REPORT 2017
 THAILAND AGRICULTURE AUTOMOTIVE MANUFACTURING BANKING CHEMICALS MANUFACTURING COMMUNICATIONS CONSTRUCTION FINANCIAL SERVICES MINING OTHER SERVICE EXPORTS RETAIL (WITHOUT WHOLESALE) TOTAL ECONOMY TRAVEL
III. TRADE IN COMMERCIAL SERVICES BY CATEGORY
 .. TRADE IN COMMERCIAL SERVICES BY CATEGORY Transportation services China records impressive growth of world transportation services reached $750 billion in 2007, an increase of 19 per cent, following
Benchmarking Travel & Tourism in Colombia
 Benchmarking Travel & Tourism in Colombia How does Travel & Tourism compare to other sectors? Summary of Findings, November 2013 Sponsored by: Outline Introduction... 3 Colombia summary..... 8 Data sources
30. FOREIGN TRADE Table. Chart
 141 30. FOREIGN TRADE Table 30.1 Total Value of Foreign Trade through the Ports of Tamil Nadu by Air and Sea 30.2 Port-wise Exports and Imports in terms of Value through Tamil Nadu by Sea and Air 30.3
INTERNATIONAL TRAVEL AND TOURISM
 INTERNATIONAL TRAVEL AND TOURISM YEAR 2014 1. INTRODUCTION This issue of the Economic and Social Indicators presents data on International Travel and Tourism for the year 2014. A brief on the compilation
SOUTHERN AFRICA TRAVEL AND TOURISM BAROMETER REPORT 2015
 SOUTHERN AFRICA TRAVEL AND TOURISM BAROMETER REPORT 2015 1 Contents 1. TOURISM TRENDS: GLOBAL AND SOUTHERN AFRICA S MARKET SHARE IN AFRICA... 4 1.1. TOURIST ARRIVALS... 4 1.1.1. Global Tourist Arrivals
North Carolina (Statewide) 2016 Prosperity Zone Data Books
 2016 Prosperity Zone Data Books") North Carolina (Statewide) 2016 Prosperity Zone Data Books 2 North Carolina Prosperity Zones Western North Carolina Prosperity Zones Northwest Region Piedmont-Triad Region Western Region Southwest Region
North Carolina (Statewide) 2016 Prosperity Zone Data Books 2 North Carolina Prosperity Zones Western North Carolina Prosperity Zones Northwest Region Piedmont-Triad Region Western Region Southwest Region
The Economic Impact of Tourism in North Carolina. Tourism Satellite Account Calendar Year 2013
 The Economic Impact of Tourism in North Carolina Tourism Satellite Account Calendar Year 2013 Key results 2 Total tourism demand tallied $26 billion in 2013, expanding 3.9%. This marks another new high
DOMESTIC AND FOREIGN DIRECT INVESTMENT REALIZATION IN QUARTER I 2018
 DOMESTIC AND FOREIGN DIRECT INVESTMENT REALIZATION IN QUARTER I 2018 Jakarta, 30 th April 2018 Indonesia Investment Coordinating Board LIST OF CONTENTS I. QUARTER I 2018: In Comparison with 2017 II. QUARTER
Introduction on the Tourism Satellite Account
 Mr. Peter Laimer Directorate Spatial Statistics UNWTO/DG GROW TSA-Workshop Agenda Item 2 Introduction on the Tourism Satellite Account Framework, tables and benefits Brussels, 29/30 November 2017 www.statistik.at
III. TRADE IN COMMERCIAL SERVICES BY CATEGORY
 .. TRADE IN COMMERCIAL SERVICES BY CATEGORY Transportation services China records impressive growth Exports of world transportation services reached $750 billion in 2007, an increase of 19 per cent, following
ENGAGING ALUMNI WORLDWIDE
 ENGAGING ALUMNI WORLDWIDE COLUMBIA GLOBAL CENTERS and COLUMBIA ALUMNI ASSOCIATION Columbia University Senate Feb. 27, 2015 Mission Statement: Columbia Global Centers Columbia Global Centers promote and
APEC. in Charts 2016 POLICY SUPPORT UNIT
 APEC in Charts 2016 POLICY SUPPORT UNIT Asia-Pacific Economic Cooperation (APEC) was established in 1989. The 21 Member Economies are Australia; Brunei Darussalam; Canada; Chile; China; Hong Kong, China;
Asia-Pacific Economic Integration & Cooperation: Is Russia Ready to Join? Masahiro Kawai Dean and CEO Asian Development Bank Institute
 Asia-Pacific Economic Integration & Cooperation: Is Russia Ready to Join? Masahiro Kawai Dean and CEO Asian Development Bank Institute Symposium on Japanese and Russian Perspectives on World Economy, Politics
HONG KONG (Special Administrative Region)
") HONG KONG (Special Administrative Region) Attachments: A short note on External Trade Year 2010 Imports of Hong Kong from the World Imports of Hong Kong from Italy by product groups Exports (re-exports
HONG KONG (Special Administrative Region) Attachments: A short note on External Trade Year 2010 Imports of Hong Kong from the World Imports of Hong Kong from Italy by product groups Exports (re-exports
The Nordic Countries in an International Comparison. Helga Kristjánsdóttir 20. apríl 2012
 The Nordic Countries in an International Comparison Helga Kristjánsdóttir 20. apríl 2012 15 Figure 1. World Bank, GDP growth (annual %) 10 5 0 1961 1963 1965 1967 1969 1971 1973 1975 1977 1979 1981 1983
The Economic Contribution of Cruise Tourism to the Southeast Asia Region in Prepared for: CLIA SE Asia. September 2015
 BREA Business Research & Economic Advisors The Economic Contribution of Cruise Tourism to the Southeast Asia Region in 2014 Prepared for: CLIA SE Asia September 2015 Business Research & Economic Advisors
Tourism Satellite Account Calendar Year 2010
 The Economic Impact of Tourism in Georgia Tourism Satellite Account Calendar Year 2010 Highlights The Georgia visitor economy rebounded in 2010, recovering 98% of the losses experienced during the recession
Kyushu Economic Internationalization Data <Summary version>
 Kyushu Economic Internationalization Data 2014 Kyushu Economy Internationalization Data 2014 (main points) Degree of linkage between the Kyushu economy and the Asian economy The degree
APEC. in Charts Policy Support Unit
 APEC in Charts 2017 Policy Support Unit Asia-Pacific Economic Cooperation (APEC) was established in 1989. The 21 Member Economies are Australia; Brunei Darussalam; Canada; Chile; China; Hong Kong, China;
APEC. in Charts Policy Support Unit
 APEC in Charts 2018 Policy Support Unit Asia-Pacific Economic Cooperation (APEC) was established in 1989. The 21 Member Economies are Australia; Brunei Darussalam; Canada; Chile; China; Hong Kong, China;
Statistics of Air, Water, and Land Transport Statistics of Air, Water, and Land. Transport Released Date: August 2015
 Statistics of Air, Water, and Land Transport 2014 2013 1 Released Date: August 2015 Table of Contents Introduction... 4 Key Points... 5 1. Air Transport... 6 1.1 Aircraft movements... 6 1.2 Number of passengers...
IATA ECONOMIC BRIEFING MARCH 2011
 IATA ECONOMIC BRIEFING MARCH 2011 WHAT DRIVES THE SIZE OF PREMIUM AIR TRAVEL MARKETS? WHY PREMIUM AIR TRAVEL IS AN IMPORTANT TRAVEL MARKET SEGMENT The premium (first and business class) travel segment
Global robot installations: high double digit growth rates
 ' of units Global robot installations: high double digit growth rates 5 45 4 35 3 25 2 15 1 5 113 6 Estimated annual worldwide supply of industrial robots 28-216 and 217-22* +15% on average per year 121
POST SHOW REPORT September Kenyatta Int l. Convention Centre, Nairobi, Kenya
 st 21 2018 East Africa s Largest International Trade Exhibition On Multi-Sector Products, Equipment & Machinery POST SHOW REPORT 04-06 September Kenyatta Int l. Convention Centre, Nairobi, Kenya EXPOGROUP
United Nations Conference on Trade And Development INVESTMENT COUNTRY PROFILES. FRANCE February 2012
 United Nations Conference on Trade And Development INVESTMENT COUNTRY PROFILES FRANCE February 2012 i NOTE The Division on Investment and Enterprise of UNCTAD is a global centre of excellence, dealing
UNITED NATIONS CONFERENCE ON TRADE AND DEVELOPMENT INVESTMENT COUNTRY PROFILES LATVIA. October 2011
 UNITED NATIONS CONFERENCE ON TRADE AND DEVELOPMENT INVESTMENT COUNTRY PROFILES LATVIA October 2011 i NOTE The Division on Investment and Enterprise of UNCTAD is a global centre of excellence, dealing with
Outlook for air travel markets
 Outlook for air travel markets June 2016 Brian Pearce Chief Economist International Air Transport Association Extended period of strong air travel market growth 30% 25% 20% 15% 10% 5% 0% -5% -10% -15%
KINGDOM OF CAMBODIA NATION RELIGION KING 3
 KINGDOM OF CAMBODIA NATION RELIGION KING 3 TOURISM STATISTICS REPORT September 2014 MINISTRY OF TOURISM Statistics and Tourism Information Department No. A3, Street 169, Sangkat Veal Vong, Khan 7 Makara,
1.4: Premium Air Travel: An Important Market Segment
 CHAPTER 1.4 Premium Air Travel: An Important Market Segment SELIM ACH BRIAN PEARCE International Air Transport Association (IATA) The premium (first and business class) travel segment is an important market,
KINGDOM OF CAMBODIA NATION RELIGION KING 3
 KINGDOM OF CAMBODIA NATION RELIGION KING 3 TOURISM STATISTICS REPORT June 2014 MINISTRY OF TOURISM Statistics and Tourism Information Department No. A3, Street 169, Sangkat Veal Vong, Khan 7 Makara, Phnom
The Economic Impact of Tourism in Maryland. Tourism Satellite Account Calendar Year 2016
 The Economic Impact of Tourism in Maryland Tourism Satellite Account Calendar Year 2016 County Results Washington County, Visitors Washington County Visitors (thousands) Year Overnight Day Total Growth
THE GROWTH OF THE HOSPITALITY INDUSTRY IN DUBAI
 THE GROWTH OF THE HOSPITALITY INDUSTRY IN DUBAI THE DEFINITION OF TOURISM Tourism is travel for recreational, leisure or business purposes. The World Tourism Organization defines tourists as people "traveling
Port Services and Facilities
 KEY PERFORMANCE INDICATORS Port Services and Facilities Fremantle Ports objectives for the provision of services and facilities are aimed at ensuring that port services and facilities are reliable and
Economic Impact of Tourism in Hillsborough County September 2016
 Economic Impact of Tourism in Hillsborough County - 2015 September 2016 Key findings for 2015 Almost 22 million people visited Hillsborough County in 2015. Visits to Hillsborough County increased 4.5%
Press Information. Post Show Report
 Press Information Post Show Report Date: October 11 (Wed.) - 13 (Fri.), 2017 Venue: Makuhari Messe, Japan Organiser: Reed Exhibitions Japan Ltd. Co-organiser: Japan External Trade Organization (JETRO)
A F R I C A TANZANIA. 21 st POST SHOW REPORT
 21 st TANZANIA A F R I C A 2 0 1 8 East Africa s Largest International Trade Exhibition On Building & Construction Products, Equipments & Machinery POST SHOW REPORT 01-03 November 2018 Diamond Jubilee
The Economic Impact of Tourism in Maryland. Tourism Satellite Account Calendar Year 2015
 The Economic Impact of Tourism in Maryland Tourism Satellite Account Calendar Year 2015 MD tourism economy reaches new peaks The Maryland visitor economy continued to grow in 2015; tourism industry sales
UNITED NATIONS CONFERENCE ON TRADE AND DEVELOPMENT INVESTMENT COUNTRY PROFILES CZECH REPUBLIC. October 2011
 UNITED NATIONS CONFERENCE ON TRADE AND DEVELOPMENT INVESTMENT COUNTRY PROFILES CZECH REPUBLIC October 2011 i NOTE The Division on Investment and Enterprise of UNCTAD is a global centre of excellence, dealing
INTERNATIONAL TRAVEL AND TOURISM
 INTERNATIONAL TRAVEL AND TOURISM JANUARY TO SEPTEMBER 2017 1. INTRODUCTION This issue of the Economic and Social Indicators presents data on International Travel and Tourism for the first nine months of
INTERNATIONAL TRAVEL AND TOURISM
 INTERNATIONAL TRAVEL AND TOURISM YEAR 2017 1. INTRODUCTION This issue of the Economic and Social Indicators presents data on International Travel and Tourism for the year 2017. A brief on the compilation
Post Show Report. 42 nd MIDEAST WATCH & JEWELLERY SHOW th 8 th APRIL, 2017
 Post Show Report 42 nd MIDEAST WATCH & JEWELLERY SHOW 2017 4 th 8 th APRIL, 2017 INDEX SI NO INDEX 1 FACT SHEET 2 KEY FACTS PREVIOUS SHOW 3 INTRODUCTION 4 SHOW HIGHLIGHTS 5 EXHIBITORS GROWTH 6 VISITORS
IMD World Talent Report Factor 1 : Investment and Development
 THAILAND 2012 2013 2014 2015 2016 Overall Investment & Development Appeal Rank 2016 37 42 24 Readiness 49 of 61 Factor 1 : Investment and Development Total Public Expenditure on Education Percentage of
KINGDOM OF CAMBODIA NATION RELIGION KING 3
 KINGDOM OF CAMBODIA NATION RELIGION KING 3 TOURISM STATISTICS REPORT March 2014 MINISTRY OF TOURISM Statistics and Tourism Information Department No. A3, Street 169, Sangkat Veal Vong, Khan 7 Makara, Phnom
Hotel Establishments Statistics. First Half, September 2014
 Hotel Establishments Statistics First Half, 2014 September 2014 Hotel Establishments Statistics First Quarter, 2014-2013 161 Table of Contents Introduction 3 Key Points 4 Hotel Establishments 5 Number
The Economic Impact of Tourism in North Carolina. Tourism Satellite Account Calendar Year 2015
 The Economic Impact of Tourism in North Carolina Tourism Satellite Account Calendar Year 2015 Key results 2 Total tourism demand tallied $28.3 billion in 2015, expanding 3.6%. This marks another new high
Millions of BZ Dollars M
 External Trade Bulletin ETB MARCH 2017 IMPORTS DOWN 2.2%, DOMESTIC EXPORTS UP 35.5% IN MARCH IMPORTS MARCH 2017: In March 2017, Belize imported goods valuing $155 million; this represented a 2.2 percent
SACU MERCHANDISE TRADE STATISTICS 2011 (No 3) MERCHANDISE TRADE STATISTICS 2011
 MERCHANDISE TRADE STATISTICS 2011") SACU MERCHANDISE TRADE STATISTICS 2011 (No 3) MERCHANDISE TRADE STATISTICS 2011 SACU MERCHANDISE TRADE STATISTICS 2011 TABLE OF CONTENTS 1. OVERVIEW... 1 2. BOTSWANA... 5 3. LESOTHO... 7 4. NAMIBIA...
SACU MERCHANDISE TRADE STATISTICS 2011 (No 3) MERCHANDISE TRADE STATISTICS 2011 SACU MERCHANDISE TRADE STATISTICS 2011 TABLE OF CONTENTS 1. OVERVIEW... 1 2. BOTSWANA... 5 3. LESOTHO... 7 4. NAMIBIA...
GBTA BTI Outlook and Economic Forecast for Business Travel in Asia Pacific, Thailand and around the World
 GBTA BTI Outlook and Economic Forecast for Business Travel in Asia Pacific, Thailand and around the World Research Sponsored by: Welf J Ebeling Vice President, Operations - Asia Pacific Global Business
AACO Members Quick Facts 2013
 2014 AACO Members Quick Facts 2013 Member Airlines 32 Billion $ Revenue (+10.0% over 2012) 49.5 Million Passengers Carried (+7.5% over 2012) 153 Million Tonnes of Cargo (+11.6% over 2012) 4.8 Destinations
ISRAEL- COUNTRY FACTS
 ISRAEL- COUNTRY FACTS ISRAEL-NEIGHBOURING COUNTRIES AND POLITICAL MAP Area: 22,072 sq. km Land area: 21,643 sq. km. Fast Facts Area of lakes: 429 sq. km. (Sea of Galilee 164 sq. km., the Dead Sea - 265
20 th. POST SHOW REPORT June Kenyatta Int l. Convention Centre, Nairobi, Kenya
 20 th 2017 East Africa s Largest International Trade Exhibition On Multi-Sector Products, Equipment & Machinery POST SHOW REPORT 02-04 June Kenyatta Int l. Convention Centre, Nairobi, Kenya EXPOGROUP Supports
WORKSHOP ON COMPILATION OF INTERNATIONAL MERCHANDISE TRADE STATISTICTS ADDIS ABABA, 8-11 NOVEMBER, 2004 COUNTRY REPORT
 WORKSHOP ON COMPILATION OF INTERNATIONAL MERCHANDISE TRADE STATISTICTS ADDIS ABABA, 8-11 NOVEMBER, 2004 COUNTRY REPORT BY: SALEH MZEE SALEH THE CHIEF GOVERNMENT STATISTICIAN (OCGS) ZANZIBAR- TANZANIA NOVEMBER,
03 rd. POST SHOW REPORT August Mlimani Conference Centre, Dar-es-Salaam, Tanzania
 03 rd AFRICA 2017 East Africa s Largest International Trade Exhibition On Mining, Processing of Minerals & Safety Eqpt. POST SHOW REPORT 10-12 August Mlimani Conference Centre, Dar-es-Salaam, Tanzania
Global Travel Trends 2005
 Preliminary World Travel Monitor Results from IPK international for the ITB Berlin Message, 03/10/06 Global Travel Trends 2005 Based on the new data from the 2005 World Travel Monitor, and as it does every
(A) Comparative Summary of Canadian Grain Exports (A) Comparative Summary of Canadian Grain Exports
 Comparative Summary of Canadian Grain Exports (A) Comparative Summary of Canadian Grain Exports") (A) Comparative Summary of Canadian Grain Exports 3 Wheat Amber Durum Oat Barley Rye Flax Canola Soybeans Peas Corn Lentil Total, 2013 947.0 318.7 52.9 103.3 3.3 29.2 685.5 8.3 323.2 18.9 8.3 2,498.5 February,
(A) Comparative Summary of Canadian Grain Exports 3 Wheat Amber Durum Oat Barley Rye Flax Canola Soybeans Peas Corn Lentil Total, 2013 947.0 318.7 52.9 103.3 3.3 29.2 685.5 8.3 323.2 18.9 8.3 2,498.5 February,
Commercial Exchange Rate
 Commercial Exchange Rate Real (R$) / US dollar (US$), daily report R$ / US$ 4.5 4 3.5 3 2.5 2 1.5 1 25 26 27 28 29 2 211 212 213 214 215 216 Source: Central Bank of Brazil (Banco Central do Brasil, Sistema
Distribution of establishments involved in domestic trade according to the number of employees (December 31 st, 1996) Granada.
 Granada.") 10 Trade and tourism This chapter compiles representative data of the most important sub-sectors within the service sector: trade and tourism. Regarding trade, distinctions are made between domestic and
10 Trade and tourism This chapter compiles representative data of the most important sub-sectors within the service sector: trade and tourism. Regarding trade, distinctions are made between domestic and
EXPOGROUP Supports The GO GREEN Campaign Across The Globe. Grow A Plant Every Weekend And Enjoy It Grow!
 21 st KENYA A F R I C A 2 0 1 8 East Africa s Largest International Trade Exhibition On POST SHOW REPORT 03-05 May 2018 Kenyatta Int l. Convention Centre, Nairobi EXPOGROUP Supports The GO GREEN Campaign
FINLAND. Table 1. FDI flows in the host economy, by geographical origin. (Millions of US dollars)
") Table 1. FDI flows in the host economy, by geographical origin World 3 732 8 046 3 319 2 823 4 750 7 652 12 451-1 144 718 7 359 2 550 4 158 Developed economies 3 638 8 003 2 382 2 863 4 934 7 258 12 450-855
Table 1. FDI flows in the host economy, by geographical origin World 3 732 8 046 3 319 2 823 4 750 7 652 12 451-1 144 718 7 359 2 550 4 158 Developed economies 3 638 8 003 2 382 2 863 4 934 7 258 12 450-855
Economic Impact of Tourism in South Dakota, December 2017
 Economic Impact of Tourism in South Dakota, 2017 December 2017 1) Key findings 1) Growth continues in 2017 but pales against the event driven years of 2015 and 2016 in South Dakota Key facts about South
FY2015 2nd Quarter Business Results
 FY2015 2nd Quarter Business Results Project AH A MAY products Yamaha Corporation and Yamaha Motor Co., Ltd. make products by exchanging the design divisions and their design fields, and present a joint
Market & Country brief on Australia
 SRI LANKA EXPORT DEVELOPMENT BOARD Market & Country brief on Australia 1. Background Contents PREPARED BY MARKET DEVELOPMENT DIVISION-EDB May 2018 Contents 1. Trade between Sri Lanka & Australia 2. Bilateral
Region Business Profile
 Business Profile ZRENJANIN Short Summary. Zrenjanin is located in the northeast part of Serbia and represents the largest city of the Serbian part of the Banat. It is also a regional political, cultural
Australian livestock export industry statistical review FY MLA s Market Information Service October Vietnam market update
 Australian livestock export industry statistical review FY 214 15 MLA s Market Information Service October 215 2 9463 9372 Vietnam market update AUSTRALIAN LIVESTOCK EXPORT INDUSTRY STATISTICAL REVIEW
Maximizing Economic Benefits of Aviation in the Region
 Maximizing Economic Benefits of Aviation in the Region Boubacar Djibo Director, Air Transport Bureau, ICAO Georgetown, Guyana 21 November 2018 Preamble. THEREFORE, the undersigned governments having agreed
Exports of Canadian Grain and Wheat Flour
 Canadian Grain Commission Commission canadienne des grain SEPTEMBER CROP YEAR -2010 Exports of Canadian Grain and Wheat Flour - -2010 date Tonnes (millions) 4.0 2.0 3.5 3.0 1.5 2.5 2.0 1.0 1.5 1.0 0.5
2007/08 Interim Results
 Bossini International Holdings Limited 2007/08 Interim Results For the six months ended 31 December 2007 Corporate Presentation 19 March 2008 0 Agenda Results Highlights Review of Operations Future Plans
Regional Tourism Satellite Accounts (RTSA) in Austria
 in Austria") Peter Laimer Directorate Spatial Statistics CIS countries and Georgia Workshop III (Session 1) 10-12 June 2013 Baku/Azerbaijan Regional Tourism Satellite Accounts (RTSA) in Austria Methods, data sources,
Peter Laimer Directorate Spatial Statistics CIS countries and Georgia Workshop III (Session 1) 10-12 June 2013 Baku/Azerbaijan Regional Tourism Satellite Accounts (RTSA) in Austria Methods, data sources,
Exports of Canadian Grain and Wheat Flour
 Canadian Grain Commission Commission canadienne des grain MAY 2011 CROP YEAR Exports of Canadian Grain and Wheat Flour date Tonnes (millions) 14.0 12.0 10.0 8.0 6.0 4.0 2.0 0.0 7.0 6.0 5.0 4.0 3.0 2.0
Queensland Economic Update
 Queensland Economic Update Chamber of Commerce & Industry March 2018 cciq.com.au Queensland Economic Update: Summary National Accounts GDP expanded 2.3% during calendar year 2017. QLD state final demand
III. TRADE IN COMMERCIAL SERVICES BY CATEGORY
 . TRADE IN COMMERCIAL SERVICES BY CATEGORY The Highlights Transportation services Rising seaborne trade and air traffic contribute to the increase of transportation services trade In a context of rising
The W20. The 20 wealthiest countries in the world. Publication Date: October 2015 NEW WORLD WEALTH
 The W20 The 20 wealthiest countries in the world Publication Date: October 2015 W20 wealth rankings The following tables ranks the top 20 countries in the world by total individual wealth held. Total individual
East Africa s Largest Int l. Trade Exhibition & Conference on Power & Energy
 07 th 2 0 1 8 East Africa s Largest Int l. Trade Exhibition & Conference on Power & Energy POST SHOW REPORT 29-31 May 2018 KICC, Nairobi, Kenya EXPOGROUP Supports The GO GREEN Campaign Across The Globe.
The Economic Impact of Tourism on Guam. Tourism Satellite Account Calendar Year 2016
 The Economic Impact of Tourism on Guam Tourism Satellite Account Calendar Year 2016 Highlights! 2016 was a banner year for tourism on Guam, with visitation to Guam surpassing 1.5 million and visitor spending