UNIVERSITY OF ILLINOIS LIBRARY. AI UREANA-CHAMPAiGW STACKS
|
|
|
- Curtis Preston
- 5 years ago
- Views:
Transcription


1


2 UNIVERSITY OF ILLINOIS LIBRARY AI UREANA-CHAMPAiGW STACKS

3 Digitized by the Internet Archive in 2011 with funding from University of Illinois Urbana-Champaign


4
 College of Commerce and Business Administration University of")
5 Faculty Working Papers \ RAIL AND ROAD TRANSPORT IN THE SUDAN John F. Due #423 (Transportation Paper #15) College of Commerce and Business Administration University of Illinois at Urbana-Champaign


6


7 FACULTY WORKING PAPERS College of Commerce and Business Administration University of Illinois at Urbana-Champaign July 25, 1977 RAIL AND ROAD TRANSPORT IN THE SUDAN John F. Due (Transportation Paper #15) #423


8 .. ; :..'.' I I. ::-,


9 * ABSTRACT It is generally recognized that inadequate transportation has been a major obstacle to economic development in the Sudan. The inefficiency in recent years of the rail system and the very limited road development have without question hampered development. Difficulties with the railway, in turn, led to increased attention to road transport and the building of the pipeline which will aggravate the financial problems of the railway. Yet the potential is substantial: the rail system is one of the most extensive in Africa, covering virtually all the producing areas and towns except in the far south, and cost per ton kilometer is clearly less than that of road transport. The great problem is: how to improve rail efficiency, and to this the government is giving substantial attention. Sudan faces the same problem that confronts other African countries with substantial rail systems: rail costs are substantially lower than road transport costs with adequate traffic, but poor rail service results in diversion to road and improvements in nonrail facilities thus aggravating the problem with the railways. There are also long-range problems with the light traffic lines which are relatively long; unless traffic volume increases materially on these, it may be desirable ultimately to consider abandonment. This is not contemplated, quite wisely at present. There is very little likelihood of any additional rail construction, except the rebuilding of the line into Suakin as this port is developed to supplement Port Sudan, now operating nearly to capacity. *The author is indebted to the Center for International Comparative Studies, University of Illinois, for a grant to visit the Sudan in May 1977.


10 :.'_,,'.., ay


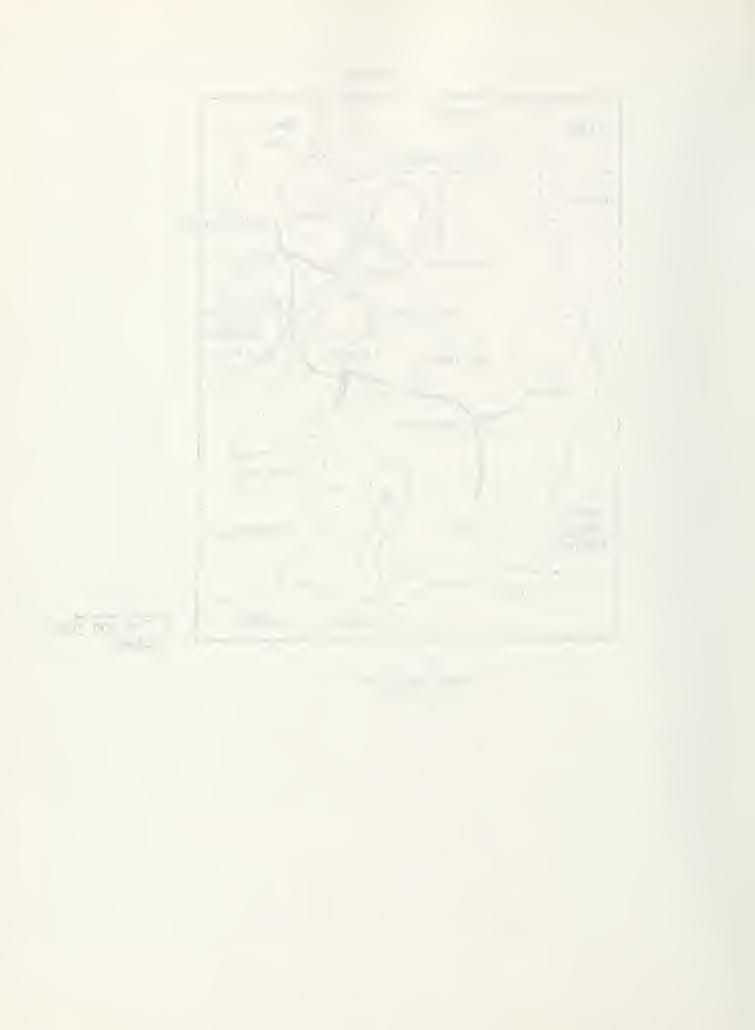
11 RAIL AND ROAD TRANSPORT IN THE SUDAN * The Democratic Republic of the Sudan is the largest country in Africa in area, with a population of about 18 million, heavily concentrated around Khartoum and the area to the south of the city. Much of the northern third is desert. Primarily an agricultural country, the Sudan is a major exporter of cotton, grown primarily on irrigated land in the Gezira, between the two branches of the Nile south of Khartoum. Most of the remainder of agricultural production is to the south and southwest of Khartoum. There is in addition substantial livestock production, primarily by nomadic tribes. Industry, heavily concentrated around Khartoum, is of relatively recent origin. Historically the main trade route to the Sudan was up the Nile Valley (the Nile was never navigable throughout because of cataracts), but in recent decades most import and export traffic is handled via Port Sudan on the Red Sea. There is some overland trade with countries to the south and southwest. Land transport in the Sudan is inherently difficult in view of the long distances with limited intermediate traffic and the harsh deserts. The railway system, with b,756 kilometers of line (2,956 miles) is currently the largest single system in all tropical Africa, second to East African Railways when that system functions as a unit. Furthermore, the Sudan remained almost entirely dependent on rail transport longer than virtually any other country in the world; only since the early 1970s has road transport come to play any significant role in transport, although it is now expanding rapidly. River transport is a minor element in the total picture. * The author is indepbted to officals of the Ministry of Planning, Democratic Republic of the Sudan, for their assistance. Experience in several other tropical African countries in the transport field is presented in "Some Observations on Rail and Road Transport in Commonwealth Tropical Africa", Transportation Research Paper # 14, College of Commerce, University of Illinois, April, 1977.

12


13 -2- Development of the Railway System Initial railway development in the Sudan resulted from military activity rather than economic considerations. From 1820 on, the Sudan was ruled by Egypt, itself dominated by Turkey, and to an increasing degree as time went on influenced by the British. But the foreign rule was tenuous at best, and the first rail line, started in 1875 from Wadi Haifa on the border with Egypt to bypass cataracts on the Nile, and reaching Sarras, 33 miles upstream, was designed to supply the garrison at Sarras. In the early 'eighties, the Sudanese revolted under the leadership of the Mahdi, and besieged the Egyptian forces in Khartoum, now led by British General Charles Gordon. In an effort to rescue Gordon, the Egyptians and British sent an expedition north up the Nile and extended the railway another 5^ miles to Akasha, in In the same year British forces also commenced to build a railway from Suakin, the old Red Sea port, toward the Nile, and 20 miles of track were laid. But the Egyptian forces in Khartoum were overwhelmed in January of 1885 and General Gordon's head was cut off on the steps of the Palace leading down to the Nile. The two rail lines were torn up by the Sudanese as a protection element, except the Wadi Halfa-Serras portion, but this did not operate. For more than a decade, Sudan remained independent and isolated. This defeat the British could not tolerate, and massive plans were developed to invade the Sudan in force and in cooperation with the Egyptians take the country back. As a part of this project, under General Kitchener, the rail line south from Wadi Haifa was restored, and laboriously extended to Abu Fatma, 200 miles from Khartoum, bypassing the third cataract. But it was 1. The railroad developments during the period. of Kitchener's reconquest are described by Winston Churchill in The River War (London, Eyre and Spotteswoode, 1899).


14 : ' - -.ra- -. ; - : v : JK :. ;' *»\ ;» >»rfv ;*., ry,-. -, ". v :-.,, i... sryy j..- : -:' -...->,.-


15 -3- decided by the British command that to dangerous from a military standpoint, extend this on toward Khartoum was and that a direct line was needed south from Wadi Haifa, cutting across the neck of the great loop of the Nile, in an area of some of the most forbidding desert in the world. But by 1898 the line had been completed 385 miles to Atbara, where the Atbara river joins the Nile. The railroad played a major role in the inevitable success of the British expedition. The line was pushed on to Khartoum late in 1899 and the old capital now had a direct link with navigation on the Nile in Egypt. But the new government (Sudan had become the Anglo-Egyptian Sudan, and thus in fact under British domination) recognized that this rail-water route was not adequate for import and export trade, and in 190^-05 built from Atbara to the old port of Suakin and on to the new harbor at Port Sudan in This route, from Khartoum via Atbara to Port Sudan, has been the major route 2 since that time and greatly facilitated import and export trade. Further expansion of the system was spread over several decades, the major steps being as follows: 1. Prom a point just north of Abu Hamed, to Karima, on the Nile, to connect with the river service from Karima to Dongola on the navigable stretch of the river between the third and fourth cataracts. 2. Southward, from Khartoun to Scnnar in 1909 and to El Obeid, the largest city in the Sudan outside the Khartoum area, in A line from the Port Sudan route at Haifa southwestward via Kassala (1924) and Gedaref (1928), to connection with the Khartoum-S ennar line at the latter point in 1929 at 1. This expedition was an extreme instance of "prestige" imperialism its worst. 2. The old line down the river from Wadi Haifa was abandoned in 1905


16


17 Assuan LIBYA EGYPT 4 i Red Wadi Haifa CHAD Abu Hamed I PORT SUDAN f (' Kassala"* ERITREA ' } Nyala 1. CENTRAL AFRICAN REPUBLIC ZAIRE t t..i i miles SUDAN RAILWAYS Fi<. 1

18
» and Nyala (1959)» and from Babanousa to Wau (l96l) A few other short segments have been built, some of them later removed The Lines Table")
19 -4- k. Post World War II construction, designed to improve agricultural production in the south and southwest: a. South from Sennar to El Damazine, b. Southwest from a junction near El Obeid to Babanousa (l957)» and Nyala (1959)» and from Babanousa to Wau (l96l) A few other short segments have been built, some of them later removed The Lines Table I provides available data on the various lines, with traffic density figures for A brief description of each line should aid in understanding the system: 1. The main line, Khartoum-Port Sudan via Atbara. The traffic density on this line is between 2 million and 2 million net ton miles per mile of line. This compares with Zambia Railways, the expected traffic on TAZARA, and the Tanzania Central line; it is substantially less than the Mombasa- Nairobi line of East African. This line carries about two-thirds of the total traffic of the system. Most imports move first to Khartoum and then out to the final destination. The inbound traffic is about twice as great as the outbound traffic. The imports consist primarily of petroleum products and a wide variety of manufactured goods and materials, the export traffic, farm products, with cotton dominant. The line follows the Nile north from Khartoum, turns east at Atbara to climb gradually up to 3»000 feet at the divide, and drops through rolling country to Port Sudan. 2. The southwestern line, down through the cotton-raising irrigated Gezira, then southwestward through the gum Arabic section at EL Obeid,


20 ..-


21 -5- ultimately to farming axeas centering on Wau and Nyala, The lines carry a limited amount of traffic for Chad and the Central African Empire. 3. The Haifa-Kassala-Sennar, secondary main line, carries much of the export produce and brings in imports to the cities and towns. Traffic from the southwest line and the EL Damazine branch has of course the alternative route via Khartoum, hut much of the export traffic goes directly via Kassala. The El Damazine "branch, with relatively light traffic, carries the farm produce of this area, "but a substantial amount is now hauled by road transport to Sennar. k. The Northern lines, to Karima primarily hauling inbound traffic to connect with river barges that serve the towns along this portion of the Nile, and the original line to Wadi Haifa, now handling only limited traffic. ' The lines were operated as a government department until 195^» when Sudan Railways Corporation, wholly government owned but with some autonomy, was created. The Sudan Railways has never connected with lines of other countries, though links have been proposed, and the gaps are relatively small. The Egyptian system ends near Aswan, roughly 100 miles north of Wadi Haifa, and there has been talk at tiroes of closing this gap. But the Egyptian Railways use standard (4'& ") gauge and through service would not be possible. In the southeast, less than 60 miles once separated the end of the Sudan Railway Tessenai branch and the end of the Eritrean lines at Biscia,This latter route


22


23 -^ W) <1> fig o 0) c s S S S P4 4> PM O CNnO H coco cm NO.3- CO CM CM no cocm 0) tud SS ta no CM H 00 OXOCMOVO ^O^.H CO CM CVJ H.* CM CM CO COCO <! 3 -P pm-p I o I 8 D ft to «h o o VOCO CO 00 w^ CM CM CM CN-O-JN- VOCO COH CM H H VO H H H H IS O d O i I 8 8* 2 *» 9 < a x! CO NO CM OHN rh r-l H VO O 00 Os^T\ir\C0 en. voon - * U>iT>CM oohnhh H CM COrH CM CM CM <*-V O IN- CM rh ON.* COCM (AhcanV CM CM H ONCN-InI ts-00 o\ ft r-i^ CM CM CM ONVOCM O tn-o 3" COrH H H-* OND CM CM CO 00 ON ON ON CM H O-iH vo 3-0*0 H H o s O o\ -P H m o o ON NO 00 N-CO lo ON ON CO rh rh CM K S CO O-O-CO ^ JN- COCO*OnO CO 00 CO CM H los^vo OOO On ON On "N.UNO UNUNO O O IN- C^- in \T\ vo VN.O O O- vo^o!* O I s A CO ia CO SO On ON \0 CM CO NO COrH rh CO-* CM CM H (DOO00N NO CM CM O IS- H CM CM CM CM < NO CNi H H < CO hnooo co cm cm cv O-lfNO. -3" "NCM cn^f CM CN-u\v!Sc»N^t CM Cncncn3- O CM rh CM CM CO O o * rh ej i h n % II a J3.8
24


 at Pachwach in Uganda, There has been discussion of building such a line, and also of a")
25 -7- extends eastward via Asmara to Massawa, of mountain railway anywhere in Africa. one of the most severe stretches But the western portion of the Eritrean lines has been abandoned and the Eritrean system disorganized by the secessionist movement. Relations between Sudan and Ethiopia, traditionally hostile, have been aggravated by the quarrel over Eritrean independence. Should Eritrea become independent, connection of the two lines is not impossible but given the grades of the Asmara line and the preference of Sudan to have foreign trade move via Port Sudan, it would not be of great potential use. In the south, the gap is much greater about 300 miles between Wau and the end of East African Railways (EAR) at Pachwach in Uganda, There has been discussion of building such a line, and also of a line tc connect with East African Railways in Kenya but this gap is still greater. Furthermore, EAR uses metre guage, Sudan, the I.O67 metre Gape gauga. But it is interesting to note that with Tazara completed, the old Cape to Cairo dream has only two gaps Packwach to Wau and Wadi Haifa to Aswan. Were East African converted to guage and the break at the Kenya-Tanzania border closed, as well as the two gaps above, freight could move through except for political obstacles from Cape Town to Cairo, with only one transfer, at Aswan. More practically, freight could move from Lusaka to Khartoum. Traffic Composition Table 2, reproduced from the Transport Statistical Bulletin, Sudan, for 1975, shows the traffic volume by commodity to 197^-75, and Table 3, the trend in imports, exports, animal, and local freight traffic since 1955/56. There was a steady Upward trend ^, a decline to 1968, a rise to 1971» a decline to 1975 with a loss of about one-sixth of the tonnage over the four 1. Virtually all data in the Sudan are expressed in fiscal years (July 1- June 30). Only the ending year of each fiscal year is shown subsequently.

26
 1961-62 1963-64 1965-66 1967-68 196S -70 1970-71 1971-72 1972-73 1973-74 1974-75 Total % Total % ' rotal % Total % ' rotal»/ ' rotal % Total %")


27 Table 2. Rail Freight Traffic by Major Comincxlities (000 Tons) S Total % Total % ' rotal % Total % ' rotal»/ ' rotal % Total % Total % Total % Total % Cotton & Cotton Seed Livestock Rail Own Traffic Other Oil Seed Oil Cakes Majze and Millet Flour, Wheat & Rice Cement Sugar Timber, Charcoal & Firewood Cars, Iron & Steel & Glass Petroleum Products Fertilizers & Insecticides Chemicals & Medicines ! Jute Products Salt Tea Paper Miscellaneous Total Source: Note : Sudan Railways Annual Reports. Freight traffic includes rail revenue traffic plus rail's own traffic.

28
 Rail Export Rail 1Import Rail Local Rail Animal Rail Own Total Rail Traffic Years Traffic Traffic Traffic Traffic Traffic Total % Total")

29 »w»w- V-" Talile 3. Snrfart Railways Freight Traffic by Type (Traffic in 000 Tons) Rail Export Rail 1Import Rail Local Rail Animal Rail Own Total Rail Traffic Years Traffic Traffic Traffic Traffic Traffic Total % Total % Total % Total % Total % Total V 1955/ / / / / , / / too 1963/ / I / / / / / / / / / / Sources Sudan Railways Returns. Note : Rail Revenue Traffic = Total Rail Freight Traffic-Rails own Traffic. Reproduced from Bur? an, T'car.syrT* S+rvrist.ica.1 TXilXoiin 1975
30


31 -8- years, though with little change in the import portion, and then a rise (not shown in the table) in The 1975 traffic was well above that of the late 'fifties hut of course constituted a smaller percentage of "both total transport and GDP. The overall figures, however, disguise the changes in traffic on the various lines. The pattern, which appears in Fig. p > has been as follows: 1. The trend has "been upward in traffic on the main Khartoum-Port Sudan line in recent years, hut on no others. 2. Volume has been relatively constant, trendwise, on the Khartoum- El Obeid and S ennar-kassala-haiya lines. 3. All of the other lines all of the relatively light traffic lineshave shown a downward trend. The worst are the El Damazine line, which had lost three-fourths of its 1970 traffic by 1976, and the Wadi Haifa line, which had lost two-thirds. The Karima line had lost half of its traffic. As shown in Table 2, the pattern has been very different on different commodities. Petroleum products, fertilizer, cement, flour and wheat have done the best, whereas by far the most serious decline has been in cotton and cottonseed, a loss of more than half the traffic, on an item that was once the major category of traffic carried. Other oil seeds and oil cakes have fallen drastically as well. Other major items have remained much the same. The annual variations in export farm products are very great because of fluctuations in crop yields; these changes also affect imports by altering foreign exchange earnings. Table 2 also indicates the relative importance of various elements in recent years. Petroleum has been accounting for about one-fifth of the total traffic, and no other single item approaches it. Cotton and cotton seed,

32


33 t, H i * I 1SM H- C f» o. v 3 e 9 - r* **> * -i H 3 O^lrt» IS B M> 3 H> a 1 C (» rt rt B rr H» a t* in M B n O Q. 3 P- rr «n p- rt &. Bl a rt k H- O B. H a so c o* H g B a H 1 B H- P rr»* T> l-> VO rt -vl (6 l/> 1


34


35 -9- flour j wheat, cement, and sugar are the other major items, with comparable tonnages, followed by maize and millet, oil cake and oil seeds. Traffic Volume Table d.. indicates approximate traffic density on the various lines. The figures show tonnage on the lines. No ton mileage figures are availab* f but on most ot the lines, the tonnage indicated passes over the *»«+*-, and therefore the ton miles per mile and the tonnage figures are the same, rpv--^ *~.i_-,i +rue of the main lines. The heaviest traffic line i r the portion from Haifa to Port Sudan, which carries the main line traffic as G as thct of the Kassala line. The figures for the Khartoui,i-Atbara-H~ "'2a. portio " 5 s a" i c «---" r "-mion net con miles per mile of line; experience in the \ i and else: ro suggests that- such lines capture most of the economies of rz- "" ad co^tr exe lower than, those of road transport. Vi^-'^pss 4 - traffic lir-->.s, but with less than half that of the ^, asc.>-.-. lines from Khartoum through the Gezira to Sennar, itrom S ~ on to El Obeid, with nearly a million net ton miles = per riiile of lin-. Both portions of the Kassala line, from that city to Haifa -ui' to have traffic around 400,000 net ton miles, and the portion from 1 the EL 0-cid junction f the Babanousa junction is close to 300,000. The Nyala, Abu Hamed, sxui. Dama sine lines carry between 100,000 and 200,000; the remaining lines drop v:. 1 below 100,000. The long line from Abu Hamed to Wadi Halia the original line has only 55» 000 tn/m. The discouraging part is that these light tr? ific lineo are the ones that have experienced drastic dec] laes in traffic; f ve years ago their performance was much more respect'.?
36


37 -10- The result is substantial excess capacity, even on the main lines. On the basis of the data in the Transport Statistics Volume for 1975 the practical capacity and the actual number of trains per day in both directions, are shown in Table I. The segment from Haiya to Port Sudan, with 17 trains daily each way and a capacity of 21, is the closest to capacity, and the remainder of the main line is at about 50 percent of practical capacity. Typically 5 or 6 freight trains each way are operated daily on these segments. Khartoum-Sennar, with a capacity of 24 and actual of 9» comes next. S ennar-kassala and Kassala-Halfa segments average 5 freights daily, again with capacity around 20. The other relatively high capacity line, Atbara to Abu Hamed, averages only 2.4 freights a day. The other lines, with capacity of 7 to 12 trains a day, all have less than 3 a day* The average tonnage per wagon (freight car) is 21 metric tons (and has been for a decade); the average train hauls around 500 net tons (l,000 gross tons), and 24 cars per train. The percentage of loaded to empty cars is very good compared to many systems* around 80 percent. The most discouraging feature, however, has been the steadily lengthening turnaround time for freight cars; 10 days in 1965, it was 16.5 in Part of this reflects longer average haul, but much reflects loss in efficiency. Rail Rates and Costs In 1975» the overall costs of providing freight service (with, of course, a somewhat arbitrary allocation of costs between freight and passen-.wore ger service, but one that appears to be reasonable)/ Sudan L 19.8 million, to handle 2,274 million ton kilometers, or, in terms of IB cents, 3.2 cents


38


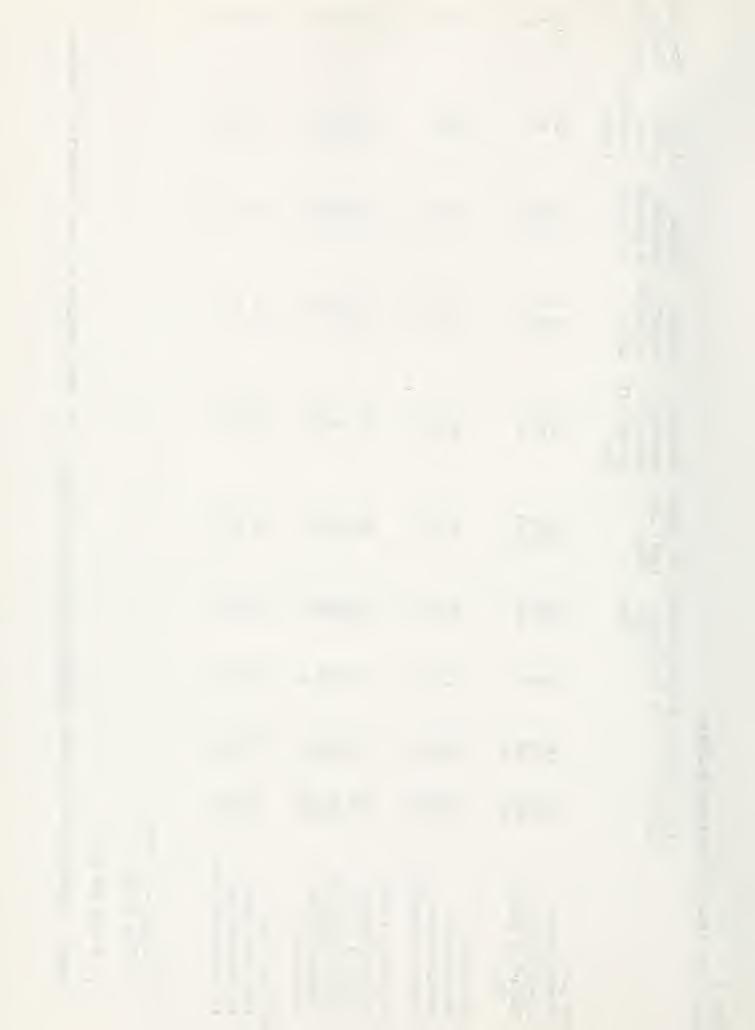
39 -11- per ton mile. The figure for the previous year was 2.8 cents; for 1971» 1.^3 cents. These figures, however, are based on the current official exchanpr^ rate, at which the Sudan L is clearly overvalued} if the L is overvalued by one- third, the cost figure would be 2 cents for 1975 or roughly the same as the average figure in the United States. While good cost data for road transport are not available for the Sudan, there is every indication that road transport costs as noted below are two to three times as high} in terms of transport costs, clearly the rail system is justified, though, as noted, drastic changes are required. Table k shows typical rail rates, for sample commodities, for a variety of distances. Unfortunately all published figures are for agricultural products; since these figures run higher than the average, the inevitable conclusion is that the goods are receiving lower rates. Several conclusions are suggested by these figures: 1. There is extremely little tapering of rates for the distances indicated} on dura, for example, the rate per ton mile is only slightly higher from Gedaref to Port Sudan than it is from Nyala, though the latter distance is more than 2-f- times as great. 2. There remains a substantial element of value of service rate making, a conclusion varified in various unpublished studies to which the author had access The rate structure has been subject to some reexamination in recent years, in effort to raise rates that are below out-of-pocket (marginal) cost and at least move in the direction of greater emphasis on cost and less on value of service. But; as noted, much of the latter remains.

40 i,. > r-- ''''/ o^- C"."* "' i h... :. iz\: " i.*'
 Sesame Ground Nuts El Damazine-Port Sudan 1255 780 Dura Sesame Ground Nuts Nyala-Port Sudan 2150")

41 -12- Tafcle 4 Typical Rail Rates Per Ton Mile, 1973, Sudan Points and Commodities KM MI Mill* of Sudan L per KM US per ton mile Gedaref-Port Sudan Dura (Sorghum) Sesame Ground Nuts El Damazine-Port Sudan Dura Sesame Ground Nuts Nyala-Port Sudan Dura Sesame Ground Nuts Khartoum-Port Sudan Cotton Cottonseed Wheat Oil Cakes ? Source of data: Sudan, Transport Statistical Bulletin, 1975* P«3&-


42 N


43 -13- Passenger Service Passenger traffic increased, but in a somewhat erratic fashion, up to , and then fell by about 20 percent. Current! the traffic is only about 10 percent greater than it was in 1955/56, thr>population has greatly increased. However, the average length of trip hedoubled in the last two decades; the present figure is 37^ kilometers (23^ miles). Accordingly, total passenger miles, reached an all time high in 197 it was double the figure of two decades earlier. Short-distance traffic has been lost to cars and buses, while long-distance traffic has increased rapi Domestic air service is extremely expensive compared to rail and has scarce' affected the rail total. The domestic air travel figure is only 75» 000 a year, compared to 3 million rail passengers. Sudan Railways trains, like those of the old Rhodesia Railways, have four classes: First class (sleepers), and three others. Fourth class ror.:, the dominant type, with 60 percent of the passengers in 1975* but has fallen sharply from 85 percent in Third class has increased to 30 percent from 10 percent over that period, second from 4 to 8 percent, and sleepinfrom 1.9 to 3-5 percent. The sleeping car passengers, only k percent cf t: total, yield 20 percent of the revenue (1975) «The average fourth class fare in 1975 was $2.25 (US), for an average trip of 339 kilometers or 21 miles, or about one cent (US) per mile. The first class fare *- -^^ cents per mile. Domestic air fares range from 16 to 20 US cents per mile. Bus fares average about 2 US cents per ton mile. Basic data relating to passenger train frequency and speed is shown in Table I. Because the system does not consist of one main line plus 'branch' as do most African systems, the schedules differ from the common pattern.


44
.")

45 -14- But in general, service is less than daily. There are sixteen trains a week each way "between Khartoum, Wad Medani, and Sennar, and 10 a week between Khartoum and Atbara. Most of the rest of the main and secondary main lines receive service 3 times a week each way (the Haifa-Port Sudan segment, six, as the trains from both lines run on to Port Sudan). Trains to Sennar go on to El Obeid four times a week. At the other extreme, the lightest traffic branches Nyala, Wau, El Damazine, and Wadi Haifa have only twice-a-week service. The maximum speed permitted is relatively high for Africa, 60 kilometers per hour on the main and secondary main lines, 50 on the branches. The scheduled speeds are much lower typically around 30 km/hr, with the highest 39, from Haiya to Kassala, and the lowest 15 km/hr (about 9 miles an hour) Eabanousa to Wau. The scheduled time is 38 hours Khartoum-Port Sudan, 19 hours, Khartoum- El Obeid, and an incredible 100 hours, Port Sudan to War., four ctc.ys and four nights. But even worse is the actual typical elapsed time. In 1975» 97«^- percent of all passenger trains were latej it was noted in the report that this was an improvement over 1975 in which 99 >1 percent were late. Not only were they late, but the extent of lateness was little short of phenomenal, as noted in Table 5 below, for July Table 5 Lateness of Passenger Trains, Sudan Railwajs, July 1975 Scheduled time Deviation from schedule as percent of scheduled time Port Sudan-Khartoum Sennar-Kosti Kosti-El Obeid Khartoum-Sennar \? ('} Atbara-Wadi Haifa Wau-Babanousa 26?2 Atbara-Karima Port Sudan-Kassala Source: Sudan, Transport Statistical Bulletin, 1975.


46


47 -15- Thus, for example, the Port Sudan-Khartoum main line trains, scheduled for 30 hours, on the average took 5^ hours. The prize for lateness went to the relatively short Sennar-Kosti segment, averaging 12 hours instead of the scheduled 3 hours. The best performance was on the long line to Wau, only at 22 percent off schedule. The delays are partly /the terminals, partly as a result of seriously inadequate communications, plus general inefficiency in operation. The slow time and the lateness, plus the somewhat deteriorated equipment reflect a great departure from the service described by G. H. Kimble, in Tropica^ Africa, published in I960: "Over the years this line (Wadi Haifa-Khartoum) has come to be regarded, by those who know their railways, as one of the best in the world for service and cuisine and notwithstanding the great heat, for comfort also."-*- The passenger cars, painted what is initially a brilliant white to reflect the sun, carry shields on the top and sides in an effort to reduce the heat, as is done in some buildings in the Sudan. But the cars are not air-conditioned, and the dust and sand and engine smoke do little to relieve the incredible monotony of much of the Sudan countryside. The trip to Wadi Haifa, across an uninhabited desert, the stations numbered instead of named, would try the patience of the most devoted train rider? it makes the dreary Tanzania Central route seem like paradise. In past decades, when this a train connected with service on the Nile, it en joyed/ limited amount of tourist traffic (as late as 1962, East African Railways timetables showed through railroad-steamer service from Nairobi to Cairo.) The interesting feature is that despite all this, the passenger held up remarkably well. The explanation is to be found in rising incomes 1. New York: Twentieth Century Fund, i960, p. VJO.


48 :.-:. ':; ' - I


49 -16- of many, even if the average family real income has not risen; increased education; the abominable condition of the roads; and the extremely high air fares. Personnel, Equipment, and Track Up until 1973» the railway was employing about 40,000 persons a very high percentage of the estimated 250,000 wage earners in the country. The figure has fallen somewhat, to about 33» 000 in 1975 This compares, for example, with Zambia Railways, which has roughly half the ton mileage, and less than 10,000 employees. The United States railway system has about 12 times as many employees, but 70 times the mileage and 550 times the total traffic volume. The system used a wide variety of steam locomotives, most of British origin. Dieselization began in the 1950s, although steam power was acquired as late as 1956, and by the early sixties the main lines had been dieselized. In 1964 there were 67 diesels and 133 steam locomotives; by 1975 the figure of diesels had risen to 99t while there was still 107 steam locomotives. In general the steam power is used on the light traffic 50-pound rail lines. Unfortunately a great variety of dies el engines has been acquired partly because of grants and loans from various countries: United States, Great Britain, Germany, Japan, Belgium. This of course complicates repair. In 1975» 50 new main line diesels were added. As noted, the main lines have 90-pound rail; the secondary main lines, 75j the branches, 50-pound. Most of the former lines are estimated to be in relatively good condition, but the 50-pound branch lines have deteriorated.


50 ' '... : '.


51 -17- The shops and main offices of the railway are in Atbara, 195 miles north of Khartoum. One feature of the lines is the use of several major "bridges across the Blue Nile at Khartoum on a bridge shared with motor vehicle traffic, across the White Nile at Kosti on the route to El Obeid, one across the one Atbara at the city of Atbara and/ west of Kassala. The Kassala line crosses the Blue Nile on the dam at Sennar. Revenues and Earnings Prior to the late 1960s, Sudan Railways was a highly profitable undertaking, with operating ratios of 50 in 1938, averaging 68 in the period, and steadily improving in that period. The 1964 figure was 6l percent extremely high by any standards. But by the end of the decade the picture had reversed and deteriorated very rapidly in the 1970s. The average was 89. Up through 1972, as shown in Table 6, reproduced from the Transport Statistical Bulletin, operating expenses were covered, but the operating ratio rose to 8 7 in 1971 Subsequently, costs rose more rapidly than revenues under inflationary pressures, and thus operating losses have been incurred since 1972, with operating ratios between 104 and 110. The 1976 figures are likely to be somewhat better than those of 1975«The deficits, as well as funds for new capital outlays, are covered by the government. Passenger revenue is a minor segment of the total but not unimportant about 20 percent. With the cost allocation system used, passenger service shows some deficit, but this is not a large part of the total.


52 ."' i,. >: ' "!!
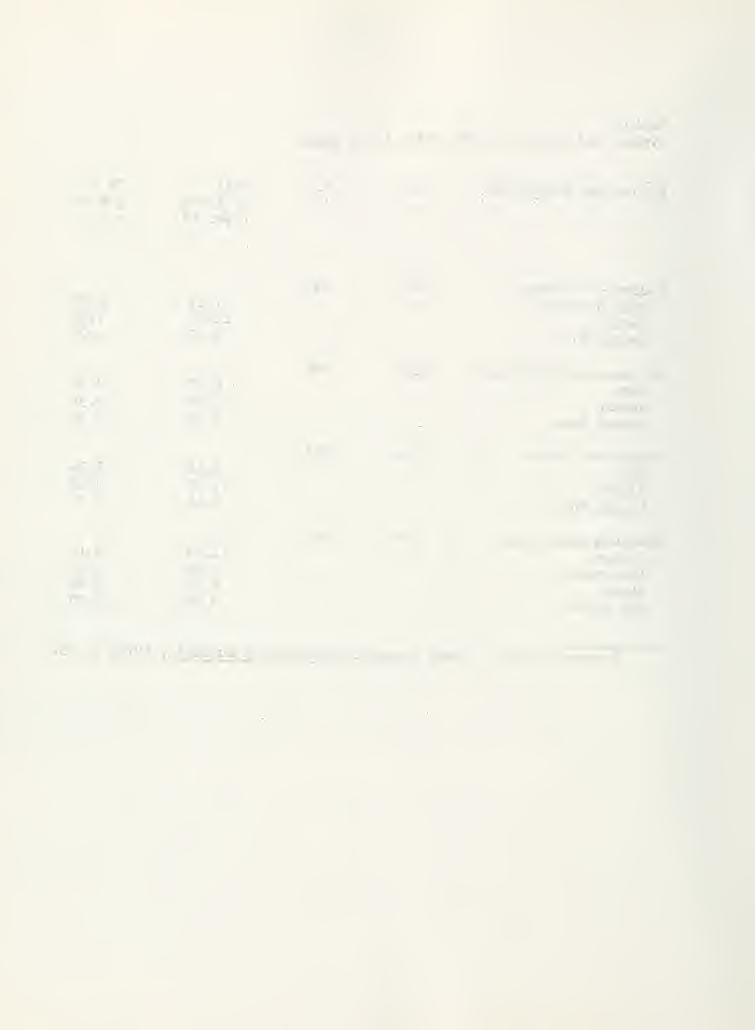
 Total Operating Costs Total Operating Operating Costs as a%of Revenue < Operating Revenue Passenger Operating Cost Passenger Operating Revenue")

53 t. PAKWACH ' Table 6. Sudan Railways Operating Costs and Revenue (LS Million) Total Operating Costs Total Operating Operating Costs as a%of Revenue < Operating Revenue Passenger Operating Cost Passenger Operating Revenue Operating costs as a % of Operating Revenue Operating Freight Freight costs as Operating Operating a % of Cost Revenue Operating Revenue Year Total Index Total Index Total Index Total Index Total Index Total Index 1968/ % % % 1969/ % % % 1970/ % % % 1971/ % % % 1972/ % % % 1973/ % % % 1974/75 " % % % Source: Sudan Railways Annual Reports. Reproduced from Sudan, Transport Statistical Bulletin, 1975 Fig. Konbasa-Cairo Through Service, Reproduced from East African Railways Timetable, Feb SUMMARY TABLE No 2 *3tt! itcmer Rcic St pan? Slffe-rcr Rail DEPARTURES SA... ih ': H'.t, SA MriU IS. b.; I5'.r- s.. ISth.. K 16lh i' 16:i :u 17- MIS am I2M at OLJO i m 9700 I5M ca,o ICIQ IMS I 2110 I oass KENYA AND UGANDA SUDAN AND EGYPT STATION OR PORT Eau African Ra'lways & Hi MOMBASA B MASINDI TOWN BUTIABA t i. \ NIMULE. Sudan njikj r i NtMULE JUBA KOSTI KHARTOUM Ho. ATBARA WAOI HALFA SHELLAL «;;.-»c r -,t'-- R5»'» =r! SHELLAL J (.UXOR * CAIRO STATION OR PORT ms 1300 OfiOO 1000 D ' I3IS B4O 1300 CAW :;oo :ooo 'u ii*: ' 20;". 7:r, Sir 2-<d 2-<d 111 i». DEPARTURES


54


55 -ia* Causes of Deterioration of Earnings--Loss~ of Efficiency There are two general and closely interrelated causes of the earnings deterioration, plus the effects of inflationary pressures not reflected in immediate rate changes; the first is the general decline in operating efficiency. This is manifest in the doubling of the turnaround time for freight cars over the last decade, the great increase in train delays, increased accidents and equipment failures, and many other facets. It is difficult to pinpoint the causes, but several are indicated "by persons who have examined the operations in detail: a. Complete centralization of management despite the very wide area served. b. Location of the headquarters in Atbara rather than Khartoum, with endless delays in coordinating decision making with the Ministry of Transport and other government agencies. Atbara is nearly 200 miles from Khartoum, there is no paved road, and the average train time is 18 hours. c. A generally "noncommercial" attitude on the part of the railway tendency throughout to carry on the old monopoly attitude that reflected the actual situation two decades ago but no longer does in other words, a failure to ao^pt to changed conditions. d. Low labor productivity, over staffing, and low employee morale. The productivity problems appear in part to reflect labor union policy; this is a strongly unionized sector of the economy. Apparently the wage structure is unrelated to work actually done. One cannot avoid the conclusion that the railway, despite reductions in recent years, is still greatly over staffed. e. A completely inadequate communications system, which increases delays and uncertainty.


56 '! -.} ' : ' J-... ' >'-'.


57 -19- f. Shortages of equipment, in turn aggravated by delays in repairs. The percentage of diesel locomotives out of service and under repair in 1975 was ko percent, compared to 20 percent in 1968 in other words, on the avenge during the year, nearly half of the road's diesels were out of service. Th* figure for the steam locomotives was 36 percent, compared to 20 percent in g. Lack of adequate planning for handling traffic changes. h. An inherent problem seasonality of traffic: the peak traffic is two-thirds greater than the low period traffic. Causes of Deterioration of Earnings Road Transport The rapid increase in road transport, in large part a product of inadequate quality of rail service, is the second cause of declining earnings. The cost of road transport is substantially greater, but the time saving is so great that shippers are willing to pay the greater cost. For example, between Port Sudan and Khartoum, the road transport time is from 2 to 3 dajsj by rail, priority freight may be delivered in 7 to 8 days, other freight from 10 to 15 days. The problem is not one of bad track or slow operating speeds, but rather from all indication 9, in terminal handling. Road transpc rt is able to make this good time despite the lack of a road to Port Sudan} much of the way the vehicles merely operate across desert tracks. No exact data of road transport traffic is available, but there are estimates. In 1970, total road transport volume was estimated to have been.-* about.9 billion ton kilometers; by 1976 it had risen to 2.6 billion, billion ton km, exceeding the rail volume, which was 2.1/ It is estimated that road transport is carrying half or more of the rapidly growing ground nut


58 ;np

 loads.")
59 -20- export traffic. Most of the road transport Is handled by small private firms; a person gets the money to acquire one lorry and invests his profits to expand his fleet. There are a few large operators. The Sudan-Kuwaiti firm, financed from Kuwait, has become a major operator. There are two government-owned firms. The number of lorries increased from 11,000 to 2^,000 from 1970 to 197^ alone; petrol for road use has doubled in this period: sales of diesel fuel had also doubled for 1966 to The most recent trend has been to use large tractor- trailer units with typical 35 metric ton (38.5 net ton) loads. Average traffic on various roads is shown on Table 7t and freight traffic of Sudan-Kuwaiti Transport in Table 8. Prior to the mid-fifties, and in large measure until the early 1970s, the railroad was protected from road transport, primarily by the failure to build roads; the philosophy of the government apparently was that roads were unne ssary; the railroad could handle the traffic, and tracks through the desert could be used in the dry season. In the 1930s the government actually prohibited road transport from Khartoum to Port Sudan, though it found enforcement difficult. Not until the mid-seventies was paving begun; the first paved road connected Khartoum with Wad Medani. As of 1976, there were only 400 km of paved road, 2,000 gravelled, out of a total of 18,000 km. In recent years, however, the government, despite its ownership of the railway, has pushed road transport because rail transport was so inadequate. There are no entry licensing o 3? rate controls, and transport vehicles are given favorable treatment under customs duties. 1. The policy is described by G. Wilkins, "Transport in the Sudan," in Ali Mohamed el Hassan, ed., An Introduction to the Sudan Economy (Khartoum University of Khartoum Press, 1977), pp

60 :.


61 Table 7. Average Daily Traffic on Roads in Sudan for 1973 Section Length Truck 0/ /o Bus "/ Light % Total % Atbara-Berber Khartoum-Wad Medani Wad Medani-Sennar Kassala-Gedarif Luiga-Gedarif too Sennar-Es Suki Es Suki-Rossciris I 283 too Singa-EI Damazine Rabak-Sennar Rabak-Ed Dueim Rabak-EI Jebelin Source: Louis Berger Inc., Report on Highway Design and Financing, Note: Only, those roads and tracks where the traffic counts in were 200 vehicles or more, are included. Ta 8. FRLIGHT TRAFFIC HANDLED BY THE SUDAN KUWAITI TRANSPORT COMPANY BY ROUTE AND DIRECTION OF MOVEMENT OCT. 15, APRIL 30, 1976 Route Distance Km Commodity Tons Carried Ton/Km. (Million) Khartoum - Port Sudan 1200 Oil Cakes 8, Port Sudan - Khartoum 1200 Cement 10, Maringan 1390 Jute Cloth & Soare Parts 4, ,, -Kassala 630 Cement 1, Maringan - Khartoum 190 Cotton Seed 8, New Haifa-Port Sudan 660 j» t* 4, Gedarif - Port Sudan 852 Dura 5, Port Sudan - Gedarif 852 Cement Gedarif - Khartoum 415 Dura 1, Sennar Khartoum 303 Miscellaneous 2, Total 48, Source: Sudan-Kuwaiti Transport Company Tables? and 8 are reproduced froia Sudan, Transport Statistical gulletin, 1975.

62
 Season (Hours) Khartoum-Wad")


63 Table 9. ( General Characteristics of Roads in the Sudan 1974/75 Low Travel Time Travel Time in Length Seaso- Capacity in Normal Low Capacity Km Type nality Period Season (Hours) Season (Hours) Khartoum-Wad Medani 187 Asphalt All _ 4 4 Khartoum-Atbara 312 Track All Khartoum-Kosti 312 Track Dry July-Oct Khartoum-El Obeid 413 Track All Khartoum-Kassala 400 Track Dry July-Oct. 14 Closed Khartoum-Dongola 547 Track All Port Sudan-Haiya 225 Track Dry July-Oct Port Sudan-Tokei' 160 Gravel All Kassala-Haiya 350 Track Dry July-Oct. 16 Closed Haiya-Atbara 291 Track Dry July-Oct Gedaxif-Kassala 223 Track Dry July-Oct. 9.5 Closed Gedarif-Gallabat 150 Track Dry July-Oct. 5.5 Closed Gedarif-Wad Medani* Sennar-Wad Medani 126 Track Dry July-Oct. 4.2 Closed Sennar-Kosti 103 Track Dry July-Oct. 3.5 Glossed Kosti-Malakal 508 Track Dry July-Oct. 21 Closed Kosti-El Obeid 320 Track Dry July-Oct El Obeid-Kadugli 298 Gravel All En Nahud-El Fasher 452 Track All El Obeid-En Nahud 215 Track All En Naliud-Wau 675 Track Dry July-Oct En Nahud-Nyala 523 Track Dry July-Oct Nyala-Wau 690 Track Dry July-Oct Nyala-Zalingi 205 Track Dry July-Oct Nya)a-El Fasher 225 Track AH El Fasher-Geneina 356 Track Dry July-Oct Sennar-Rosseires 248 Track Dry July-Oct Closed Dibeibat-Dillmg-Kadugli 186 Asphalt All Source: ADAR Transport Study (updated) * Almost 50% asphalt and the rest gravel 71 Reproduced from Sudan, Transport Statistical Bulletin, 1975.


64

 for a 35 ton load is from L200 to L400; for a load back to Khartoum, L600 to L700. These are roughly twice the rail rates.")
65 -21- The net effect has been to reduce rail volume materially on the light traffic lines, check its growth on the main lines despite increasing economic activity, and materially reduce rail earnings, since much of the traffic loss is in high-rate commodities. There appears, thus far, to have "been little "beneficial effect in stimulating greater rail efficiency. No good overall figures are available on road transport costs, "but figures are available on the Khartoum-Port Sudan traffic. The typical charge from Khartoum to Port Sudan (500 miles) for a 35 ton load is from L200 to L400; for a load back to Khartoum, L600 to L700. These are roughly twice the rail rates. In terras of US cents per ton mile, the outbound figures are 3 to 6 cents per ton mile, inbound figures, 8 to 9 cents per ton mile. The firms obviously regard the outbound haul as the back haul and q_uote low rates to obtain the traffic, but even these exceed most rail rates. A 1971 estimate indicated overall rail costs of L.0057 per ton-kilomete :, L.016 for heavy road transport. A recent unpublished estimate shows an overall rail cost figure of L.O075* 1.01 for road. Most figures suggest a greater differential, however. Traffic Outside the Rail Area In the southern portion of the country, there are no railroads, and all cargo must move by road or river. There is a certain amount of international trade with Uganda imports of coffee, exports of manufactured goods, and there are imports of petroleum and cement from Kenya, and some trade with Chad, which has no good outlet to the sea. Again, roads are mainly tracks and unusable in the wet season which is much more significant in the southern Sudan than it is in the north (see Table 9). There is a long -used track east and west across the Sudan, from Kosti and El Obeid through El Fasher


66


67 -22- lnto Chad, leading on to West Africa a route long used by caravans. Many pilgrims Taring cattle with them and sell them in the Sudan, using a route farther south, ending in Kosti. There is a road of a sort leading south from Kosti down the east side of the White Nile through Malakal to Juba and on into Uganda and into Zaire, but it is unsurfaced and unusable in wet weather. The primary form of transport from Kosti to Juba (1400 km) is by barge on the Nile; this is the major element in the water transport system* but is in urgent need of new equipment. Virtually all traffic is southbound. The only other stretch of water transport is from the end of the Karima rail line, across from Merowe, in the north, to Dongola (290 km) the so-called Dongola reach. Water transport accounts for only about 2 percent of the total transport volume in the country. Plans for the Future The government has made several attempts already to aid Sudan Railways by providing additional diesels and other equipment and obtaining foreign technical advice. The general policy, outlined in the new 6-year plan, is to provide the railways with substantial additional funds and various incentives to improve to give the railways a major opportunity to increase efficiency. The predicted increase in rail traffic for the next six years Is greater than the predicted increase in road traffic, to bring each to about ^ 5 billion ton/km in The primary reason for this emphasis on rail transport is the substantially lower cost of volume movements by rail. 1. J. S. Birks, "The Mecca Pilgrimages by West African Pastoral Nomads," Journal of. Modem African Studies, Vol. 56/ March 1977} pp. ^7-58.


68 3 ;),


69 -23- At the same time, however, large amounts will "be spent on road improvements! ajid within a year a paved road will he completed from Khartoum to Port Sudan. A major change in the transport picture will he brought about by the completion of the petroleum products pipeline from Port Sudan to Khartoum within the next year (the project has run well behind schedule). Petroleum now accounts for about 25 percent of the railway's revenue (just as it does in East Africa) ; the heavy movement is on the route that the pipeline will parallel. One point of view is that the removal of the petroleum traffic will allow much greater efficiency in the handling of the other traffic; the other is that the net effect will be to increase the railway's deficit materially. The key to success for the railway is not merely funds for additional equipment; it would appear that the two most important requirements are (l) reorganization in management and steps to improve labor relations, to gain greater efficiency, and (2) further revision in tariff structures, to enable the railway to obtain the traffic for which it has the greatest comparative advantage. Conclusion It is generally recognized that inadequate transportation has been a major obstacle to economic development in the Sudan. The inefficiency in recent years of the rail system and the very limited road development have without question hampered development. Difficulties with the railway, in turn, led to increased attention to road transport and the building of the 1. Estimates call for expenditure of about L8? million in the period for rail improvements (locomotives, cars, track), L150 million for road improvements, Lll million for river transport. These are, of course, subject to change.


70 '»"'- 1. -I IV.


71 -2kpipeline which will aggravate the financial problems of the railway. Yet the potential is substantial: the rail system is one of the most extensive in Africa, covering virtually all the producing areas and towns except in the far south, and cost per ton kilometer is clearly less than that of road transport. The great problem is: how to improve rail efficiency, and to this the government is giving substantial attention. Sudan faces the same problem that confronts other African countries with substantial rail systems: rail costs are substantially lower than road transport costs with adequate traffic, but poor rail service results in diversion to road and improvements in nonrail facilities thus aggravating the problem with the railways. There are also long-range problems with the light traffic lines which are relatively long; unless traffic volume increases materially on these, it may be desirable ultimately to consider abandonment. This is not contemplated, quite wisely, at present. There is very little likelihood of any additional rail construction, except the rebuilding of the line into Suakin as this port is developed to supplement Port Sudan, now operating nearly to capacity. July Ik, 1976


72 '.' '

73
74
75 [ttn


76
IATA ECONOMIC BRIEFING DECEMBER 2008
 ECONOMIC BRIEFING DECEMBER 28 THE IMPACT OF RECESSION ON AIR TRAFFIC VOLUMES Recession is now forecast for North America, Europe and Japan late this year and into 29. The last major downturn in air traffic,
Thank you for participating in the financial results for fiscal 2014.
 Thank you for participating in the financial results for fiscal 2014. ANA HOLDINGS strongly believes that safety is the most important principle of our air transportation business. The expansion of slots
Module 1 Educator s Guide: Representative Discussion Points Investigation 3
 Module 1 Educator s Guide: Representative Discussion Points Investigation 3 Ethiopia and Eritrea Our combined population is 59,578,171 people. We have just emerged from a long period of civil war and famine.
All of this week s homework is intended to help you get to know more about the country of Sudan, where Kek is from in Home of the Brave.
 Name: Week 7 Homework All of this week s homework is intended to help you get to know more about the country of Sudan, where Kek is from in Home of the Brave. On the map above, do the following things:
THE NETHERLANDS ANTILLES: TRADE AND INTEGRATION WITH CARICOM (REVISITED)
") GENERAL LC/CAR/G.763 2 December 2003 ORIGINAL: ENGLISH THE NETHERLANDS ANTILLES: TRADE AND INTEGRATION WITH CARICOM (REVISITED) T a b le o f contents Introduction... 1 Trends in the Netherlands Antilles
GENERAL LC/CAR/G.763 2 December 2003 ORIGINAL: ENGLISH THE NETHERLANDS ANTILLES: TRADE AND INTEGRATION WITH CARICOM (REVISITED) T a b le o f contents Introduction... 1 Trends in the Netherlands Antilles
North Africa. Chapter 25. Chapter 25, Section
 Chapter 25, Section World Geography Chapter 25 North Africa Copyright 2003 by Pearson Education, Inc., publishing as Prentice Hall, Upper Saddle River, NJ. All rights reserved. Chapter 25, Section World
1.0 Introduction Zambia s Major Trading Partners Zambia s Major Export Markets... 4
 Bank of Zambia CONTENTS 1.0 Introduction... 3 2.0 Zambia s Major Trading Partners... 3 3.0 Zambia s Major Export Markets... 4 4.0 Major Source Countries Of Zambia s Imports... 5 5.0 Direction Of Trade
Putting Museums on the Tourist Itinerary: Museums and Tour Operators in Partnership making the most out of Tourism
 1 of 5 ICME papers 2002 Putting Museums on the Tourist Itinerary: Museums and Tour Operators in Partnership making the most out of Tourism By Clare Mateke Livingstone Museum, P O Box 60498, Livingstone,
July 2014 Volume 6. Figure 1: Main Staple Food Commodities Informally Traded Across Selected Borders in Eastern Africa Between January and June 2014
 July 2014 Volume 6 Figure 1: Main Staple Food Commodities Informally Traded Across Selected Borders in Eastern Africa Between January and June 2014 The Market Analysis Sub-group of the Food Security and
COUNTRY CASE STUDIES: OVERVIEW
 APPENDIX C: COUNTRY CASE STUDIES: OVERVIEW The countries selected as cases for this evaluation include some of the Bank Group s oldest (Brazil and India) and largest clients in terms of both territory
Transforming Intra-African Air Connectivity:
 z Transforming Intra-African Air Connectivity: The Economic Benefits of Implementing the Yamoussoukro Decision PREPARED FOR IATA in partnership with AFCAC and AFRAA PREPARED BY InterVISTAS Consulting LTD
BUSINESS OPPORTUNITIES IN TANZANIA
 BUSINESS OPPORTUNITIES IN TANZANIA FACT PACK June 2015 Business Sweden in Nairobi TANZANIA BRIEF FACTS BASIC FACTS Population: 49,639,138 (2014) Area: 947,300* sq. km Capital: Dar es Salaam Languages:
TRANSPORT AFFORDABILITY INDEX
 TRANSPORT AFFORDABILITY INDEX Report - December 2016 AAA 1 AAA 2 Table of contents Foreword 4 Section One Overview 6 Section Two Summary of Results 7 Section Three Detailed Results 9 Section Four City
Economic Impact of Tourism in Hillsborough County September 2016
 Economic Impact of Tourism in Hillsborough County - 2015 September 2016 Key findings for 2015 Almost 22 million people visited Hillsborough County in 2015. Visits to Hillsborough County increased 4.5%
Israeli-Egyptian Trade: In-Depth Analysis
 Israeli-Egyptian Trade: In-Depth Analysis YITZHAK GAL BADER ROCK MIDDLE EAST Contents Israeli-Egyptian Economic Relations 3 Israel s Trade With Egypt 6 Egypt s Trade With Israel in Context 10 The Israeli-Egyptian
III. TRADE IN COMMERCIAL SERVICES BY CATEGORY
 . TRADE IN COMMERCIAL SERVICES BY CATEGORY The Highlights Transportation services Rising seaborne trade and air traffic contribute to the increase of transportation services trade In a context of rising
Queensland Economic Update
 Queensland Economic Update Chamber of Commerce & Industry January 218 cciq.com.au Queensland Economic Update: Summary Economy State Final Demand (SFD) expanded by.2% in the September 217 quarter Household
Provincial Review 2016: Limpopo
 Provincial Review 2016: Limpopo Limpopo s growth since 2003 has been dominated by the mining sector, especially platinum, and by national construction projects. As a result, the provincial economy grew
LOCAL AREA TOURISM IMPACT MODEL. Wandsworth borough report
 LOCAL AREA TOURISM IMPACT MODEL Wandsworth borough report London Development Agency May 2008 CONTENTS 1. Introduction... 3 2. Tourism in London and the UK: recent trends... 4 3. The LATI model: a brief
Airlines across the world connected a record number of cities this year, with more than 20,000 city pair connections*
 1 Airlines across the world connected a record number of cities this year, with more than 20,000 city pair connections*. This is a 1,351 increase over 2016 and a doubling of service since 1996, when there
TRADE STATISTICS BULLETIN
 TRADE STATISTICS BULLETIN May 2014 Est. by Statistics Act 9 of 2011 Namibia Statistics Trade Statistics Bulletin, May 2014 Agency 1 MISSION STATEMENT In a coordinated manner we produce and disseminate
HIA-RP Data Residential Land Report
 HIA-RP Data Residential Land Report March Qtr 29 Land s Back on the Rise The latest HIA-RP Data Residential Land Report highlights a rebound in raw land values following some moderation over 28. Median
III. TRADE IN COMMERCIAL SERVICES BY CATEGORY
 .. TRADE IN COMMERCIAL SERVICES BY CATEGORY Transportation services China records impressive growth Exports of world transportation services reached $750 billion in 2007, an increase of 19 per cent, following
Federal Subsidies to Passenger Transportation December 2004
 U.S. Department of Transportation Bureau of Transportation Statistics Federal Subsidies to Passenger Transportation December 2004 Federal Subsidies to Passenger Transportation Executive Summary Recent
III. TRADE IN COMMERCIAL SERVICES BY CATEGORY
 .. TRADE IN COMMERCIAL SERVICES BY CATEGORY Transportation services China records impressive growth of world transportation services reached $750 billion in 2007, an increase of 19 per cent, following
AUGUST 2008 MONTHLY PASSENGER AND CARGO STATISTICS
 Inter-Office Memo Reno-Tahoe Airport Authority Date: October 2, 2008 To: Statistics Recipients From: Tom Medland, Director Air Service Business Development Subject: RENO-TAHOE INTERNATIONAL AIRPORT PASSENGER
Petrofin Research Greek fleet statistics
 Petrofin Research 2 nd part of Petrofin Research : Greek fleet statistics In this 2 nd part of Petrofin research, the Greek Fleet Statistics, we analyse the composition of the Greek fleet, in terms of
Provincial Review 2016: KwaZulu-Natal KwaZulu-Natal
 Provincial Review 2016: KwaZulu-Natal KwaZulu-Natal KwaZulu-Natal has a strong role in South Africa s manufacturing and agriculture, and has its largest port and main North-South freight corridor. Its
Statistics of Air, Water, and Land Transport Statistics of Air, Water, and Land. Transport Released Date: August 2015
 Statistics of Air, Water, and Land Transport 2014 2013 1 Released Date: August 2015 Table of Contents Introduction... 4 Key Points... 5 1. Air Transport... 6 1.1 Aircraft movements... 6 1.2 Number of passengers...
1.0 Introduction Zambia s Major Trading Partners Zambia s Major Export Markets... 4
 Bank of Zambia CONTENTS 1.0 Introduction... 3 2.0 Zambia s Major Trading Partners... 3 3.0 Zambia s Major Export Markets... 4 4.0 Major Source Countries Of Zambia s Imports... 5 5.0 Direction Of Trade
SHIP MANAGEMENT SURVEY. January June 2018
 CENTRAL BANK OF CYPRUS EUROSYSTEM SHIP MANAGEMENT SURVEY January June 2018 INTRODUCTION The Ship Management Survey (SMS) is conducted by the Statistics Department of the Central Bank of Cyprus and concentrates
August Briefing. Why airport expansion is bad for regional economies
 August 2005 Briefing Why airport expansion is bad for regional economies 1 Summary The UK runs a massive economic deficit from air travel. Foreign visitors arriving by air spent nearly 11 billion in the
JET AIRWAYS (I) LTD. Presentation on Financial Results Q July 24, 2009
 LTD. Presentation on Financial Results Q July 24, 2009") JET AIRWAYS (I) LTD Presentation on Financial Results Q1 2010 July 24, 2009 1 1 1 Agenda Domestic operating environment Jet Airways performance highlights JetLite performance highlights Outlook 2 2 2 Domestic
JET AIRWAYS (I) LTD Presentation on Financial Results Q1 2010 July 24, 2009 1 1 1 Agenda Domestic operating environment Jet Airways performance highlights JetLite performance highlights Outlook 2 2 2 Domestic
Key Indicators for South Sudan
 Key Indicators for South Sudan National Bureau of Statistics Fast Facts Total Population of South Sudan is 8.26 million Total Area of South Sudan is 644,329 sq. km More than half (51%) of the population
Geneva, November 2007
 Meeting on the Trade and Development Implications of Tourism Services for Developing Countries: UNCTAD XII pre-event Geneva, 19-20 November 2007 FDI IN TOURISM AND COMPETITIVENESS IN KENYA by Samuel MWAKUBO
IATA ECONOMICS BRIEFING AIRLINE BUSINESS CONFIDENCE INDEX OCTOBER 2010 SURVEY
 IATA ECONOMICS BRIEFING AIRLINE BUSINESS CONFIDENCE INDEX OCTOBER SURVEY KEY POINTS Results from IATA s quarterly survey conducted in October show business conditions continued to improve during the third
Press Release. Bilfinger 2017: Stable foundation laid for the future
 Press Release February 14, 2018 Bilfinger 2017: Stable foundation laid for the future Organic growth in orders received after three years of decline Trend reversal: Output volume better than expected Growth
The Economic Impact of Tourism in Hillsborough County, June 2018
 The Economic Impact of Tourism in Hillsborough County, 2017 June 2018 Table of contents 1) Key Findings for 2017 3 2) Local Tourism Trends 7 3) Trends in Visits and Spending 12 4) The Domestic Market 19
Air China Limited Announces 2009 Annual Results
 Air China Limited Announces 2009 Annual Results Record Operating Profit in Complex Market Environment Strengthened Position to Capture Growth Opportunities Hong Kong April 22, 2010 Air China Limited (
The Economic Impact of Tourism in Hillsborough County. July 2017
 The Economic Impact of Tourism in Hillsborough County July 2017 Table of contents 1) Key Findings for 2016 3 2) Local Tourism Trends 7 3) Trends in Visits and Spending 12 4) The Domestic Market 19 5) The
FY Year End Performance Report
 Overall Ridership Big Blue Bus carried 18,748,869 passengers in FY2014-2015, a 0.3% reduction from the year prior. This negligible reduction in ridership represents the beginnings of a reversal from a
2016 Annual Tourism Performance Report.
 2016 Annual Tourism Performance Report www.visitqatar.qa Introduction Amidst great uncertainty, 2016 was a year full of challenges for many of the world s economies. The impacts of Brexit, the prospect
IATA ECONOMIC BRIEFING FEBRUARY 2007
 IATA ECONOMIC BRIEFING FEBRUARY 27 NEW AIRCRAFT ORDERS KEY POINTS New aircraft orders remained very high in 26. The total of 1,834 new orders for Boeing and Airbus commercial planes was down slightly from
PREMIUM TRAFFIC MONITOR JULY 2014 KEY POINTS
 PREMIUM TRAFFIC MONITOR JULY 2014 KEY POINTS Growth in international air passengers was weak for a second consecutive month with a 2.6% increase in July compared to a year ago premium seat numbers rose
IATA ECONOMICS BRIEFING
 IATA ECONOMICS BRIEFING NEW AIRCRAFT ORDERS A POSITIVE SIGN BUT WITH SOME RISKS FEBRUARY 26 KEY POINTS 25 saw a record number of new aircraft orders over 2, for Boeing and Airbus together even though the
Index of business confidence. Monthly FTK (Billions) Sep 2013 vs. Sep 2012 YTD 2013 vs. YTD 2012 Sep 2013 vs. Aug 2013
 Sep 2013 vs. Sep 2012 YTD 2013 vs. YTD 2012 Sep 2013 vs. Aug 2013") AIR PASSENGER MARKET ANALYSIS SEPTEMBER 2013 KEY POINTS Air travel markets expanded at a solid rate in September. Global revenue passenger kilometers were up 5.5% compared to a year ago. This is a slight
AIR PASSENGER MARKET ANALYSIS SEPTEMBER 2013 KEY POINTS Air travel markets expanded at a solid rate in September. Global revenue passenger kilometers were up 5.5% compared to a year ago. This is a slight
Economy 3. This region s economy was based on agriculture. 4. This region produced items such as textiles, iron, and ships in great quantities. For th
 Geography 1. This region has a climate of warm summers and snowy cold winters. 2. This region has a climate that is generally warm and sunny, with long, hot, humid summers, and mild winters, and heavy
1.0 Introduction Zambia s Major Trading Partners Zambia s Major Export Markets... 4
 Bank of Zambia CONTENTS 1.0 Introduction... 3 2.0 Zambia s Major Trading Partners... 3 3.0 Zambia s Major Export Markets... 4 4.0 Major Source Countries Of Zambia s Imports... 5 5.0 Direction Of Trade
China Interests in Sub-Saharan Africa. Economic and Political Interests between the Growing Superpower and Continent
 China Interests in Sub-Saharan Africa Economic and Political Interests between the Growing Superpower and Continent China s Current Situation Rapidly growing economy o GDP growth rate ~10% in last 3 decades
SHIP MANAGEMENT SURVEY. July December 2017
 SHIP MANAGEMENT SURVEY July December 2017 INTRODUCTION The Ship Management Survey is conducted by the Statistics Department of the Central Bank of Cyprus and concentrates primarily on transactions between
Federal Budget Submission. Prepared for the House of Commons Standing Committee on Finance. Greater Toronto Airports Authority
 2018-2019 Federal Budget Submission Prepared for the House of Commons Standing Committee on Finance Greater Toronto Airports Authority - August 2017 - Contact: Lorrie McKee Director, Public Affairs and
HEATHROW COMMUNITY NOISE FORUM
 HEATHROW COMMUNITY NOISE FORUM 3Villages flight path analysis report January 216 1 Contents 1. Executive summary 2. Introduction 3. Evolution of traffic from 25 to 215 4. Easterly departures 5. Westerly
Queensland Economic Update
 Queensland Economic Update Chamber of Commerce & Industry March 2018 cciq.com.au Queensland Economic Update: Summary National Accounts GDP expanded 2.3% during calendar year 2017. QLD state final demand
US $ 1,800 1,600 1,400 1,200 1,000
 IATA ECONOMIC BRIEFING JULY 9 INFRASTRUCTURE COSTS SUMMARY Historical data indicates that during recession periods infrastructure providers usually increase their prices while other prices are falling
PROMOTING INNOVATION AND TRADE IN HORTICULTURE 25-27th NOVEMBER 2015, KIGALI,RWANDA
 PROMOTING INNOVATION AND TRADE IN HORTICULTURE 25-27th NOVEMBER 2015, KIGALI,RWANDA FACTS AND FIGURES Introduction The Common Market for Eastern and Southern Africa was formed in 1994 as it replaced the
ANNUAL REPORT AIR TRAFFIC STATISTICS 2010/11 FINANCIAL YEAR
 ANNUAL REPORT AIR TRAFFIC STATISTICS 2010/11 FINANCIAL YEAR Released by Civil Aviation Authority of Botswana Department of Air Transport August 2011 ANNUAL REPORT: AIR TRAFFIC STATISTICS FOR THE 2010/
North Africa and Southwest Asia. Economic Geography
 North Africa and Southwest Asia Economic Geography Natural Resources Oil is the major resource in this region. Many countries in this region are members of OPEC (Organization of Petroleum Exporting Countries).
UGANDA S URBAN DEVELOPMENT; A SCRUTINY OF TRANSPORT PLANNING AND MOBILITY IN TOWNS AND CITIES
 UGANDA S URBAN DEVELOPMENT; A SCRUTINY OF TRANSPORT PLANNING AND MOBILITY IN TOWNS AND CITIES BY Mutabazi Sam Stewart Executive Director Uganda Road Sector Support Initiative (URSSI) P.O Box 11110 Kampala,
CUSTOMS AND BORDER PROTECTION (CBP) STAFFING
 STAFFING") CUSTOMS AND BORDER PROTECTION (CBP) STAFFING The Ask The Customs and Border Protection (CBP) staffing issue is critical to Port Everglades and Fort Lauderdale- Hollywood International Airport because these
CUSTOMS AND BORDER PROTECTION (CBP) STAFFING The Ask The Customs and Border Protection (CBP) staffing issue is critical to Port Everglades and Fort Lauderdale- Hollywood International Airport because these
The influence of producer s characteristics on the prospects and productivity of mastic farms on the island of Chios, Greece
 The influence of producer s characteristics on the prospects and productivity of mastic farms on the island of Chios, Greece H. Theodoropoulos* and C. D. Apostolopoulos Harokopio University, El. Venizelou
CAMPER CHARACTERISTICS DIFFER AT PUBLIC AND COMMERCIAL CAMPGROUNDS IN NEW ENGLAND
 CAMPER CHARACTERISTICS DIFFER AT PUBLIC AND COMMERCIAL CAMPGROUNDS IN NEW ENGLAND Ahact. Early findings from a 5-year panel survey of New England campers' changing leisure habits are reported. A significant
ECONOMIC REFORMS AND THEIR IMPACT ON CIVIL AVIATION. CIVIL AVIATION - AN ECONOMIC CATALYST. WIDER SPIN-OFF BENEFITS.
 ECONOMIC REFORMS AND THEIR IMPACT ON CIVIL AVIATION ECONOMIC REFORMS AND THEIR IMPACT ON CIVIL AVIATION. CIVIL AVIATION - AN ECONOMIC CATALYST. WIDER SPIN-OFF BENEFITS. CHAPTER - 4 ECONOMIC REFORMS AND
Tourism in numbers
 Tourism in numbers 2013-2014 Glenda Varlack Introduction Tourism is a social, cultural and economic experience which involves the movement of people to countries or places outside their usual environment
Citi Industrials Conference
 Citi Industrials Conference June 13, 2017 Andrew Levy Executive Vice President and Chief Financial Officer Safe Harbor Statement Certain statements included in this presentation are forward-looking and
DFDS A/S H Analyst meeting 30 August 2006
 DFDS A/S H1 2006 Analyst meeting 30 August 2006 DFDS A/S Contents The half-year in brief Strategy on track DFDS Seaways DFDS Tor Line Half-year accounts & profit forecast 2006 DFDS A/S H1 2006 in brief
WHO Regional Committee for the Eastern Mediterranean Sixty-fifth session, Khartoum, Sudan October Information bulletin 1
 WHO Regional Committee for the Eastern Mediterranean Sixty-fifth session, Khartoum, Sudan 15 18 October 2018 Information bulletin 1 1 Introduction Provinces Sudan has a federal government structure with
20-Year Forecast: Strong Long-Term Growth
 20-Year Forecast: Strong Long-Term Growth 10 RPKs (trillions) 8 Historical Future 6 4 2 Forecast growth annual rate 4.8% (2005-2024) Long-Term Growth 2005-2024 GDP = 2.9% Passenger = 4.8% Cargo = 6.2%
El Al Israel Airlines announced today its financial results for the year 2016 and the fourth quarter of the year:
 El Al Israel Airlines announced today its financial results for the year 2016 and the fourth quarter of the year: The Company's revenues in 2016 amounted to approx. USD 2,038 million, compared to approx.
LIVERPOOL CITY CENTRE. Commercial Office Market Review 2005
 LIVERPOOL CITY CENTRE Commercial Office Market Review 2005 SUMMARY Liverpool s office market is changing beyond recognition, with newly-built offices, increasing demand from professional and financial
Worldwide Fleet Forecast
 Worldwide Fleet Forecast Presented to: Montreal June 6, 26 DAVID BECKERMAN Director, Consulting Services Agenda State of the Industry Worldwide Fleet Regional Jets Narrowbody Jets Large Widebody Jets Freighter
WEST AFRICAN SUBREGIONAL STRATEGY FOR THE SECOND UNITED NATIONS TRANSPORT AND COMMUNICATIONS DECADE
 d^ UNDP/ECA PROJECT RAF/89/016 PREPARATION OF UNTACDA II DOC/UNTACDA/90/IA/6 15 DECEMBER 1990 ECONOMIC COMMISSION FOR AFRICA WEST AFRICAN SUBREGIONAL STRATEGY FOR THE SECOND UNITED NATIONS TRANSPORT AND
Sub - Saharan Africa
 Sub - Saharan Africa 4/14/2015 Countries with Relative Importance GDP South Africa Gabon Botswana Land Size Sudan Chad Mozambique Madagascar Democratic Republic of the Congo (formerly Zaire) Population
East Africa Crossborder Trade Bulletin April 2011
 East Africa Crossborder Trade Bulletin April 2011 The Market Analysis Sub-group of the Food Security and Nutrition Working Group (FSNWG) monitors cross-border trade of 88 food commodities and livestock
Introduction 3. Accommodation 4. Ireland Market 5. Activity Providers, Attractions, Retail and Transport 6. Overseas Market Performance 7.
 Contents Page No: Introduction 3 Accommodation 4 Ireland Market 5 Activity Providers, Attractions, Retail and Transport 6 Overseas Market Performance 7 Prospects 8 Factors Impacting on Performance 9 Operational
Gerry Laderman SVP Finance, Procurement and Treasurer
 Gerry Laderman SVP Finance, Procurement and Treasurer Safe Harbor Statement Certain statements included in this release are forward-looking and thus reflect our current expectations and beliefs with respect
IGI Wallcoverings Sales Statistics. Operations in Report to Member Companies. 15 July Contents. Introduction 3
 IGI Wallcoverings Sales Statistics Operations in 2013 Report to Member Companies 15 July 2014 Contents Introduction 3 Summary of results for 2013 5 Sales by type of wallcovering 9 Sales by category of
CONTENTS Executive Summary... iii 1. Introduction Major Destinations for Zambia s Exports Major Source Countries for Zambia s
 Bank of Zambia CONTENTS Executive Summary... iii 1. Introduction... 1 2. Major Destinations for Zambia s Exports... 1 3. Major Source Countries for Zambia s Imports... 4 4. Conclusion... 6 ii Executive
United Nations Joint Logistics Centre Sudan Light Vehicle Convoy from Khartoum to Juba April 2007
 UNJLC South Sudan Office OCHA-AFEX Compound Juba, South Sudan United Nations Joint Logistics Centre Sudan Light Vehicle Convoy from Khartoum to Juba April 2007 Introduction: In April of 2007, UNJLC organized
Ethiopia: Tourism Market Insights 2017
 Ethiopia: Tourism Market Insights 2017 About Ethiopia Ethiopia is Africa s second-most populous country and according to the IMF has overtaken Kenya to become the largest economy in east Africa. Real GDP
International Civil Aviation Organization WORLDWIDE AIR TRANSPORT CONFERENCE (ATCONF) SIXTH MEETING. Montréal, 18 to 22 March 2013
 SIXTH MEETING. Montréal, 18 to 22 March 2013") International Civil Aviation Organization WORKING PAPER 5/3/13 English only WORLDWIDE AIR TRANSPORT CONFERENCE (ATCONF) SIXTH MEETING Montréal, 18 to 22 March 2013 Agenda Item 2: Examination of key issues
International Civil Aviation Organization WORKING PAPER 5/3/13 English only WORLDWIDE AIR TRANSPORT CONFERENCE (ATCONF) SIXTH MEETING Montréal, 18 to 22 March 2013 Agenda Item 2: Examination of key issues
Informal Cross Border Food Trade in Southern Africa
 Informal Cross Border Food Trade in Southern Africa Issue 6 November 6 Monthly Highlights: Overall informal trade in maize, rice and beans lower this season than past two seasons. Zambia s informal exports
Tourism Statistics
 Tourism Statistics 2006-2010 TABLE OF CONTENTS FOREWORD 4 DEFINITIONS 5 STATISTICAL SUMMARY FOR 2010 6 INTERNATIONAL TOURIST ARRIVALS 7 International Tourist Arrivals: 1994-2010 7 International Tourist
Contribution from UNCTAD dated: 29 June 2010
 Report of the UN Secretary-General: Necessity of ending the economic, commercial and financial embargo imposed by the United States of America against Cuba (A/65/83) Contribution from UNCTAD dated: 29
Informal Cross Border Food Trade in Southern Africa
 Monthly Highlights: Observed informal cross border trade in maize, rice and beans continue to decline as demand for imports declines in Malawi and Zambia due to favorable harvests. Maize prices are lower
A i Q C a p i t a l M a n a g e m e n t L i m i t e d
 A i Q C a p i t a l M a n a g e m e n t L i m i t e d NIGERIA Nigeria is a middle income, mixed economy and emerging market with expanding financial, service, communications, and entertainment sectors
Network of International Business Schools
 Network of International Business Schools WORLDWIDE CASE COMPETITION Sample Case Analysis #1 Qualification Round submission from the 2015 NIBS Worldwide Case Competition, Ottawa, Canada Case: Ethiopian
Bilfinger Berger: Preliminary Report on the 2004 Financial Year
 Bilfinger Berger AG Carl-Reiss-Platz 1-5 68165 Mannheim Germany www.bilfingerberger.com Contact: Sascha Bamberger Phone: +49 6 21/4 59-24 55 Fax: +49 6 21/4 59-25 00 E-mail: sbam@bilfinger.de Date: February
WORLD TRADE ORGANIZATION
 WORLD TRADE ORGANIZATION Trade Policy Review Body RESTRICTED 1 October 2007 (07-3988) Original: English TRADE POLICY REVIEW Report by SAINT KITTS AND NEVIS Pursuant to the Agreement Establishing the Trade
AEROFLOT ANNOUNCES FY 2017 IFRS FINANCIAL RESULTS
 AEROFLOT ANNOUNCES FY 2017 IFRS FINANCIAL RESULTS Moscow, 1 March 2018 Aeroflot Group ( the Group, Moscow Exchange ticker: AFLT) today publishes its audited financial statements in accordance with International
The Economic Impact of Tourism on the District of Thanet 2011
 The Economic Impact of Tourism on the District of Thanet 2011 Prepared by: Tourism South East Research Unit 40 Chamberlayne Road Eastleigh Hampshire SO50 5JH CONTENTS 1. Summary of Results 1 2. Table of
Estimates of the Economic Importance of Tourism
 Estimates of the Economic Importance of Tourism 2008-2013 Coverage: UK Date: 03 December 2014 Geographical Area: UK Theme: People and Places Theme: Economy Theme: Travel and Transport Key Points This article
CONTENTS Executive Summary... iii 1. Introduction Major Destinations for Zambia s Exports Major Source Countries for Zambia s
 Bank of Zambia CONTENTS Executive Summary... iii 1. Introduction... 1 2. Major Destinations for Zambia s Exports... 1 3. Major Source Countries for Zambia s Imports... 4 4. Conclusion... 6 ii Executive
29 December Canada Transportation Act Review Secretariat 350 Albert Street Ottawa ON K1A 0N5
 29 December 2014 BHP Billition Canada Inc. 130 3rd Avenue South Saskatoon SK S7K 1L Canada Tel +1 306 385 8400 www bhpbilliton.com Canada Transportation Act Review Secretariat 350 Albert Street Ottawa
The Hotel Industry: The United States, Virginia And Hampton Roads
 The Hotel Industry: The United States, Virginia And Hampton Roads THE HOTEL INDUSTRY: THE UNITED STATES, VIRGINIA AND HAMPTON ROADS Do not forget to show hospitality to strangers. Hebrews 12:2 This chapter
INFRASTRUCTURE DEVELOPMENT IN TANZANIA
 INFRASTRUCTURE DEVELOPMENT IN TANZANIA PROF JOSEPH MSAMBICHAKA MBEYA UNIVERSITY OF SCIENCE AND TECHNOLOGY 50 TH YEARS ERB ANNIVERSARY 5 TH TO 7 TH SEPTEMBER 2018 PRESENTATION LAYOUT 1. DEFINITION OF INFRASTRUCTURE
Informal Cross Border Food Trade in Southern Africa
 Informal Cross Border Food Trade in Southern Africa Issue 78 August 212 Inside this issue: Summary and Overview Summary of Maize trade flows Summary of rice trade flows Summary of bean trade flows Annex
Recent EconomicTrends
 Recent EconomicTrends in South Florida by REINHOLD P. WOLFF* OR THE LAST FIFTY YEARS the history of South Florida hlas been closely connected with the history of transportation in the United States. The
JET AIRWAYS (I) LTD. Presentation on Financial Results Q4 FY08
 LTD. Presentation on Financial Results Q4 FY08") JET AIRWAYS (I) LTD Presentation on Financial Results Q4 FY08 June 24, 2008 1 1 1 Agenda Domestic operating environment Jet Airways performance highlights JetLite performance highlights Consolidated Jet
JET AIRWAYS (I) LTD Presentation on Financial Results Q4 FY08 June 24, 2008 1 1 1 Agenda Domestic operating environment Jet Airways performance highlights JetLite performance highlights Consolidated Jet
Happy Jetting. A Conversation With Dave Barger, President And Chief Executive Officer, JetBlue Airways, Page 14.
 A MAGAZINE FOR AIRLINE EXECUTIVES 2009 Issue No. 2 Taking your airline to new heights Happy Jetting A Conversation With Dave Barger, President And Chief Executive Officer, JetBlue Airways, Page 14. 11
Changi Airport Group releases FY2011/12 Annual Report
 Media Release Changi Airport Group releases FY2011/12 Annual Report SINGAPORE, 14 September 2012 Changi Airport Group (CAG) today released its annual report for the financial year ended 31 March 2012 (FY11/12).