Where are the poor: Region and District Poverty Estimates for Tanzania, 2012
|
|
|
- Marian Short
- 5 years ago
- Views:
Transcription

1 Where are the poor: Region and District Poverty Estimates for Tanzania, 2012 Blandina Kilama SK Conference Room, Umoja House Building, Ground Floor 30 June 2016
2 Outline Overview Population, GDP, and Employment Information on poverty Where are the poor? How was poverty mapping done What are the results? Concluding remarks?
 F: 23m (51.")
3 Intro Population level, rate, structure, momentum and spatial distribution. TZ : 44,9m M: 21.8m (48.7%) F: 23m (51.3%) Source: NBS 2013 Population and Housing Census
4 Intro. Population level, rate, structure, momentum and spatial distribution. TZ : 44.9m Rural: 31.6m (70.4%) Urban: 13.3m (29.6%) TANZANIA (RURAL) TANZANIA (URBAN) TANZANIA 80+ TANZANIA Male Female Male Female Source: NBS 2013 Population and Housing Census
5 Intro... Sectoral composition of GDP selected years (current prices) Economic Activity Agriculture Industry Service 1992 NA series (as % of GDP at factor costs) 2001 NA series (as % of GDP at bp) 2007 NA series (as % of GDP at bp) ,336 1,658,275 3,406,146 2,789,853 5,690,446 7,181,357 26,380, % 48.0% 44.7% 32.9% 29.6% 26.8% 29.7% 47, ,885 1,215,091 1,638,459 4,431,057 5,406,038 18,742, % 14.2% 15.9% 19.3% 23.1% 20.2% 21.1% 116,449 1,440,356 3,161,164 4,139,962 9,076,622 12,692,496 38,388, % 41.7% 41.5% 48.8% 47.3% 47.4% 43.3% GDP 302,683 3,452,559 7,624,616 8,488,274 19,198,125 26,770,432 88,757,797 Source: National Bureau of Statistics, 1999; 2006; 2012, 2014
6 Intro... Employed Population by main activity Industry Agriculture Industry Service Total Employed Currently Employed Population (Main Activity Only) 1- Total 2- Informal 1990/91* 2000* 2006** 1990/91* 2000* 2006** 9,164,059 13,253,395 12,713,234 13,160 40,272 19, % 85.4% 76.5% 1.4% 2.8% 1.2% 445, , , , , , % 2.1% 4.3% 27.7% 17.8% 20.3% 1,279,449 1,935,538 2,560, ,543 1,143,487 1,321, % 12.5% 15.4% 70.9% 79.4% 78.5% 10,889,205 15,521,229 16,627, ,647 1,439,847 1,682,383 Source: NBS (2007), table 1 (annex); NBS (2012) National Accounts , table 3.
7 Intro - Employed Population by secondary activity Industry Agriculture/ hunting/ forestry Mining & quarry Manufacturing Construction Wholesale & retail trade Hotels & restaurants Transport/storage & communication Other community/social & personal service activities Currently Employed Population ( Secondary Activity Only) Total Informal Male Female Total Male Female Total 1,218, ,391 1,792, ,175 18, , % 12.3% 22.2% 10.7% 1.8% 6.5% 256, , , , , , % 6.4% 6.9% 18.7% 27.2% 22.7% 1,289 1,289 1,289 1, % 0.0% 0.0% 0.1% 0.0% 0.1% 625, ,099 1,121, , ,202 1,028, % 10.6% 13.9% 50.8% 45.5% 48.3% 76, , ,285 69, , , % 5.2% 4.0% 6.2% 22.6% 14.0% 51,882 3,144 55,026 31, , % 0.1% 0.7% 2.8% 0.1% 1.5% ,814 12,026 28, % 0.0% 0.0% 1.5% 1.2% 1.4% 854,801 3,013,198 3,867, ,022 16, , % 64.4% 47.9% 9.2% 1.6% 5.6% Totals 3,397,310 4,677,151 8,074,461 1,121,063 1,007,387 2,128,450 Source: Constructed by the authors using ILFS 2006, from Table C2 page 119 and Table D2 page 120
8 Current knowledge on poverty differential in Tanzania Information on consumption based poverty head count estimates are available in the Household Budget Survey reports (2011/12, 2007 and 2000/01 ) Using asset index generated from DHS as proxy for income poverty The best these two can do is to provide regional estimates given their respective sample sizes.
9 Current knowledge on poverty differential in Tanzania Population below poverty line original (HBS) Population below poverty line Adjusted estimate % std error estimate % std error Dar es Salaam Other Urban areas Rural areas Mainland Tanzania Poverty is a rural phenomenon. Source: Authors calculations using HBS 2011/12 and Census 2012
10 Where are the poor? We have seen differences between Dar es salaam, other urban and rural. Thus it is very likely that there are differences between regions and within regions. Knowledge on these lower level differences is crucial for policy development and planning.
11 Current knowledge on poverty differential in Tanzania Population below poverty line original (HBS) Population below poverty line Adjusted (HBS) estimate % std error estimate % std error Dar es Salaam Other Urban areas Rural areas Mainland Tanzania HBS is only representative for Dar es Salaam, Other urban and Rural only. To estimate poverty at lower levels there is a need to increase precision. Source: Authors calculations using HBS 2011/12 and Census 2012
12 Why Poverty Mapping Geographical variations - Visual aid Subnational data Scarce resource allocation Used for targeting and budgeting by: Policy makers NGO, FBOs and CSOs Development partners
13 How was poverty mapping done?.. We combine data from the 2011/12 HBS with the 2012 population census. This allows representative poverty estimates at levels below that of the region. Only estimates for Dar es Salaam and rural enumeration areas are provided. The estimates are results of modeling and simulations based on this modeling.
14 How was poverty mapping done? Stage 0: identify common variables in both survey and census. Stage 1: modeling of per adult equivalent consumption Stage 2: apply equation to the census data Stage 3: use GIS to map the obtained estimates
15 MODELING AND PREDICTION Stage 1: Data from household budget survey to predict exppc Regression analysis log(exppc) = β 0 + β 1 X 1 + β 2 X 2 + β n X n + U Output β 0 β 1 β 2 β n seβ Stage 2: Data from Census Calculation log(exppc) = β 0 + β 1 X 1 + β 2 X 2 + β n X n Estimated poverty and inequality for regions and districts Source: IFPRI, 2004
16 Results from Poverty Mapping
17 Dar es Salaam 5.2 Kilimanjaro Pwani Arusha Manyara 18.3 Morogoro 23.1 Katavi 23.9 Mbeya 24.3 Poverty Head count Njombe Mara Iringa Rukwa Dodoma Tanzania Simiyu Lindi Tabora Tanga Mtwara 33.9 Shinyanga 34.2 Ruvuma 34.9 Mwanza 35.3 Singida Kagera Geita 43.7 Kigoma


18 Poverty Head count Poverty Head count
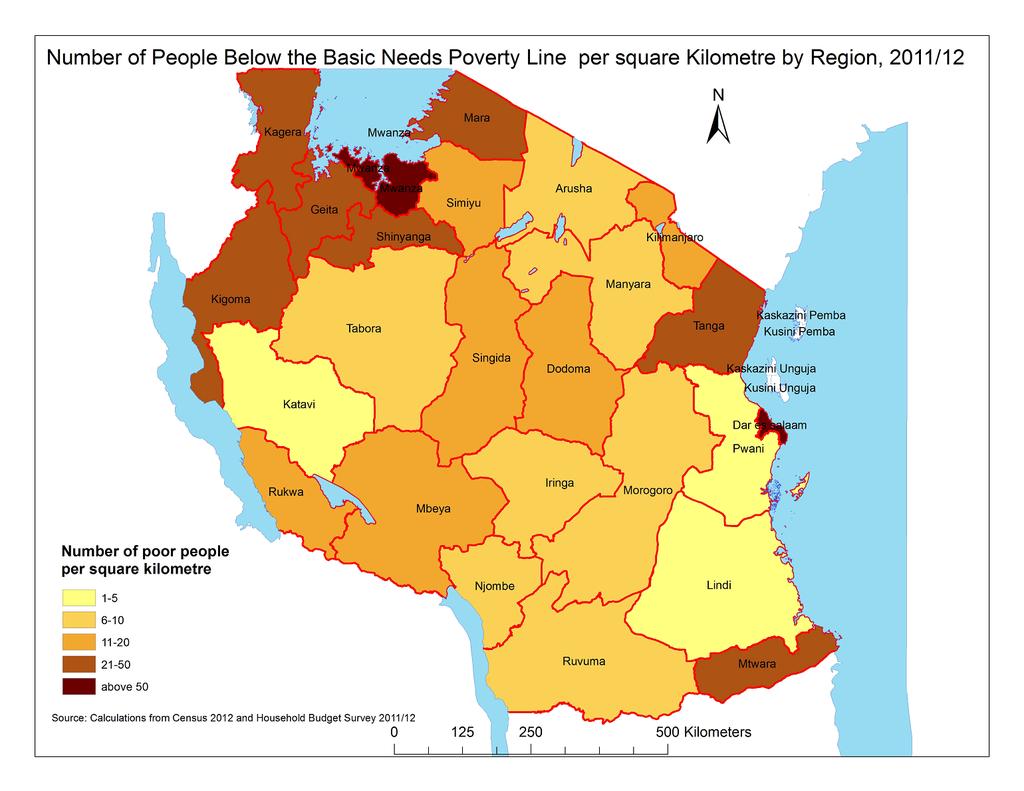
19 Poverty Density Poverty Density
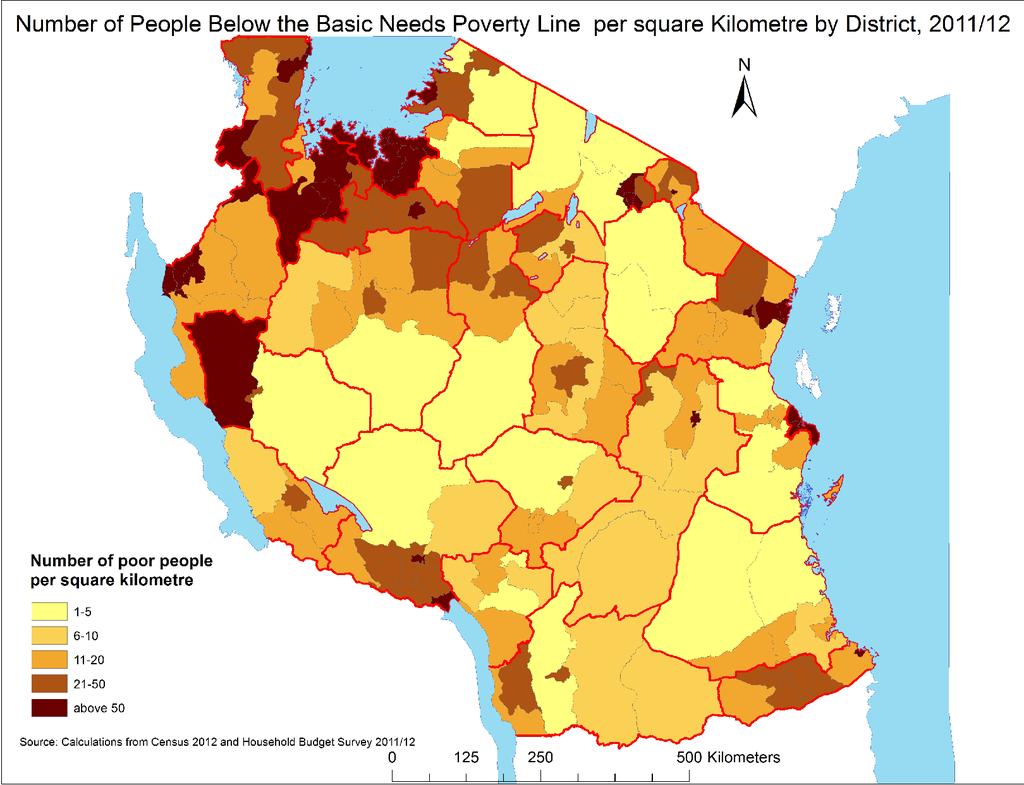
20 Poverty Density Poverty Density
21 Kigoma 13.8% Kigoma 5.4% Geita 12.3% Geita 4.9% Kagera 10.3% Kagera 3.9% Poverty Gap and Severity of Poverty Singida Mwanza Shinyanga Ruvuma Tabora Mtwara Tanga Simiyu Lindi Tanzania Dodoma Rukwa Mara Iringa Njombe Mbeya Katavi Morogoro Manyara Arusha 3.7% 3.1% 9.7% 9.4% 8.7% 8.5% 8.4% 8.3% 8.2% 7.4% 7.2% 6.8% 6.2% 6.2% 6.2% 6.1% 5.8% 5.6% 5.5% 5.3% Mwanza Singida Shinyanga Tabora Ruvuma Tanga Mtwara Simiyu Lindi Tanzania Mara Rukwa Dodoma Iringa Katavi Mbeya Njombe Morogoro Manyara Arusha 1.2% 1.0% 3.6% 3.6% 3.2% 3.2% 3.0% 3.0% 2.9% 2.9% 2.5% 2.5% 2.2% 2.1% 2.1% 2.0% 1.9% 1.9% 1.9% 1.8% Pwani 3.1% Pwani 1.0% Kilimanjaro 3.0% Kilimanjaro 0.9% Dar es Salaam 0.9% Dar es Salaam 0.3% 0% 2% 4% 6% 8% 10% 12% 14% 0% 1% 2% 3% 4% 5% 6%
22 Kilimanjaro Dar es Salaam Pwani Arusha Tanzania Mbeya Mtwara Iringa Inequality (GINI) Tanga Morogoro Manyara Mwanza Mara Dodoma Kagera Lindi Shinyanga Geita Njombe Tabora Ruvuma Simiyu Katavi Rukwa Singida Kigoma
23 Kilimanjaro Dar es Salaam Dar es Salaam Kilimanjaro Inequality (GINI) and Poverty Head Count Pwani Arusha Tanzania Mbeya Mtwara Iringa Tanga Morogoro Manyara Mwanza Mara Dodoma Kagera Lindi Shinyanga Geita Njombe Tabora Ruvuma Simiyu Katavi Rukwa Singida Pwani Arusha Manyara Morogoro Katavi Mbeya Njombe Mara Iringa Rukwa Dodoma Tanzania Simiyu Lindi Tabora Tanga Mtwara Shinyanga Ruvuma Mwanza Singida Kagera Kigoma 0.28 Geita Kigoma
24 Poverty Head Count 2000/01 vs. 2011/12 Dar es Salaam Kilimanjaro Pwani Arusha Manyara Morogoro Mbeya Mara Rukwa Iringa Dodoma Lindi Tabora Tanga Shinyanga Mtwara Mwanza Ruvuma Singida Kagera Kigoma HBS 2011/12 HBS 2000/ Dar es Salaam Kilimanjaro Pwani Arusha Manyara Morogoro Katavi Mbeya Njombe Mara Iringa Rukwa Dodoma Tanzania Simiyu Lindi Tabora Tanga Mtwara Shinyanga Ruvuma Mwanza Singida Kagera Geita Kigoma

25 Ranking of different indicators
26 Alternative applications of the small area estimation method Small area estimation can be used in Nutrition mapping, poverty mapping among small economic groups e.g. Children and disabled Disabled heads of household Disabled
27 Concluding remarks Poorest areas do NOT necessary have the largest number of poor people Not all indicators can be linked to poverty Include a village (EA) module in census The long form of the census should be administered to the whole population
28 Concluding remarks To better target the poor one should be aware of three things a) Who are the poor b) Where are the poor and c) Why are they poor Poverty mapping have answered the first two questions and more research is needed to answer the third one
29 Thank You REPOA 157 Mgombani Street, Regent Estate P.O. Box 33223, Dar es Salaam, Tanzania Tel: +255(0)(22) / Fax: +255(0)(22) repoa@repoa.or.tz
POPULATION DISTRIBUTION AND DENSITY IN TANZANIA: EXPERIENCES FROM 2002 POPULATION AND HOUSING CENSUS
 POPULATION DISTRIBUTION AND DENSITY IN TANZANIA: EXPERIENCES FROM 2002 POPULATION AND HOUSING CENSUS 1.0. Introduction By Ndalahwa F. Madulu Institute of Resource Assessment University of Dar es Salaam
Estimating Utility Consistent Poverty Lines: With Illustrations from Mozambique and Tanzania. Channing Arndt University of Copenhagen
 Estimating Utility Consistent Poverty Lines: With Illustrations from Mozambique and Tanzania Channing Arndt University of Copenhagen Motivation for GAPP What is happening in Africa? Operational Foci Relative
VOCATIONAL EDUCATION AND TRAINING AUTHORITY PROCEDURESS FOR JOINING VOCATIONAL TRAINING CENTRES FOR TRAINING
 VOCATIONAL EDUCATION AND TRAINING AUTHORITY PROCEDURESS FOR JOINING VOCATIONAL TRAINING CENTRES FOR TRAINING Prepared by: VETA Head Office, P.O.BOX 2849 DAR ES SALAAM June, 2013 1 1.0. INTRODUCTION The
US France. Germany Japan. Switzerland. Canada Spain. Belgium. Hong Kong. Netherlands. Russia China. Italy. Sweden. Australia. Denmark. Austria.
 s OFDI outflows rose in the world rankings from 13 th in 27 to 9 th in 28 and then to 6 th in 29 Chinese FDI into Africa Major Dynamics and Trends Dirk Kotze Council for the Promotion of International
TANZANIA ATOMIC ENERGY COMMISSION LIST OF CENTRES UNDER CLOSURE AS AT 12TH OCTOBER 2018 ARUSHA
 TANZANIA ATOMIC ENERGY COMMISSION LIST OF CENTRES UNDER CLOSURE AS AT 12TH OCTOBER 2018 ARUSHA S/No. NAME OF CENTRE 1. MONG OLA HEALTH CENTRE P.O. BOX 12150, ARUSHA. 2. KANSAY HEALTH CENTRE P.O. BOX 200,
AN OVERVIEW OF TOURISM DEVELOPMENT IN THE SOUTHERN CIRCUIT
 DEVELOPMENT AND FUTURE OF TOURISM IN THE SOUTHERN CIRCUIT IN TANZANIA AN OVERVIEW OF TOURISM DEVELOPMENT IN THE SOUTHERN CIRCUIT Mr. S. A. Pamba Director of Tourism Ministry of Natural Resources and Tourism
Tourism Zone KIGAMBONI NEW CITY MASTER PLAN, TANZANIA. LH Consortium 11
 Tourism Zone KIGAMBONI NEW CITY MASTER PLAN, TANZANIA 11 SITE ANALYSIS Locati ion and Area Present Facilities & Population 12 SITE ANALYSIS LOCATION AND AREA Site Location: Kigamboni, Dar Es Salaam, Tanzania
FIRST QUARTER SALARY RELEASES FOR THE YEAR 2015/16
 FIRST QUARTER SALARY FOR THE YEAR 2015/16 A: MINISTRIES, AGENCIES AND DEPARTMENTS 1 STATE HOUSE 5,407,486,000 237,640,800 253,506,800 226,681,800 717,829,400 2 PUBLIC DEBT AND GENERAL SERVICES 9,031,287,000
MAMLAKA YA ELIMU NA MAFUNZO YA UFUNDI STADI (VETA)
") MAMLAKA YA ELIMU NA MAFUNZO YA UFUNDI STADI (VETA) TANGAZO LA KUJIUNGA NA MAFUNZO YA UFUNDI STADI DARAJA LA TATU (LEVEL III) VETA INAPENDA KUWATANGAZIA WATANZANIA WOTE KUWA MAFUNZO KWA DARAJA LA TATU YATAANZA
MAMLAKA YA ELIMU NA MAFUNZO YA UFUNDI STADI (VETA) TANGAZO LA KUJIUNGA NA MAFUNZO YA UFUNDI STADI DARAJA LA TATU (LEVEL III) VETA INAPENDA KUWATANGAZIA WATANZANIA WOTE KUWA MAFUNZO KWA DARAJA LA TATU YATAANZA
INFRASTRUCTURE DEVELOPMENT IN TANZANIA
 INFRASTRUCTURE DEVELOPMENT IN TANZANIA PROF JOSEPH MSAMBICHAKA MBEYA UNIVERSITY OF SCIENCE AND TECHNOLOGY 50 TH YEARS ERB ANNIVERSARY 5 TH TO 7 TH SEPTEMBER 2018 PRESENTATION LAYOUT 1. DEFINITION OF INFRASTRUCTURE
TABLE OF CONTENTS Page
 TABLE OF CONTENTS Page Foreword...v SECTION I LAND, PEOPLE, CLIMATE AND AGRO-ECONOMIC ZONES 1.0 Geographical Location:... 1 1.1 Land Area and Administrative Units:... 1 1.2 Ethnic Groups:... 3 1.3 Population
THE UNITED REPUBLIC OF TANZANIA PRESIDENT S OFFICE TANZANIA RURAL AND URBAN ROADS AGENCY (TARURA) Ref. No. AB.21/288/01 E /32 22/03/2018
 Ref. No. AB.21/288/01 E /32 22/03/2018") THE UNITED REPUBLIC OF TANZANIA PRESIDENT S OFFICE TANZANIA RURAL AND URBAN ROADS AGENCY (TARURA) P.O.BOX 11042, DODOMA Ref. No. AB.21/288/01 E /32 22/03/2018 CALL FOR AN ORAL INTERVIEW The Chief Executive
THE UNITED REPUBLIC OF TANZANIA PRESIDENT S OFFICE TANZANIA RURAL AND URBAN ROADS AGENCY (TARURA) P.O.BOX 11042, DODOMA Ref. No. AB.21/288/01 E /32 22/03/2018 CALL FOR AN ORAL INTERVIEW The Chief Executive
DUNOON PROFILE May 2014
 www.hie.co.uk DUNOON PROFILE May 2014 DUNOON PROFILE INTRODUCTION The Dunoon profile uses 2011 Census data and other available data sources to present an up-to-date analysis of its population and labour
Contents. East Africa Highlights 5. Destination East Africa 13. Getting Started 14. Itineraries 19. History 25. Culture 31. Environment 52.
 Contents Lonely Planet Publications 9 On the Road 4 East Africa Highlights 5 Destination East Africa 13 Getting Started 14 Itineraries 19 History 25 Culture 31 Environment 52 Safaris 60 Mountain Gorillas
Fiji s Tourism Satellite Accounts
 Asia-Pacific Economic Statistics Week Bangkok 2 4 May 2016 Fiji s Tourism Satellite Accounts Mr. Bimlesh Krishna Divisional Manager Economic Statistics Fiji s Tourism Satellite Introduction The Tourism
URBAN DYNAMICS WESTERN CAPE 67
 URBAN DYNAMICS WESTERN CAPE 67 5. SOCIO-ECONOMIC CONTEXT 5.1 Demographic Profile 5.1.1 Introduction The demographic information contained in the synopsis is derived from the supposedly inaccurate 2001
Economic Impact Analysis. Tourism on Tasmania s King Island
 Economic Impact Analysis Tourism on Tasmania s King Island i Economic Impact Analysis Tourism on Tasmania s King Island This project has been conducted by REMPLAN Project Team Matthew Nichol Principal
Key Indicators for South Sudan
 Key Indicators for South Sudan National Bureau of Statistics Fast Facts Total Population of South Sudan is 8.26 million Total Area of South Sudan is 644,329 sq. km More than half (51%) of the population
Ministry of Natural Resources and Tourism Tourism Division. The 2009 Tourism Statistical Bulletin
 Ministry of Natural Resources and Tourism Tourism Division The 2009 Tourism Statistical Bulletin INTRODUCTION THE COUNTRY Tanzania covers 945,234 sq. km made up 942,832 sq. km of mainland Tanzania (formerly
BUSINESS OPPORTUNITIES IN TANZANIA
 BUSINESS OPPORTUNITIES IN TANZANIA FACT PACK June 2015 Business Sweden in Nairobi TANZANIA BRIEF FACTS BASIC FACTS Population: 49,639,138 (2014) Area: 947,300* sq. km Capital: Dar es Salaam Languages:
ISRAEL- COUNTRY FACTS
 ISRAEL- COUNTRY FACTS ISRAEL-NEIGHBOURING COUNTRIES AND POLITICAL MAP Area: 22,072 sq. km Land area: 21,643 sq. km. Fast Facts Area of lakes: 429 sq. km. (Sea of Galilee 164 sq. km., the Dead Sea - 265
EAST AFRICA Price Bulletin November 2017
 KES/9 kg KES/9 kg November 217 The Famine Early Warning Systems Network (FEWS NET) monitors trends in staple food prices in countries vulnerable to food insecurity. For each FEWS NET country and region,
WHITE MAIZE: The markets below represent the major producer and consumer markets in countries where white maize is heavily consumed as the staple.
 KES/9 kg KES/9 kg November 211 The Famine Early Warning Systems Network (FEWS NET) monitors trends in staple food prices in countries vulnerable to food insecurity. For each FEWS NET country and region,
Swaziland. HDI values and rank changes in the 2013 Human Development Report
 Human Development Report 2013 The Rise of the South: Human Progress in a Diverse World Explanatory note on 2013 HDR composite indices Swaziland HDI values and rank changes in the 2013 Human Development
Market Brief on Tanzania
 Market Brief on Tanzania February 2017 Location Facts and Figures Total Population 50,7 million (2015) Tanzania is located in the African Great Lakes region on the East coast of the continent. It is bordered
Market Brief on Tanzania
 Market Brief on Tanzania January 2018 Location Facts and Figures Tanzania is located in the African Great Lakes region on the East coast of the continent. It is bordered by Kenya and Uganda to the north;
2015 CRS ICT4D CONFERENCE INTRODUCING THE BANDWIDTH AGGREGATION BUYING PROGRAM
 2015 CRS ICT4D CONFERENCE INTRODUCING THE BANDWIDTH AGGREGATION BUYING PROGRAM InsideNGO and NetHope s first connectivity demand-aggregation program, implemented by Hutchison Global Communications (HGC)
NATIONAL REPORT OF TANZANIA ON SEA LEVEL ACTIVITIES AND OBSERVING NETWORK
 NATIONAL REPORT OF TANZANIA ON SEA LEVEL ACTIVITIES AND OBSERVING NETWORK Mohammed Ngwali Tanzania Meteorological Agency, Zanzibar Office P. O. Box 340, Zanzibar, Tanzania. Tel: +255 24 2231958; Fax: +
The Economic Impact of Tourism in North Carolina. Tourism Satellite Account Calendar Year 2013
 The Economic Impact of Tourism in North Carolina Tourism Satellite Account Calendar Year 2013 Key results 2 Total tourism demand tallied $26 billion in 2013, expanding 3.9%. This marks another new high
The Yorke & Mid North (State Govt) Region. Workforce Wizard Region Report
 Region. Workforce Wizard Region Report") The Yorke & Mid North (State Govt) Region Workforce Wizard Region Report Table of Contents Executive Summary 3 Population and Social Characteristics 4 Current Population 4 Age Groups 4 Key Populations
The Yorke & Mid North (State Govt) Region Workforce Wizard Region Report Table of Contents Executive Summary 3 Population and Social Characteristics 4 Current Population 4 Age Groups 4 Key Populations
West London Economic Assessment
 West London Economic Assessment A baseline analysis of the West London economy An Executive Summary PBA were commissioned in October 2015 to complete an economic assessment of West London to refresh the
Cover Page. The handle holds various files of this Leiden University dissertation.
 Cover Page The handle http://hdl.handle.net/1887/20753 holds various files of this Leiden University dissertation. Author: Chirangi, Musuto Mutaragara Title: Afya Jumuishi : towards interprofessional collaboration
LICENSED AND OPERATING GROUND HANDLING SERVICE PROVIDERS AT VARIOUS AIRPORTS AS OF 30 DECEMBER 2012
 LICENSED AND OPERATING GROUND HANDLING SERVICE PROVIDERS AT VARIOUS AIRPORTS AS OF 30 DECEMBER 2012 S/No Name of Operator Services Approved Licence Number & 1. Swissport Tanzania Limited, P.O.Box 18043,
CAMPBELTOWN PROFILE May 2014
 www.hie.co.uk CAMPBELTOWN PROFILE May 2014 CAMPBELTOWN PROFILE INTRODUCTION The Campbeltown profile uses 2011 Census data and other available data sources to present an up-to-date analysis of its population
The United Republic of Tanzania Ministry of Natural Resources and Tourism TOURISM DIVISION The 2013 Tourism Statistical Bulletin
 The United Republic of Tanzania Ministry of Natural Resources and Tourism TOURISM DIVISION The 2013 Tourism Statistical Bulletin INTRODUCTION THE COUNTRY Tanzania covers 945,234 sq. km made up 942,832
January 22 nd, Ede Ijjasz-Vasquez Senior Director Social, Urban, Rural & Resilience The World Bank
 TICAD Seminar Series 4 th Seminar Land Use Planning & Spatial Development for Smart Growth in African Cities January 22 nd, 2016 Ede Ijjasz-Vasquez Senior Director Social, Urban, Rural & Resilience The
WILDLIFE SUB-SECTOR STATISTICAL BULLETIN
 The United Republic of Tanzania Ministry of Natural Resources and Tourism WILDLIFE SUB-SECTOR STATISTICAL BULLETIN 2013 Second Edition Contents Preface --------------------------------------------------------------------------------------------------------------------
NUNAVIK'S LABOUR MARKET AND EDUCATIONAL ATTAINMENT PARADOX
 NUNAVIK'S LABOUR MARKET AND EDUCATIONAL ATTAINMENT PARADOX Andrew Sharpe and Jasmin Thomas Presentation prepared for Mapping the Road Together to Sustainable Employment; Celebrating 25 Years. Katittavik
SHETLAND AREA PROFILE
 www.hie.co.uk SHETLAND AREA PROFILE May 2014 SHETLAND AREA PROFILE INTRODUCTION The Shetland area profile uses 2011 Census data and other available data sources to present an up-to-date analysis of its
Tourism Satellite Account Calendar Year 2010
 The Economic Impact of Tourism in Georgia Tourism Satellite Account Calendar Year 2010 Highlights The Georgia visitor economy rebounded in 2010, recovering 98% of the losses experienced during the recession
DINGWALL PROFILE May 2014
 www.hie.co.uk DINGWALL PROFILE May 2014 DINGWALL PROFILE INTRODUCTION The Dingwall profile uses 2011 Census data and other available data sources to present an up-to-date analysis of its population and
TSA governance at national level
 Mr. Peter Laimer Directorate Spatial Statistics UNWTO/DG GROW TSA-Workshop Agenda Item 6 TSA governance at national level Austrian experiences Brussels, 29/30 November 2017 www.statistik.at We provide
Poverty in Seychelles: Policy Digest
 Poverty in Seychelles: Policy Digest Christophe Muller (United Nations Development Programme Consultant, July 2012) This document reports on the estimation of a poverty line and a poverty profile for Seychelles
The Economic Impact of Tourism in North Carolina. Tourism Satellite Account Calendar Year 2015
 The Economic Impact of Tourism in North Carolina Tourism Satellite Account Calendar Year 2015 Key results 2 Total tourism demand tallied $28.3 billion in 2015, expanding 3.6%. This marks another new high
Executive Summary... i. List of Tables and Figures viii CHAPTER 1: INTRODUCTION.. 1 CHAPTER 2: PRESENTATION OF SURVEY RESULTS 7
 TANZANIA TOURISM SECTOR SURVEY The 2004 International Visitors Exit Survey Report (DRAFT) Dar es Salaam, February 2006 ii CONTENTS Executive Summary.... i List of Tables and Figures viii CHAPTER 1: INTRODUCTION..
Regional Tourism Satellite Accounts (RTSA) in Austria
 in Austria") Peter Laimer Directorate Spatial Statistics CIS countries and Georgia Workshop III (Session 1) 10-12 June 2013 Baku/Azerbaijan Regional Tourism Satellite Accounts (RTSA) in Austria Methods, data sources,
Peter Laimer Directorate Spatial Statistics CIS countries and Georgia Workshop III (Session 1) 10-12 June 2013 Baku/Azerbaijan Regional Tourism Satellite Accounts (RTSA) in Austria Methods, data sources,
Demographic Profile 2013 census
 Demographic Profile 2013 census This profile provides basic population and demographic information on the residents of the Hauraki District. Population and demographic information is important for targeting
The Economic Impact of Tourism in Jacksonville, FL. June 2016
 The Economic Impact of Tourism in Jacksonville, FL June 2016 Highlights Visitor spending surpassed $2.0 billion in 2015, growing 4.4%. As this money flowed through Duval County, the $2.0 billion in visitor
The Economic Base of Colfax County, NM. PREPARED BY: The Office of Policy Analysis at Arrowhead Center, New Mexico State University.
 The Economic Base of Colfax County, NM PREPARED BY: The Office of Policy Analysis at Arrowhead Center, New Mexico State University DATE: July 2016 The Economic Base of Colfax County, New Mexico Introduction
PORTREE PROFILE May 2014
 www.hie.co.uk PORTREE PROFILE May 2014 PORTREE PROFILE INTRODUCTION The Portree profile uses 2011 Census data and other available data sources to present an up-to-date analysis of its population and labour
SYNOPSIS OF INFORMATION FROM CENSUS BLOCKS AND COMMUNITY QUESTIONNAIRE FOR TONOPAH, NEVADA
 TECHNICAL REPORT UCED 93-04 SYNOPSIS OF INFORMATION FROM CENSUS BLOCKS AND COMMUNITY QUESTIONNAIRE FOR TONOPAH, NEVADA UNIVERSITY OF NEVADA, RENO i Synopsis of Information from Census Blocks and Community
LOCAL NGOs. Tanzania Agriculture Capacity Building (TACAB) P.O BOX Cell: Tanzania Agricultural Development Trust (TADT)
 P.O BOX Cell: Tanzania Agricultural Development Trust (TADT)") LOCAL NGOs Tanzania Agriculture Capacity Building (TACAB) P.O BOX 12831 Cell: 0718809543 Tanzania Agricultural Development Trust (TADT) Uhuru Street, Mwalimu House, 3rd Floor, P.O Box 72833, Dar es Salaam
LOCAL NGOs Tanzania Agriculture Capacity Building (TACAB) P.O BOX 12831 Cell: 0718809543 Tanzania Agricultural Development Trust (TADT) Uhuru Street, Mwalimu House, 3rd Floor, P.O Box 72833, Dar es Salaam
The Economic Impact of Tourism in Buncombe County, North Carolina
 The Economic Impact of Tourism in Buncombe County, North Carolina 2017 Analysis September 2018 Introduction and definitions This study measures the economic impact of tourism in Buncombe County, North
The Saskatchewan Economic Outlook: On Solid Footing
 The Saskatchewan Economic Outlook: On Solid Footing Saskatchewan Real Estate Forum Mario Lefebvre Director, Centre for Municipal Studies The Conference Board of Canada April 30, 2013 www.conferenceboard.ca
The Economic Impact of Tourism in Hillsborough County. July 2017
 The Economic Impact of Tourism in Hillsborough County July 2017 Table of contents 1) Key Findings for 2016 3 2) Local Tourism Trends 7 3) Trends in Visits and Spending 12 4) The Domestic Market 19 5) The
4,834, , Dar es Salaam Safety Nets Chama cha Utafiti wa Magonjwa Sugu na UKIMWI kwa Tiba Asilia Tanzania,
 Page 1 of 3 4,177,913,520 disbursed for RSG, MG and RDG project in November 2006 Name of Organisation Thematic Areas Funding Applications Round 3, RSG September 2006 1 Campaign for Travellers Safety, P.O.
Sanctuary Saadani River Lodge, Saadani National Park
 Sanctuary Saadani River Lodge, Saadani Page 1 of 6 Serene Saadani Sanctuary Saadani River Lodge, built for rest and relaxation, lies on the banks of the Wami River - close to Saadani. This river retreat
North Carolina (Statewide) 2016 Prosperity Zone Data Books
 2016 Prosperity Zone Data Books") North Carolina (Statewide) 2016 Prosperity Zone Data Books 2 North Carolina Prosperity Zones Western North Carolina Prosperity Zones Northwest Region Piedmont-Triad Region Western Region Southwest Region
North Carolina (Statewide) 2016 Prosperity Zone Data Books 2 North Carolina Prosperity Zones Western North Carolina Prosperity Zones Northwest Region Piedmont-Triad Region Western Region Southwest Region
Going Beyond GDP and Measuring Poverty: new challenges ahead
 Going Beyond GDP and Measuring Poverty: new challenges ahead Michail Skaliotis Eurostat 20 th Statistical Days - Measuring the Well-being and the Progress of Society - Radenci 8-10 Nov. 2010 1 Why is it
The Economic Impact of Tourism on Galveston Island, Texas Analysis
 The Economic Impact of Tourism on Galveston Island, Texas 2012 Analysis Headline Results Headline results Tourism is a significant contributor to business sales, employment, and taxes on Galveston Island.
Introduction on the Tourism Satellite Account
 Mr. Peter Laimer Directorate Spatial Statistics UNWTO/DG GROW TSA-Workshop Agenda Item 2 Introduction on the Tourism Satellite Account Framework, tables and benefits Brussels, 29/30 November 2017 www.statistik.at
Tourism Industry Council Tasmania Community Survey 2018 Research Report. May 2018
 Tourism Industry Council Tasmania Community Survey 2018 Research Report May 2018 This report has been prepared by Enterprise Marketing and Research Services 60 Main Road, Moonah TAS 7009 All enquiries
The Economic Impact of Tourism on Galveston Island, Texas
 The Economic Impact of Tourism on Galveston Island, Texas 2017 Analysis Prepared for: Headline Results Headline results Tourism is an integral part of the Galveston Island economy and continues to be a
ARE OUR CHILDREN LEARNING?
 ARE OUR CHILDREN LEARNING? Literacy and Numeracy Across East Africa 2014 56 74 96 2 CONTENTS 1 ACKNOWLEDGEMENTS 1. INTRODUCTION 2. UWEZO SURVEYS 3. KEY FINDINGS 4. UWEZO ROUNDS 1-4: TRENDS IN LEARNING
Industry and occupation of population in Montenegro
 MONTENEGRO STATISTICAL OFFICE R E L A S E 197 No Podgorica, 20 July 2012 Name the source when using the data Industry and occupation of population in Montenegro Census of Population, Households, and Dwellings
The Economic Contributions of Agritourism in New Jersey
 The Economic Contributions of Agritourism in New Jersey Bulletin E333 Cooperative Extension Brian J. Schilling, Extension Specialist in Agricultural Policy Kevin P. Sullivan, Institutional Research Analyst
REPORT ON THE ECONOMIC IMPACT OF TOURISM. Raleigh, North Carolina
 2016 REPORT ON THE ECONOMIC IMPACT OF TOURISM Raleigh, North Carolina Table of Contents 2 OVERVIEW 3 HEADLINE RESULTS 5 KEY TRENDS 8 VISITORS & SPENDING Visitor details in 2016 Composition of tourism spending
Economic Impact of Tourism in South Dakota, December 2018
 Economic Impact of Tourism in South Dakota, 2018 December 2018 1) Key Findings Growth rebounds in 2018 as a strong hunting season drives tourism growth Key facts about South Dakota s tourism sector Key
Economic Contribution of Tourism to NSW
 Economic Contribution of Tourism to NSW 2013-14 Tourism is a significant part of the NSW economy. In 2013-14, tourism contributed $34.9 billion (Tourism Consumption) to the NSW economy and employed 272,000
Impact of Financial Sector on Economic Growth: Evidence from Kosovo
 Doi:10.5901/mjss.2015.v6n6s4p315 Abstract Impact of Financial Sector on Economic Growth: Evidence from Kosovo Majlinda Mazelliu, MBA majlinda.mazelliu@gmail.com Jeton Zogjani, MSc & MBA zogjanijeton@gmail.com
Development Issues and Indicators
 Development Issues and Indicators 1 2 Budgetausgaben in % des BIP gesamter Staatshaushalt 60 50 40 30 20 10 Albanien Kroatien Montenegro Bosnien und Herzegowina Mazedonien Serbien 0 2000 2001 2002 2003
Queenstown Lakes District Council. Review of District Plan Business Zones Capacity and Development of Zoning Hierarchy
 Queenstown Lakes District Council Review of District Plan Business Zones Capacity and Development of Zoning Hierarchy McDermott Miller Strategies Limited in association with Allan Planning & Research Limited
North Lanarkshire. Skills Assessment January SDS-1163-Jan16
 North Lanarkshire Skills Assessment January 2016 SDS-1163-Jan16 Acknowledgement The Regional Skills Assessment Steering Group (Skills Development Scotland, Scottish Enterprise, the Scottish Funding Council
ECONOMIC PROFILE. Tourism
 ECONOMIC PROFILE Tourism Park City & Summit County Utah Prepared by Park City Chamber of Commerce Convention & Visitors Bureau P.O. Box 1630 ~ Park City, UT 84060-1630 800.453.1360 ~ 435.649.6100 ~ fax
PROFILE OF THE PUERTO RICAN POPULATION IN UNITED STATES AND PUERTO RICO: 2008
 PROFILE OF THE PUERTO RICAN POPULATION IN UNITED STATES AND PUERTO RICO: 2008 Sonia G. Collazo, Camille L. Ryan, Kurt J. Bauman U.S. Census Bureau Housing and Household Economic Statistics Division This
TRAMPING FINDINGS FROM THE 2013/14 ACTIVE NEW ZEALAND SURVEY. Sport & Active Recreation Profile ACTIVE NEW ZEALAND SURVEY SERIES.
 ACTIVE NEW ZEALAND SURVEY SERIES Te Rangahau Korikori o Aotearoa Sport & Active Recreation Profile TRAMPING FINDINGS FROM THE 213/14 ACTIVE NEW ZEALAND SURVEY www.sportnz.org.nz Introduction Content This
Economic Contribution of Tourism to NSW
 Economic Contribution of Tourism to NSW 2015-16 Tourism is a significant part of the NSW economy. In 2015-16, tourism contributed $38.1 billion (Tourism Consumption) to the NSW economy and employed 261,100
The institutional table below was updated during compilation of FY 2014/15 GFS data for General Government Sub-Sector
 APPENDIX III. TANZANIA S PUBLIC SECTOR INSTITUTIONAL TABLE The institutional table below was updated during compilation of FY 2014/15 GFS data for General Government Sub-Sector Central Government Subsector
TANZANIA CIVIL AVIATION AUTHORITY AERONAUTICAL INFORMATION SERVICES
 Title: Daily List of Valid NOTAM Page 1 of 1 TEL: 255 22 2110223/2 24 FAX: 255 22 2110264 AFTN: HTDAYNYX E-mail: TUtcaa.dia@tcaa.go.tzUT TUnofdia@tcaa.go.tzUT Website: www.tcaa.go.tz UNITED REPUBLIC OF
East Lothian. Skills Assessment January SDS-1154-Jan16
 East Lothian Skills Assessment January 2016 SDS-1154-Jan16 Acknowledgement The Regional Skills Assessment Steering Group (Skills Development Scotland, Scottish Enterprise, the Scottish Funding Council
The Economic Impact of Tourism in Maryland. Tourism Satellite Account Calendar Year 2016
 The Economic Impact of Tourism in Maryland Tourism Satellite Account Calendar Year 2016 County Results Washington County, Visitors Washington County Visitors (thousands) Year Overnight Day Total Growth
Population, Territory and Sustainable Development The Case of the Caribbean Sub Region
 Population, Territory and Sustainable Development The Case of the Caribbean Sub Region Author: Godfrey St. Bernard Sir Arthur Lewis Institute of Social and Economic Studies The University of the West Indies
Outline. Merging GNSS Kinematic Tracks - using the TanDEM-X mission in Africa. R.M.S. Fernandes Jorge Santos Detlev Kosmann.
 Merging GNSS Kinematic Tracks - using the TanDEM-X mission in Africa R.M.S. Fernandes Jorge Santos Detlev Kosmann UBI, IDL, CGUL, Portugal DEOS, The Netherlands INESCC, Portugal DLR, Germany RCMRD, Kenya
The Economic Impact of Travel in Kansas. Tourism Satellite Account Calendar Year 2013
 The Economic Impact of Travel in Kansas Tourism Satellite Account Calendar Year 2013 Who we are Tourism Economics Union of industry expertise and economic disciplines Real world insights based on quantitative
The Economic Impact of Tourism in Maryland. Tourism Satellite Account Calendar Year 2015
 The Economic Impact of Tourism in Maryland Tourism Satellite Account Calendar Year 2015 MD tourism economy reaches new peaks The Maryland visitor economy continued to grow in 2015; tourism industry sales
The Economic Impact of Travel in Minnesota Analysis
 The Economic Impact of Travel in Minnesota 2013 Analysis Overview 2013 Highlights Traveler Spending Traveler spending of $10.3 billion generated $17.6 billion in total business sales in 2013 as travel
ECONOMIC IMPACT STUDY OF CALIFORNIA AIRPORTS
 ECONOMIC IMPACT STUDY OF CALIFORNIA AIRPORTS MARCH 1, 2013 Prepared for California Airports Council Prepared by Applied Development Economics 100 Pringle Avenue, Suite 560 Walnut Creek, California 94596
Chapter 7: Tourism. 7.1: Overview
 Chapter 7: Tourism 7.1: Overview Tourism is the sector with the highest employment generation potential (World Bank 2014). Recent studies showed that when the price of gold Tanzania s largest export by
Youth Retention: July Value of post secondary education in regional settings. Prepared for Luminosity Youth Summit.
 Youth Retention: Value of post secondary education in regional settings Prepared for Luminosity Youth Summit July 2013 Prepared by MID NORTH COAST NSW Table of contents Table of contents... 2 Introduction...
Estimation of Tourism Employment through Tourism Satellite Account Indian Experience
 Estimation of Tourism Employment through Tourism Satellite Account Indian Experience Dr. R. N. Pandey Additional Director General Ministry of Tourism Govt. of India E-Mail: rajnath56.pandey@gmail.com Importance
Wyoming Travel Impacts
 Wyoming Travel Impacts 2000-2014 Wyoming Office of Tourism April 2015 Prepared for the Wyoming Office of Tourism Cheyenne, Wyoming The Economic Impact of Travel on Wyoming 2000-2014 Detailed State and
Economic Impact of Tourism in South Dakota, December 2017
 Economic Impact of Tourism in South Dakota, 2017 December 2017 1) Key findings 1) Growth continues in 2017 but pales against the event driven years of 2015 and 2016 in South Dakota Key facts about South
Edmonton Real Estate Forum
 Edmonton Real Estate Forum On Solid Footing Shaw Conference Centre May 10, 2012 Mario Lefebvre Director, Centre for Municipal Studies lefebvre@conferenceboard.ca Uneven Growth in Global Economy (per cent
South Australian Centre for Economic Studies June 2016 Economic Briefing Report 28 June, 2016
 Steve Whetton, Executive Director, SA Centre for Economic Studies South Australian Centre for Economic Studies June 216 Economic Briefing Report 28 June, 216 Per cent Global GDP Growth 1 8 Developing Countries
Problem Set 3 Environmental Valuation
 Problem Set 3 Environmental Valuation 1. Arturo derives utility from a composite good X and indoor air quality, Q such that. Indoor air quality depends on pollution levels outside, P, and defensive expenditures,
Benchmarking Travel & Tourism in Australia
 Benchmarking Travel & Tourism in Australia How does Travel & Tourism compare to other sectors? Sponsored by: Summary of Findings, November 2013 Outline Introduction... 3 Australia summary..... 8 Data sources
EAST AFRICA PHOTOGRAPHIC SMALL GROUP JOURNEYS Capture your imagination on an East Africa Expedition
 EAST AFRICA PHOTOGRAPHIC SMALL GROUP JOURNEYS Capture your imagination on an East Africa Expedition CAPTURE YOUR IMAGINATION An East Africa Photographic Expedition offers the exclusive opportunity for
Otago Economic Overview 2013
 Final report May 2014 www.berl.co.nz Background Author(s): Mark Cox, Hugh Dixon and Masrur Alam Khan DISCLAIMER All work is done, and services rendered at the request of, and for the purposes of the client
Benchmarking Travel & Tourism in United Arab Emirates
 Benchmarking Travel & Tourism in United Arab Emirates How does Travel & Tourism compare to other sectors? Summary of Findings, November 2013 Sponsored by: Outline Introduction... 3 UAE summary...... 8
The Economic Impact of Tourism in Hillsborough County, June 2018
 The Economic Impact of Tourism in Hillsborough County, 2017 June 2018 Table of contents 1) Key Findings for 2017 3 2) Local Tourism Trends 7 3) Trends in Visits and Spending 12 4) The Domestic Market 19