FOUR SQUARE MILE NEIGHBORHOOD ARAPAHOE COUNTY, COLORADO. Recreation Needs and Opportunities Assessment March 2015
|
|
|
- Calvin Owens
- 6 years ago
- Views:
Transcription


1 FOUR SQUARE MILE NEIGHBORHOOD ARAPAHOE COUNTY, COLORADO Recreation Needs and Opportunities Assessment March 2015
2
3 Table of Contents I. Executive Summary... 1 Introduction... 1 Demographic Profile... 1 Community and Stakeholder Input... 4 Trends... 4 Inventory and Level of Service... 5 Potential Funding Opportunities... 5 Recommendations... 6 Implementation Plan... 7 II. The Planning Context... 9 A. Purpose of the Needs and Opportunity Assessment... 9 B. Background of the Study... 9 C. Governing Structure... 9 D. Related Planning Efforts E. Methodology for this Study F. Master Plan Schedule III. Our Community and Identified Needs A. Four Square Mile Neighborhood Demographic Profile B. Community and Stakeholder Input C. Trends IV. Inventory and Level of Service Analysis A. GRASP Methodology B. GRASP Inventory and Assumptions C. GRASP Analysis D. Findings V. Potential Funding Opportunities A. Arapahoe County Open Space Fund and Grant Opportunity B. Arapahoe County Recreation District Fund C. Great Outdoors Colorado Grant Funds (GOCO) VI. Recommendations A. Discussion B. General Recommendations C. Implementation Plan Appendix A Community Input Appendix B Park and Recreation Influencing Trends Appendix C Maps Appendix D GRASP History and Methodology Recreation Needs and Opportunities Assessment - DRAFT i
4 Table of Tables Table 1: Summary Demographics for Four Square Mile Neighborhood Table 2: Population Projections for the Four Square Mile Neighborhood Table 3: 2013 Demographic Overview of the Four Square Mile Neighborhood Table 4: Four Square Mile (FSM) Neighborhood Residential Statistics Table 5: Ethnicity Statistics (2013) Table 6: Walkability Statistics Table 7: Four Square Mile Study Area Population Table 8: Top 10 Worldwide Fitness Trends for 2007 and Table of Figures Figure 1: 2013 Breakdown by Age Figure 2: Annual Household Income Distribution Comparison (2013) Figure 3: 2013 Employment by Occupation Figure 4: Educational Attainment Comparison: Four Square Mile, Denver, and Aurora (ages 25+) Figure 5: Importance of Availability of Parks and Recreation Opportunities Figure 6: Degree to Which Needs are being Met by Current Facilities Figure 7: Preferred Methods for Receiving Information on Recreation Opportunities Figure 8: Transportation Preferences Figure 9: Top Three Priorities for Additions, Expansions, or Improvements of Future Facilities and Amenities Figure 10: Top Three Priorities for Future Facilities and Amenities: Owners vs. Renters Figure 11: Financial Choices/Fees Figure 12: Financial Choices/Fees: Owners vs. Renters Figure 13: Preferences for Budgeting Taxpayer Revenue for Parks, Recreation, and Trails in Four Square Mile Figure 14: Study Area Map Figure 15: System Area Map Figure 16: Recreation Priorities of Survey Respondents Figure 17: Component Needs Figure 18: City of Lafayette, Colorado Trails System Figure 19: Types of Trails ii Four Square Mile Neighborhood
5 Acknowledgements Arapahoe County Commissioners Nancy Doty Nancy Jackson Nancy Sharpe Rod Bockenfeld Bill Holen Arapahoe County Staff Shannon Carter, Intergovernmental Relations and Open Spaces Director Bethany Collins, Grants and Acquisitions Administrator Glen Poole, Open Spaces Operations Manager Roger Harvey, Open Spaces Planning Administrator Amanda Slates, Communications Specialist Josh Garcia, [former] Open Spaces Planning Administrator Meghan Deffner, [former] Open Spaces Planning Assistant Arapahoe County Public Works and Development Staff Four Square Mile Neighborhoods Group Mark Lampert and all of the Group members Our Citizens Thank you to all of the citizens who attended meetings, provided feedback, and participated in the surveys. Your input has been invaluable in compiling this report. Consultant Team GreenPlay, LLC Design Concepts RRC Associates MindMixer For More Information Contact: GreenPlay LLC, 1021 E. South Boulder Rd. Suite N, Louisville, CO Recreation Needs and Opportunities Assessment - DRAFT iii
6 THIS PAGE INTENTIONALLY LEFT BLANK
7 I. Executive Summary Introduction Arapahoe County has conducted a Parks and Open Space Needs and Opportunity Assessment for the Four Square Mile Neighborhood. The demographically diverse Four Square Mile neighborhood is located in the northwest section of unincorporated Arapahoe County, is bordered by the City and County of Denver and the City of Aurora, is home to over 20,000 residents, and lies within the Arapahoe County Recreation District. Map 1 is a context map showing the Recreation District Boundary. The 2.6 square mile area currently has two small neighborhood parks, a trailhead, and four open space/undeveloped areas, totaling approximately 20 acres. Several of these properties have access to the High Line Canal and Cherry Creek Trails. Map 2 depicts the study area. The goal of the Needs and Opportunity Assessment is to determine the level of service that Arapahoe County should provide residents of Four Square Mile. It is an important and necessary first step toward increasing recreation opportunities for the residents. This project has been guided by Arapahoe County staff, and the Four Square Mile Neighborhoods Group that was specifically engaged in the process. This plan is informed by, and where appropriate provides a connection to, past planning efforts that were reviewed as part of the study. This study is based on a comprehensive planning process that took place from January 2014 through March 2015 and involved extensive staff and community input as well as research and analysis of the existing parks and recreation system in the Four Square Mile Neighborhood and the surrounding quarter mile buffer area. It includes key findings and information gathered from the demographic and trend analysis; a public input process; a citizen survey; inventory and analysis of existing parks, open space, trails, and facilities; and analysis of funding resources. Based on this analysis, recommended goals and strategies are included to address the key issues identified in the needs assessment and findings phase of the project. Demographic Profile Although the future of population growth cannot be predicted with certainty, it is helpful to make assumptions about it for planning purposes. The Four Square Mile Neighborhood population is predicted to increase at a higher rate than the State of Colorado as a whole, from 2013 to 2018, by an annual rate of 1.63%, to 22,526. Compared to the surrounding cities of Denver and Aurora: The household size is somewhat lower. The median income is significantly lower with more Four Square Mile residents earning less than $15,000 than any other income range. The median age is somewhat lower, with Four Square Mile having a significantly higher numbers in the year old age groups. Recreation Needs and Opportunities Assessment 1

8 The Four Square Mile Neighborhood has a 25 percent owner occupied housing rate, compared to a 69.3 percent renter occupied rate. Home values fall between the lower values in Aurora and the higher values in Denver. Ethnicity is considerably different than the very similar ethnicities of Denver and Aurora. The percentage of African Americans and Asians is approximately double in Four Square Mile, while the rate of Caucasians is significantly lower. Map 1: Recreation District Context Map These maps have been included for illustration purposes. Larger maps are located in Appendix C. 2 Four Square Mile Neighborhood
9 Map 2: Study Area Map Four Square Mile Study Area system map showing all inventory included for GRASP analysis. Recreation Needs and Opportunities Assessment 3
10 Community and Stakeholder Input A community engagement process was conducted to gain valuable insight into the needs and interests of the community, and included: February 12 Presentation to the Four Square Mile Neighborhoods Group. April 23 Public Input/Project Scoping Session with the Four Square Mile Neighborhoods Group. May Afternoon and evening focus groups targeting citizens from church groups; Homeowner Associations representing the following areas: Iliff to SW of Parker, NE of Parker, and south of Iliff; local government agencies; and school/youth groups; along with County staff. August 13 Focus group with Four Square Mile Neighborhoods Group and Homeowner Associations. September 20 Ice Cream Social free community event at Cheyenne/Arapaho Park with option to complete survey. February 11 Findings and Draft Recommendations presented to the Four Square Mile Neighborhoods Group. March Posting of draft report on County website for opportunity for public review and comment. March 17 Study Session Presentation to the Arapahoe County Board of County Commissioners. In addition, a community survey was conducted using five methods: 1) a mail back survey sent to a random selection of households, 2) an online, invitation only web survey to further encourage response from those residents already within the defined random sample, 3) a postcard with an abbreviated version of the survey hung on doors around the neighborhood (with a particular focus on apartment complexes), 4) an abbreviated postcard survey collected in person at the September 20, 2014 ice cream social event in Cheyenne/Arapaho Park, and 5) an open link online survey for members of the public who were not part of the invitation sample. These varied efforts were specially undertaken to obtain responses from the largest possible sample of community members. Trends It is a challenge and an opportunity for parks and recreation providing agencies to continue to understand and respond to the changing recreation interests of their constituencies. In this fast paced society, it is important to stay on top of current trends. Trends were researched at the local, regional, and national level relevant to the somewhat younger and multi cultural Four Square Mile Neighborhood demographic, and included amenities such as dog parks, shaded areas, outdoor gyms, trails, and spraygrounds. Programming trends reflect partnerships with the health community, nature based activities, and individual and group activities, including more purposeful use of outdoor areas. Improved funding for parks and recreation in general is being widely reported following the decline during the recession. 4 Four Square Mile Neighborhood
11 Inventory and Level of Service The purpose of the Level of Service (LOS) analysis is to evaluate how facilities and parks in the Four Square Mile Study Area serve the community. This analysis may be used as a tool to benchmark current level of service and to direct future planning efforts. Combined with other findings, including survey results and focus group and stakeholder feedback, it also indicates the level of service anticipated by the community. Several general findings were revealed by the LOS Analysis that seem to be of particular importance. The entire Four Square Mile Study Area has adequate level of service for those residents with a motor vehicle. Though walkable access to all recreation is quite good, with 87% of the study area having some level of service, only 51% of the study area meets or exceeds the minimum standard threshold score. The Cherry Creek Greenway Trail and High Line Canal Trail significantly impact the level of service in parts of the study area where these two components account for more than half of LOS scoring in places that are above the identified threshold, or comprise the entirety of scoring in some areas. Several areas have no walkable access to recreation at all including a substantial area of high population density in the northeast of the study area south of Mississippi Avenue. Specific focus areas within identified zones are particularly good priorities for future service improvements, as these are low service or no service areas with higher population densities and lower annual household incomes, and some lack access to any alternative provider facilities. Specific gap areas are indicated on the Findings Map in the main body of the report. Potential Funding Opportunities Arapahoe County Recreation District funds have been and will be available for use for outdoor recreational opportunities and amenities in the Four Square Mile Neighborhood as the budget allows. Additionally, Arapahoe County Open Space funds have been and will be available for property where use is limited to passive outdoor recreation again, where budgets and fund balances allow. Once this plan is completed and recommendations are considered for implementation, additional funding for active recreational uses can come from a variety of sources including the Arapahoe County Open Space grant program, Great Outdoors Colorado (GOCO) grant funds and other potential funding sources depending on the availability of required match funds. Recreation Needs and Opportunities Assessment 5
12 Recommendations Recommendations of this Plan are summarized in the box below and an Implementation Plan follows. It is assumed that all capital efforts will go through the appropriate public input process as they are undertaken. More detail about the recommendations is found in the main document. A system of asset monitoring should be implemented to maintain the existing level of service at Arapahoe County parks and open spaces in the Four Square Mile Study Area. Undeveloped County lands at Long s Pine Grove, Quebec Way Trailhead, and Wayside Park should be developed to boost the level of service for nearby residents. Public access to additional resources should be pursued or developed to increase service in focus areas A, B, C, D, E, and F as outlined on the Findings Map. Partnering with Denver and Aurora to make school assets such as athletic fields, ball courts, and playgrounds more available to nearby residents would improve the level of service in the Four Square Mile Study Area. Improved access to Challenge School in Aurora would have particular impact, as it is located within a low service area adjacent to a notable no service area. A public, off leash dog park should be considered if a suitable location can be determined within the Four Square Mile Study Area. A community garden should be considered if a suitable location can be determined within the Four Square Mile Study Area. A County wide Trails Master Plan should be developed to include the Four Square Mile Neighborhood. With valuable regional trails already established to serve the community, additional trail connections to neighborhood trails and parks should be planned for and developed. Additional crossing points should be developed to span the High Line Canal in order to provide better public access to resources on the other side, and to the High Line Canal Trail itself. Long term sustainability of the High Line Canal and its natural and recreational resources should be promoted through work with Denver Water and other jurisdictions. Appropriate land acquisition opportunities should be explored. Land development code changes and opportunities for land dedication for parks and trail corridors should be explored through the County. Implement a strategic, brand consistent communications campaign to promote enhanced awareness and use of both existing recreational amenities and future improvements. Tactics may include public trail and facility mapping, hierarchy of signage for identification and wayfinding, and use of the Arapahoe County web site, as well as optimized web based technologies for smartphone and tablet use. 6 Four Square Mile Neighborhood
13 Implementation Plan Project Site Goal Next Steps Timeframe Arapahoe County Explore opportunities for land dedication for parks and trail corridors. Participate in County land development code changes Ongoing Arapahoe County Work with neighboring jurisdictions to increase level of service in focus areas; including partnerships with schools. Utilize report recommendations to encourage increases Ongoing Four Square Mile Neighborhood Strive to reach and maintain an adequate level of service. Monitor Assets using Level of Service Analysis Ongoing High Line Canal Trail Ensure the long term sustainability of the trail and its natural and recreational resources. Participation with Denver Water and multiple jurisdictions Ongoing Four Square Mile Neighborhood Explore appropriate acquisition opportunities. Utilize report recommendations to inform decision making Ongoing Communications Campaign for Awareness and Engagement Increase community awareness and use of existing recreational amenities and future improvements. Develop signage plan and explore technology based enhancements beginning with new mapping features on the AC web site Ongoing Quebec Way Trailhead Development as trailhead with High Line Canal Trail Connectivity and potential passive park amenities. Site plan and development Active Florida Crossing of High Line Canal Trail Identify feasibility, opportunities, and constraints of crossing alternatives. Perform inventory of infrastructure and study use and operations to create recommendations Active Wayside Park Development as small pocket park. Site plan and development of potential park amenities Short Undetermined Pursue development of a dog park. Initial scoping to determine feasibility and suitable location Short Undetermined Pursue development of a community garden. Initial scoping to determine feasibility and suitable location Short Parker/Mississippi Crossing of High Line Canal Trail Determine feasibility of implementing crossing study recommendation of an underpass for the High Line Canal Trail. Research funding and development opportunities and constraints Medium Countywide Trails Master Plan Draft a countywide trails master plan, which includes the Four Square Mile Neighborhood. Regional and community trail connectivity analysis and recommendations Medium Long's Pine Grove Development as trailhead with High Line Canal Trail connectivity and potential passive park amenities. Site plan and development Medium Cheyenne/Arapaho Park Development of west side of park. Site plan and development, including utilization of study to inform potential amenities Medium Iliff Corridor Corridor received Transportation Improvement Program funding for transportation operations, including bike/pedestrian facilities. Design and build bike/pedestrian facilities as part of transportation project Long Recreation Needs and Opportunities Assessment 7
14 THIS PAGE INTENTIONALLY LEFT BLANK
15 II. The Planning Context A. Purpose of the Needs and Opportunity Assessment Arapahoe County has conducted a Parks and Open Space Needs and Opportunity Assessment for the Four Square Mile Neighborhood. The demographically diverse Four Square Mile neighborhood is located in the northwest section of unincorporated Arapahoe County, is bordered by the City and County of Denver and the City of Aurora, is home to over 20,000 residents, and lies within the Arapahoe County Recreation District. The 2.6 square mile area currently has two small neighborhood parks, a trailhead, and four open space/undeveloped areas, totaling approximately 20 acres. Several of these properties have access to the High Line Canal and Cherry Creek Trail. The goal of the Needs and Opportunity Assessment is to determine the level of service that Arapahoe County should provide residents of Four Square Mile. It is an important and necessary first step toward increasing recreation opportunities for the residents. B. Background of the Study In 2013, the Arapahoe County Recreation District applied for a planning grant from the Arapahoe County Open Spaces Department to complete the needs and opportunity assessment. The funding was secured in June This planning study focuses on residents in the Four Square Mile neighborhood, but in addition, examines a service area defined as a quarter mile radius around the Four Square Mile area. There is a need for additional recreation facilities within the community and additional neighborhood trail connections to the regional trail network, as two regional trails pass through the community, but connectivity to these trails is minimal. The study includes an analysis of existing conditions; recommendations for improving recreation opportunities; and an implementation plan that addresses short, medium, and long term improvements. C. Governing Structure Arapahoe County is governed by an elected Board, the Board of County Commissioners (BoCC), which oversees the County by serving as an administrative and policy making body. The five member Board approves the budget, hires staff, supervises land use planning and development, and administers county services. Within the County, special districts, such as the Arapahoe County Recreation District, provide residents with a variety of attractive residential choices, including excellent parks, greenbelts, and trail systems services. The Four Square Mile neighborhood falls within the Arapahoe County Recreation District. The area cannot be incorporated into the cities of Denver or Aurora due to decades old zoning regulations. Recreation Needs and Opportunities Assessment 9
16 In addition to the Arapahoe County Recreation District, the Four Square Mile neighborhood falls within the following special fee/taxing overlay districts: The Cherry Creek Valley Water and Sanitation District that has been providing water to the unincorporated Arapahoe County area since More information can be found at: The Cherry Creek School District whose mission is, To inspire every student to think, to learn, to achieve, to care. More information can be found at: RTD District A that provides regional public transit services. More information can be found at: denver.com/index.shtml Cunningham Fire Protection District that has been providing emergency services since More information can be found at: Southeast Metro Stormwater Authority that has been providing stormwater management services for drainage and flood control facilities since January More information can be found at: D. Related Planning Efforts This plan is informed by, and (where appropriate) provides a connection to, past planning efforts. Reviewed plans included, but were not limited to: 2013 Arapahoe County Recreation District Grant Application Arapahoe County 2035 Transportation Plan Arapahoe County Open Spaces Master Plan Arapahoe County Comprehensive Plan including the Four Square Mile Sub area Plan High Line Canal Preservation and Enhancement Study Design Guidelines for the Urban Service Area of Unincorporated Arapahoe County 2003 Colorado Statewide Comprehensive Outdoor Recreation Plan City of Aurora Comprehensive Plan City and County of Denver Comprehensive Plan Greenprint Denver 10 Four Square Mile Neighborhood
17 E. Methodology for this Study This study is based on a comprehensive planning process that took place from January 2014 through March 2015 and involved extensive staff and community input as well as research and analysis of the existing parks and recreation system in the Four Square Mile Neighborhood and the surrounding quarter mile buffer area. It includes key findings and information gathered from the demographic and trends analysis; a public input process; a citizen survey; inventory and analysis of existing parks, open space, trails, and facilities; and analysis of funding resources. Based on this analysis, recommended goals and strategies are included to address the key issues identified in the needs assessment and findings phase of the project. This project has been guided by Arapahoe County staff, and the Four Square Mile Neighborhoods Group was specifically engaged in the process. This collaborative effort fully utilized the consultant s expertise and incorporated local knowledge and institutional history. The project consisted of the following tasks. Review of previous planning efforts and Department historical information Research of demographics and trends Public engagement through public meeting, focus groups, and on line input opportunity Administration of a community survey Generation of a SWOT (strengths, weaknesses, opportunities, and threats) analysis Assessment of inventory Analysis of level of service Identification of key issues Development of recommendations that offer a range of options to improve recreation opportunities Development of an implementation plan detailing short, medium, and long term recommendations; the costs of each; and identification of potential funding sources F. Master Plan Schedule Project Timeline: Perform Existing Conditions Analysis March 2014 October 2014 Public Outreach April 2014 December 2014 Develop Existing Conditions Report October 2014 December 2014 Develop Recommendations November 2015 February 2015 Develop Draft of Needs and Opportunity Assessment Report January 2015 February 2015 Develop Final Report February 2015 March 2015 Recreation Needs and Opportunities Assessment 11
18 THIS PAGE INTENTIONALLY LEFT BLANK
19 III. Our Community and Identified Needs A. Four Square Mile Neighborhood Demographic Profile Demographics displayed below are provided by ESRI Business Analyst Forecasts based on the 2010 U.S. Census Bureau data. Table 1: Summary Demographics for Four Square Mile Neighborhood Summary Demographics Population 20,772 Number of Households 9,674 Avg. Household Size 2.14 Median Age 31.5 Median Household Income $34,582 Source: 2010 U.S Census, ESRI Business Analyst forecasts for 2013 Population Projections Table 2 illustrates that the Four Square Mile Neighborhood population is predicted to increase by an annual rate of 1.63 percent to 22,526 from 2013 to This is up from a population of 14,128 in This compares to an annual growth rate of 1.21 percent for the State of Colorado as a whole. Table 2: Population Projections for the Four Square Mile Neighborhood US Census (2000 and 2010) and ESRI Projections 2000 Population 14, Population 19, Estimated 20, Projected 22,256 Source: U.S. Census and ESRI Business Information Solutions Population, Age Ranges, and Family Information Table 3 displays a demographic overview of the Four Square Mile Neighborhood compared to the surrounding jurisdictions of Denver and Aurora, Colorado. The information in the table was collected for each quadrant using the 2010 U.S. Census data for Age Distribution, Median Age, Average Household Size, and Median Income. Table 3: 2013 Demographic Overview of the Four Square Mile Neighborhood Median Age Average Household Size Median Income FSM Neighborhood $34,582 Denver $43,378 Aurora $49,760 Source: ESRI Business Information Solutions forecasts for 2013 based on the 2010 U.S. Census The median age for the Neighborhood (31.5) is younger than that of Denver (34.2) and Aurora (33.6). The Neighborhood s median household income is significantly lower that of Denver or Aurora. Recreation Needs and Opportunities Assessment 13

20 Age Distribution and Housing Unit Distribution A comparison of the population break down by age for the Four Square Mile Neighborhood, Denver, and Aurora is illustrated in Figure 1. Figure 1: 2013 Breakdown by Age 25.0% 20.0% 15.0% 10.0% Four Square Mile District Denver Aurora 5.0% 0.0% Source: 2010 U.S. Census; 2013 estimates provided by ESRI Business Information Solutions, Four Square Mile has the highest population in the in the age cohort (9.5%) and in the age cohort (22.4%). Aurora has higher populations in the youth 0 19 age range (29.4%) compared to 25.4% for the Neighborhood and 24% for Denver. Denver and Aurora have the highest populations in the age range (each with about 33.5%), while the Four Square Mile Neighborhood s older population is much smaller (27.1%) As reflected in Table 4, in 2013, the Four Square Mile Neighborhood had 10,234 housing units with a 25 percent owner occupied housing rate, compared to a 69.3 percent renter occupied rate. Table 4: Four Square Mile (FSM) Neighborhood Residential Statistics FSM Denver Aurora Median home value $202,868 $260,029 $186, 027 Total housing units 10, , ,497 Percent owner occupied 25% 42.9% 52.9% Percent renter occupied 69.3% 49.7% 40.9% Percent vacant 4.3% 7.4% 6.2% Source: 2010 U.S. Census; 2013 estimates provided by ESRI Business Information Solutions, Four Square Mile Neighborhood
21 Race/Ethnicity Comparing the racial/ethnic population breakdown for Four Square Mile Neighborhood, Denver, and Aurora reflects significantly differing ethnic profiles. The African American population in Four Square Mile is at a little over 21%, compared to 9.9% for Denver and 9.6% for Aurora. The Four Square Mile Asian population (7.1%) is higher than that of Denver (3.6%) and Aurora (3.9%). Denver and Aurora have similar Caucasian and Hispanic populations at over 68% and over 30%, respectively, compared to Four Square Mile s Caucasian population of 56.9% and Hispanic population of 19.7%. Table 5: Ethnicity Statistics (2013) FSM Denver Aurora Caucasian Alone 56.9% 68.8% 68.4% African American Alone 21.3% 9.9% 9.6% American Indian Alone 0.9% 1.4% 1.4% Asian Alone 7.1% 3.6% 3.9% Some Other Race Alone 8.4% 12.1% 12.3% Two or More Races 5.3% 4.2% 4.4% *Hispanic Origin (Any Race) 19.7% 32.3% 30.7% Source: 2010 U.S. Census; 2013 estimates provided by ESRI Business Information Solutions, *Note: Hispanic Origin is a separate look at the population, irrespective of race. Household Income The estimated 2013 median household Income for residents of the Four Square Mile Neighborhood was $34,582, compared to $43,378 for Denver and $49,760 for Aurora. Median income for Four Square Mile is forecast to grow to $37,690 by 2018, to $50,795 for Denver, and to $56,273 for Aurora. Figure 2 illustrates the full income distribution for Four Square Mile, Denver, and Aurora estimated for Four Square Mile has the highest percentage of lower income residents, with 66.7% of residents earning under $50,000, while Aurora has the highest percent of higher income residents, with 49.9% earning $50,000 or more. More Four Square Mile and Denver residents earn less than $15,000, at 22% and 17.2% respectively, than any other income range. The highest income range for Aurora (19%) is the $50,000 $74,999 income range. Recreation Needs and Opportunities Assessment 15
22 Figure 2: Annual Household Income Distribution Comparison (2013) 25.0% 20.0% 15.0% 10.0% 5.0% 0.0% Four Square Mile District Denver Aurora Source: ESRI Business Information Solutions, 2012 Employment According to the ESRI estimates for 2013, the industries in the Four Square Mile Neighborhood providing the greatest employment percentages are the Service Industry (49.2%), Retail Trade (14.2%), and Finance/Insurance/Real Estate (11%). Figure 3 reflects the ESRI estimate of employment by occupation in Four Square Mile in Figure 3: 2013 Employment by Occupation Public Administration Services Finance/Insurance/Real Estate Information Transportation/Utilities Retail Trade Wholesale Trade Manufacturing Construction Agriculture/Mining 5.4% 11.0% 3.5% 7.4% 14.2% 2.6% 3.4% 2.7% 0.6% 49.2% 0.0% 10.0% 20.0% 30.0% 40.0% 50.0% 60.0% Source: ESRI Business Information Solutions, 2013 estimate from 2010 U.S. Census 16 Four Square Mile Neighborhood
23 Education According to a U.S. Census Bureau study, education levels had more effect on earnings over a 40 year span in the workforce than any other demographic factor, such as gender, race, and ethnic origin. As Shown in Figure 4, ESRI s forecasts from the U.S. Census provide the following education level estimates for 2013 in the Four Square Mile Neighborhood, Denver, and Aurora: Four Square Mile has the highest percentage of residents with Bachelor s Degrees (31%). Denver has the highest percentage with Graduate/Professional Degrees (16.5%). Aurora has the highest percentage of High School Graduates (26.3%) and residents with Some College, No Degree (23.7). Figure 4: Educational Attainment Comparison: Four Square Mile, Denver, and Aurora (ages 25+) 35.0% 30.0% 25.0% 20.0% 15.0% 10.0% 5.0% 0.0% Four Square Mile District Denver Aurora Source: ESRI Business Information Solutions, 2013 estimate from 2010 U.S. Census. Health Ranking The United Health Foundation has ranked Colorado 8 th in its 2013 State Health Rankings, up from a ranking of 9 th The State s biggest strengths include: Low prevalence of obesity, physical inactivity, and diabetes Low levels of air pollution Low rate of preventable hospitalizations Some of the challenges the State faces include: High prevalence binge drinking High rate of drug deaths Large disparity in health status by educational attainment Source: Recreation Needs and Opportunities Assessment 17
24 Demographic Profile Summary The Four Square Mile Neighborhood population is predicted to increase at a higher rate than the State of Colorado as a whole, from 2013 to 2018, by an annual rate of 1.63%, to 22,526. Compared to the surrounding cities of Denver and Aurora: The household size is somewhat lower. The median income is significantly lower with more Four Square Mile residents earning less than $15,000 than any other income range. The median age is somewhat lower, with Four Square Mile having a significantly higher numbers in the year old age groups. The Four Square Mile Neighborhood has a 25 percent owner occupied housing rate, compared to a 69.3% renter occupied rate. Home values fall between the lower values in Aurora and the higher values in Denver. Ethnicity is considerably different than the very similar ethnicities of Denver and Aurora. The percentage of African American and Asian population is approximately double in Four Square Mile, while the Caucasian population in significantly lower. B. Community and Stakeholder Input Focus Groups, Stakeholder Interviews, and Public Meetings Engaging the public with sufficient and meaningful mechanisms for input allows for frank and open discussions about the current state and future of parks and recreation. To gain valuable insight into the needs and interests of the community, the public input process included: February 12 Presentation to the Four Square Mile Neighborhoods Group. April 23 Public Input/Project Scoping Session with the Four Square Mile Neighborhoods Group. May Afternoon and evening focus groups targeting citizens from church groups and homeowner associations representing the following areas: Iliff to SW of Parker, NE of Parker, and south of Iliff; local government agencies; and school/youth groups; along with County staff. August 13 Focus group with Four Square Mile Neighborhoods Group and Homeowner Associations. September 20 Ice Cream Social free community event at Cheyenne/Arapaho Park with option to complete survey. February 11 Findings and Draft Recommendations presented to the Four Square Mile Neighborhoods Group. March Posting of draft report on County website for opportunity for public review and comment. March 17 Study Session Presentation to the Arapahoe County Board of County Commissioners. 18 Four Square Mile Neighborhood
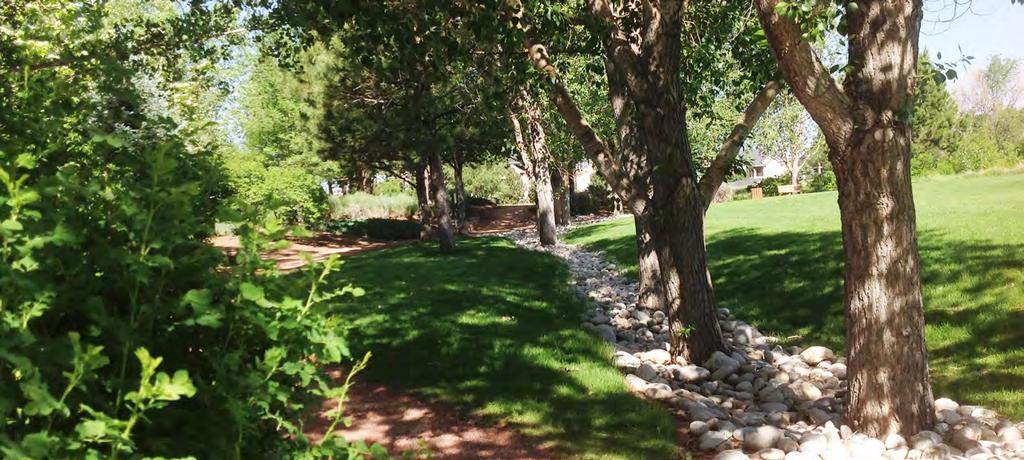
25 The following information was gathered from focus group and public meeting participants, as well as the on line MindMixer site, regarding strengths, weaknesses, opportunities, and threats that could be addressed through this planning process. These are summarized below. (See Appendix A for full list of comments.) Strengths The rural feel and natural setting. Mature landscaping and trees. Cheyenne/Arapaho Park is well maintained. Great bike trails (safety and accessibility). The High Line Canal Trail is good and is wide enough for both bikers and walkers. Weaknesses Parker Road accessibility and sometimes parking. Lack of trail underpass at Parker and Florida. Lack of a dog park, lack of dog cleanup and supplies at posts. Limited accessibility to trails and parks like Welch Park. Welch Park no access to HLC Trail. Need more parks on the east side of Parker Road. Lack of amenities between Florida and Mississippi east of Parker Road. Lack of understanding by public of what is public and what is private land. There are no gathering settings where large groups can congregate. Opportunities Maintenance and continuation of natural and rural look and feel in the community Easy to care for, Xeriscape to cut down on fire hazard, low crime, safe traffic, and pedestrian access. Preservation of views and mature landscaping. Improved trail system, maintaining what is currently available and improve surfaces and maintenance. Respect for the existing wildlife (deer, owls, and coyotes have made their homes here). Safety Safer routes for pedestrians in heavy traffic locations. Lighting in regard to safety. ADA accessibility. Need for overhead shading. Property Acquisition Acquisition of property while it is still available over the next year or two. Mississippi corridor should be more active for acquisition. Specific use areas as a short term need versus additional multi use areas for long term development. Recreation Needs and Opportunities Assessment 19
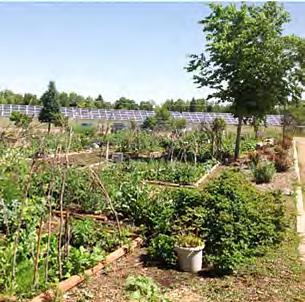
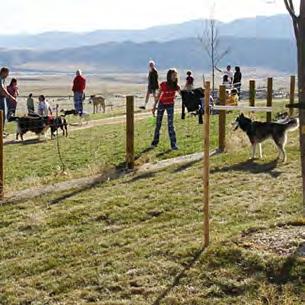
26 More Trail Connections to High Line Canal and Cherry Creek Trails New offerings Restrooms Dog Park Ice Skating Rink Community Garden Trail Connections Community Art Installations/Art in Public Spaces Exercise Station (circuit) Specially Focused Parks (example: mediation park) Place for Young Kids (non descript) Things to do (indoor basketball park) recreation center, like Utah Park facility Senior center Threats Development along High Line Canal Trail could impact the use of that trail and cause loss of properties of park/open space purposes. Modifications to the canal need to be considerate of those that live around it. Long term sustainability of the water in the canal. There is no single identity of Four Square Mile Community South Parker vs. North Parker; East and West of Parker. Key partners and stakeholders who can help Homeowner Associations: Camden Park, Mountain View Gardens, Alton Park Apartment Complex Owners Local governmental agencies: Water District, Fire District, Library District, Sheriff Department Biking Group Tri County Health Denver Water Board Funding considerations Fees in lieu from development Bond issue Sales tax Arapahoe County Open Space grant GOCO Combination of tax and pay for service Sponsorship and dog licensing fees LID (Local Improvement District) Tax Aurora could annex Public improvement fee like Havana Gardens Kickstarter 20 Four Square Mile Neighborhood


27 MindMixer Online Community Engagement This project included creating an online community engagement site using the MindMixer platform (EnvisionFourSquareMile.mindmixer.com). This tool was designed to enhance community involvement and obtain additional feedback from people who may not necessarily attend meetings. The average age of those who participated was 47 years old, and the majority were female. There was a moderate amount of traffic generated on the site, with 153 unique visitors and 794 page views with 16 ideas generated and discussed. These ideas were consolidated with the public input received from focus groups and public meetings reported above. Citizen Survey Methodology The purpose of this study was to gather public feedback to gauge residents desire for parks, recreation, open spaces, and trails within the Four Square Mile Neighborhood. This survey research effort and subsequent analysis were designed to assist the Arapahoe County Recreation District in the creation of a needs assessment for Four Square Mile in order to determine the level of service that the County should be providing residents in the neighborhood. The survey was conducted using five methods: 1) a mail back survey sent to a random selection of households, 2) an online, invitation only web survey to further encourage response from those residents already within the defined random sample, 3) a postcard with an abbreviated version of the survey hung on doors around the Neighborhood (with a particular focus on apartment complexes), 4) an abbreviated postcard survey collected in person at the September 20, 2014 ice cream social event in Cheyenne/Arapaho Park, and 5) an open link online survey for members of the public who were not part of the invitation sample. These varied efforts were specially undertaken to obtain responses from the largest possible sample of community members. Because the survey distributed at the ice cream social event and open link online survey were open to the entire community, there did exist the possibility of duplicate responses from those respondents who received an invitation survey or postcard survey via doorknob bags. However, it was determined that the benefit of reaching out to community members in as many ways as possible to boost response from a varied population of residents outweighed the potential for skewing the survey with multiple responses. Recreation Needs and Opportunities Assessment 21
28 Both the random sample and open link respondents took the full length version of the survey, while those who received a postcard door hanging or attended the ice cream social event took an abbreviated version of the survey. The analysis herein primarily focuses on overall response from all of these methods combined. However, several questions were only asked in the full length survey. In those cases, the overall results from the random and open link samples will be assessed. The primary list source used for the mailing was a third party list purchased from Melissa Data Corp., a leading provider of data with emphasis on U.S., Canadian, and international address and phone verification as well as postal software. Use of the Melissa Data list also includes renters in the sample who are frequently missed in other list sources such as utility billing lists. A total of 2,558 surveys were mailed to a random sample of Four Square Mile residents, and an additional 2,500 postcard surveys were stuffed in doorknob bags and distributed around the community in September The final sample size for this survey was 274, resulting in a margin of error of approximately +/ 5.9 percentage points calculated for questions at a 50 percent response. 1 The underlying data were weighted by age to ensure appropriate representation of Four Square Mile residents across different demographic cohorts in the sample. Due to variable response rates by some segments of the population, the underlying results, while weighted to best match the overall demographics of residents, may not be completely representative of some sub groups of the population, including younger residents and those in the Latino community. The complete survey report, comments, and crosstabs have been provided separately as a Staff Resource Document. Demographic Profile of Responses The following describes the respondent and household demographics of the invitation sample. Gender Most respondents are female (61%), while 39 percent of respondents are male. Age Forty three percent (43%) of respondents are under age 35; 21 percent are in the 35 to 44 age cohort; 15 percent are in the 45 to 54 age cohort; 11 percent are in the 55 to 64 age cohort; and 10 percent are 65 or older. The average age of respondents is 42.4 years with a median age of Ethnicity/Race Seven percent of all respondents consider themselves to be of Hispanic, Latino, or of Spanish origin. Additionally, most respondents report that they are white (84%), followed by Asian/Asian Indian/Pacific Islander (11%), Black/African American (8%), and Native American (3%). Five percent of all respondents identified as an other race not listed. 1 For the total sample size of 274, margin of error is +/ 5.9 percent calculated for questions at 50% response (if the response for a particular question is 50% the standard way to generalize margin of error is to state the larger margin, which occurs for responses at 50%). Note that the margin of error is different for every single question response on the survey depending on the resultant sample sizes, proportion of responses, and number of answer categories for each question. Comparison of differences in the data between various segments, therefore, should take into consideration these factors. As a general comment, it is sometimes more appropriate to focus attention on the general trends and patterns in the data rather than on the individual percentages. 22 Four Square Mile Neighborhood
29 Language Spoken A vast majority of respondents speak English at home (97%). Three percent of respondents noted that they speak Spanish at home, and six percent reported that they speak an other language. Several open ended responses were provided. While many languages are listed, Russian is mentioned most frequently. Respondents were able to check all that apply for this question, so responses sum to over 100 percent. Number of People in Household Only respondents who took the full length version of the survey were asked to report the number of people in their household. Respondents reported an average of 2.2 persons living in the household. Twenty seven percent (27%) of respondents reported living alone, 59 percent live in households of 2 to 3 people, and 14 percent live in households of at least four people. Household Members Under Age 18 Seventy one percent (71%) of respondents do not have any children in the home, while 29 percent do. Of those with household members under age 18, 17 percent have one child in the home, 10 percent have two, and 2 percent have three or more. Household Members Over Age 55 Sixty seven percent (67%) of respondents do not have household members age 55 or older in the home, while roughly one third of respondents do. Of those with household members over age 55, 20 percent have one household member in this age group in the home and 12 percent have two or more. Survey Responses Importance of Local Recreation Opportunities As shown in Figure 5, respondents indicated that local recreation opportunities in the Four Square Mile neighborhood are considered very important, with 85 percent of respondents providing a rating of 3 or 4 and an average rating of 3.4, on a scale of 1 to 4. Younger age cohorts were slightly more likely to report that these opportunities were essential. Recreation Needs and Opportunities Assessment 23
30 Figure 5: Importance of Availability of Parks and Recreation Opportunities Degree to Which Current Four Square Mile Facilities are Meeting Community Needs Figure 6 shows that the Cherry Creek Regional Trail earned the highest average rating (4.1), followed by Cheyenne/Arapaho Park (3.6), Wabash Trailhead (3.6), and Welch Park (3.5). The facilities also received shares of respondents reporting the community s needs were being 5 = completely met in this same order. Of interest is the fact that a high share of respondents noted that they did not know for Welch Park (45%), Cheyenne/Arapaho Park (42%), and Wabash Trailhead (42%). Such results suggest that these particular facilities may not have a large degree of community engagement. 24 Four Square Mile Neighborhood
. Word of mouth was also somewhat or strongly preferred by a notable share of respondents (76%).")
31 Figure 6: Degree to Which Needs are being Met by Current Facilities Preferred Communication Methods As shown in Figure 7, respondents most strongly prefer receiving information via the Arapahoe County website (79% strongly or somewhat prefer). Word of mouth was also somewhat or strongly preferred by a notable share of respondents (76%). In a second tier of response, respondents indicated preference for Arapahoe County brochures/publications (66% somewhat or strongly prefer), local TV or radio stations (65%), news websites (62%), and newspapers (61%). Meanwhile, social media and Arapahoe County meetings earned lower shares of respondents noting these to be preferred. Thirty six percent (36%) of respondents not at all prefer social media and 49 percent not at all prefer meetings. Recreation Needs and Opportunities Assessment 25

32 Figure 7: Preferred Methods for Receiving Information on Recreation Opportunities Method of Access and Length of Travel All respondents were asked how they access Four Square Mile Neighborhood recreational amenities, as well as how far they travel to access regular recreational opportunities. Most respondents access recreational opportunities by walking (79%), while somewhat smaller shares access by driving (56%) or biking (44%). Relative to how far they regularly travel to access opportunities, most reported traveling between one and three miles (42%). Owners are more likely to stay within one mile of home to access recreational opportunities (34%) than renters (17%). 26 Four Square Mile Neighborhood
33 Figure 8: Transportation Preferences Importance of Future Facilities and Amenities over the Next 5 to 10 Years Respondents rated the importance of adding or improving a list of 16 different facilities and amenities in the Four Square Mile Neighborhood (Figure 9). The following had the highest shares of respondents providing a rating of 4 or 5 ( Important ): Neighborhood parks (86% of respondents providing a rating of 4 or 5 ) More trail connections (84%) Paved recreational paths (83%) Open space/natural areas (82%) Unpaved/natural trails (81%) Regional parks (79%) A couple of facilities/amenities had higher shares of respondents noting that the facility was more unimportant (providing a rating of 1 or 2 ) than important ( 4 or 5 ). These include a skateboard park (58% not important vs. 16% important) and disc golf amenities (53% not important vs. 26% important). Meanwhile, an outdoor swimming pool had somewhat similar shares of respondents noting that it was important (41%) and not important (34%). Recreation Needs and Opportunities Assessment 27

, followed by neighborhood parks (14%), and more trail connections (11%).")
34 Top Priorities for Additions, Expansions, or Improvements of Facilities and Amenities Figure 9 shows the percentage of respondents who reported each facility as a first, second, or third priority for additions, expansions, or improvements. Neighborhood parks and open space/natural areas are the top priorities at 34 percent. Paved recreational paths (32%), unpaved/natural trails (31%), off leash dog parks (27%), and more trail connections (27%) closely follow. Relative to choices for the number one top priority, off leash dog parks topped the list (16%), followed by neighborhood parks (14%), and more trail connections (11%). Due to the fact that over three quarters of the area population are renters, responses were additionally segmented by whether the respondent owns or rents their home (Figure 10). Among owners, open space/natural areas are particularly important, with 44 percent reporting this as one of their top three priorities, compared to 22 percent of renters. Owners were also much more likely to report paved recreational paths as a priority (39% vs. 25% of renters), as well as more trail connections (33% vs. 21%), and regional parks (16% vs. 6%). Meanwhile, renters most commonly reported neighborhood parks as one of their top three priorities (36%), while unpaved/natural trails were a close second (33%). In addition to these top two choices, renters also indicated greater interest in the following as compared to owners: community gardens (29% vs. 12%), playgrounds (23% vs. 12%), community gathering space or outdoor event facility (14% vs. 9%), picnic shelters (11% vs. 3%), and a skateboard park (10%). Figure 9: Top Three Priorities for Additions, Expansions, or Improvements of Future Facilities and Amenities 28 Four Square Mile Neighborhood


35 Figure 10: Top Three Priorities for Future Facilities and Amenities: Owners vs. Renters Recreation Needs and Opportunities Assessment 29
36 Financial Support for Public Recreational Facilities All respondents were asked to provide their feedback on which funding streams should be used to financially support public recreational facilities and services. Figures 11, 12, and 13 illustrate the responses. The most cited funding mechanism was taxes, chosen by 76 percent (76%) of all respondents. Alternative funding, such as sponsorship or donations, was a close second (70%). User fees were relatively less popular (42%), and 11 percent of respondents opted for an other mechanism. While not many comments were received, other suggestions included the lottery and gambling. Renters were somewhat more likely to favor taxes (80%) over homeowners (73%). Meanwhile, homeowners showed a slightly higher preference toward alternative funding (74% vs. 66%), and notably more interest in user fees (54% vs. 29%). Level of Support for a Tax Increase or Bond Issue All respondents were also asked to indicate their level of support for a potential tax increase or bond issue if it is found that there are insufficient funds to build and/or properly maintain recreational facilities and programs to the standards desired by the community. Just over one in five respondents noted that they would definitely support either a tax increase (22%) or bond issue (21%). A higher share of respondents noted that they would probably support either a tax increase (43%) or bond issue (44%). Overall, respondents generally support either measure. However, the tax increase received a higher share of respondents who would probably or definitely not support such a measure (26%) than did the bond issue (14%). Meanwhile, the bond issue had a higher share of respondents indicating that they didn t know or were uncertain (21%) as compared to the tax increase (10%). When segmented by whether the respondent owns or rents their home, results show that a slightly higher share of homeowners would probably or definitely not support either a tax increase (31% vs. 22% of renters) or a bond issue (19% vs. 10% of renters). Areas of Focus for Taxpayer Revenue Respondents to the full length survey were asked an additional financial question. They were prompted to allocate a hypothetical $100 of taxpayer revenue to eight different categories. This exercise is useful in determining areas of greatest importance among respondents. Trail and parks had the highest average amount of money allocated toward them, at $21 each, respectively. In a second tier of options were recreation centers ($14), conservation efforts ($12), and athletic fields and courts ($11). Recreation programs ($9), cultural arts ($8), and other ($4) received relatively less money, on average. While several comments were collected for other areas of focus, dog parks were most frequently mentioned. 30 Four Square Mile Neighborhood

37 Figure 11: Financial Choices/Fees Recreation Needs and Opportunities Assessment 31


38 Figure 12: Financial Choices/Fees: Owners vs. Renters 32 Four Square Mile Neighborhood

 Recreation Needs and")
39 Figure 13: Preferences for Budgeting Taxpayer Revenue for Parks, Recreation, and Trails in Four Square Mile (Random Sample and Open Link Respondents Only) Recreation Needs and Opportunities Assessment 33
40 C. Trends It is a challenge and an opportunity for parks and recreation providing agencies to continue to understand and respond to the changing recreation interests of serviced populations. In this fast paced society, it is important to stay on top of current trends. The following highlights relevant local, regional, and national recreation trends relative to the Four Square Mile Neighborhood demographic and identified interests. More detail can be found in Appendix B. Demographic Trends Millennials lead structured lives filled with rules and regulations. Less accustomed to unstructured play than previous generations and apprehensive of the outdoors, they spend most of their time indoors, leaving home primarily to socialize with friends and families. With an upbeat and can do attitude, this generation is more optimistic and tech savvy than its elders. With their varied life experiences, values, and expectations, Baby Boomers are predicted to redefine the meaning of recreation and leisure programming for mature adults. Boomers are second only to Gen Y/Millennials (born between 1980 and 1999) in participation in fitness and outdoor sports. Boomers will reinvent what being a 65 year old means. The Four Square Mile Neighborhood is a good example of our country s transformation from a mostly white Baby Boomer culture to the more globalized multi ethnic country that we are becoming. Cultural and ethnic diversity adds a unique flavor to communities expressed through distinct neighborhoods, multicultural learning environments, restaurants, places of worship, museums, and nightlife. In our country, Hispanic participants and nonparticipants alike cite a lack of access to nearby places to participate in outdoor activities as a barrier to participation more often than other ethnicities. The most popular outdoor activities among African Americans are: running and jogging; fishing; and road, mountain, and BMX biking. Technology use for finding outdoor recreation opportunities is highest among Asian/Pacific Islander populations. The most popular outdoor activities among Asian/Pacific Islanders are: running and jogging; road, mountain, and BMX biking; hiking; and camping (car, backyard, and RV). Young adults engage in mobile data applications at much higher rates than adults in age brackets 30 and older. It is also a fact that minority Americans lead the way when it comes to mobile internet access. Facility Trends The year 2013 was the second year in which dog parks were the top planned addition to parks and recreational facilities in the country. Dog parks can be as simple as a gated area, or more elaborate with designed for dogs amenities like water fountains, agility equipment, and pet wash stations, to name a few. Communities around the country are considering adding shade structures as well as shade trees to their parks, playgrounds, and pools, as a weapon against cancer and against childhood obesity. 34 Four Square Mile Neighborhood
41 That a connected system of trails increases the level of physical activity in a community has been scientifically demonstrated through the Trails for Health initiative of the Centers for Disease Control (CDC). Trails can provide a wide variety of opportunities for being physically active. Park and recreation agencies have begun installing outdoor gyms, with equipment comparable to what would be found in an indoor workout facility, such as leg and chest presses, elliptical trainers, pull down trainers, etc. Such equipment can increase the usage of parks, trails, and other outdoor amenities while helping to fight the obesity epidemic and increase the community s interaction with nature. There is an increasing trend toward indoor leisure and therapeutic pools. Additional amenities such as spray pads are becoming increasingly popular as well. Programming Trends The State of Colorado, along with non profit partners such as the Colorado Health Foundation and Live Well Colorado, has invested in numerous programs aimed at countering the obesity epidemic. Efforts are directed at healthy eating and combating sedentary lifestyles. Policy makers want Colorado to be the first state in the country to start reducing obesity levels, which is actually happening in Arapahoe County, where the obesity rate fell from 20.3 in 2006 to a 2011 rate of Figures from the Association for Interpretative Naturalists demonstrate that nature based programs are on the rise. The growth of these programs is thought to come from replacing grandparents as the teacher about the great outdoors. It is also speculated that a return to natural roots and renewed interest in life s basic elements was spurred as a response to September 11, Participation in walking for pleasure and family gatherings outdoors were the two most popular activities for the U.S. population as a whole as reported in a 2012 report. These outdoor activities were followed closely in popularity by viewing/ photographing wildlife, boating, fishing, snow/ice activities, and swimming. There has been a growing momentum in participation in sightseeing, birding, and wildlife watching in recent years. Some of the top ten athletic activities ranked by total participation include: exercise walking, swimming, exercising with equipment, camping, and bicycle riding. A national trend in the delivery of parks and recreation systems reflects more partnerships and contractual agreements reaching out to the edges of the community to support specialized services. The majority of Americans agree that preserving undeveloped land for outdoor recreation is important. A large percentage of outdoor participants also believe that developing local parks and hiking and walking trails is important and that there should be more outdoor education and activities during the school day. Funding Trends According to Recreation Management magazine s 2013 State of the Industry Report, survey respondents from parks and recreation departments/districts reporting about their revenues from 2009 through 2014 reveals the impact of the recession as well as the beginning of a recovery. More than 25 percent of respondents saw their revenues decrease from 2009 to 2010, and 21.8 percent of respondents reported a further decrease in Forty four percent (44%) percent of park and recreation respondents reported increases from 2011 to Recreation Needs and Opportunities Assessment 35
42 THIS PAGE INTENTIONALLY LEFT BLANK

43 IV. Inventory and Level of Service Analysis The purpose of this Level of Service (LOS) analysis is to evaluate how facilities and parks in the Four Square Mile Study Area serve the community. This analysis may be used as a tool to benchmark current level of service and to direct future planning efforts. Combined with other findings, including survey results and focus group and stakeholder feedback, it also indicates the level of service anticipated by the community. A. GRASP Methodology Why Level of Service? Level of Service for a community parks and recreation system is indicative of the ability of people to pursue active lifestyles. LOS can have implications regarding health and wellness, the local economy, and quality of life and tends to reflect community values. It is emblematic of the manner and extent to which people are connected to their communities. Creating the Inventory A detailed inventory of public and semi public physical assets available for recreational use by the Four Square Mile community was assembled for the Level of Service analysis. This asset inventory was created to serve the An analytical technique known as GRASP (Geo Referenced Amenities Standard Process) was used to analyze Level of Service (LOS) provided by assets in Four Square Mile. This proprietary process, used exclusively by GreenPlay and Design Concepts, yields analytical maps and data that may be used to examine access to recreation across the study area. A detailed history and description of GRASP Methodology may be found in Appendix D. Four Square Mile Study Area in a number of ways. It can be used for a variety of planning and operations tasks, such land acquisition and asset management, as well as future strategic and master plans. The assets inventory currently includes public parks, recreation areas, and trails managed by Arapahoe County. Publicly accessible library and school facilities in the study area were also included. Additionally, assets within the study area furnished by alternative providers were also identified. Parks and recreation facilities provided by other government entities, such as the City and County of Denver or the City of Aurora, were located and scored in the inventory process. These were also included in the Level of Service analysis. Many private facilities, such as those provided by homeowners associations and country clubs, were also located for reference only and were not included in the Level of Service analysis. Figure 14 shows the study area and key locations of properties. Larger scale maps may be found in Appendix C. Recreation Needs and Opportunities Assessment 37
44 Figure 14: Study Area Map Four Square Mile Study Area system map showing all inventory included for GRASP analysis. 38 Four Square Mile Neighborhood
45 Asset Scoring In planning for the delivery of parks and recreation services, it is useful to think of parks, trails, indoor facilities, and other public spaces as parts of an infrastructure. This infrastructure allows people to exercise, socialize, and maintain a healthy physical, mental, and social wellbeing. The infrastructure is made up of components that support this goal. Components include amenities such as playgrounds, picnic shelters, courts, fields, indoor facilities, and other elements that allow the system to meet recreational needs of a community. A component is a feature that people go to a park or recreation center to use, such as a tennis court to play a game of tennis, which gives users reason to visit and serves as an intended destination. In the inventory of assets, the following information is collected: Component type and location Evaluation of component functionality Evaluation of associated comfort and convenience features at a location Evaluation of general design and ambience at a location Site photos General comments The immediate surroundings of a component affect how well it functions, so in addition to scoring components, each park site or indoor facility was given a set of scores to rate its comfort, convenience, and ambient qualities. This includes traits such as the availability of restrooms, drinking water, shade, scenery, etc. These modifier values are attributed to any component at a given location and serve to enhance component and location scores. All components and modifiers are scored based on condition, size, site capacity, and overall quality. The inventory team uses the following three tier rating system to evaluate these: 1 = Below Expectations 2 = Meets Expectations 3 = Exceeds Expectations These scores reflect the expected quality of recreational features as compared with typical facilities within the study area provided by Arapahoe County. Catchment Areas People use a variety of transit modes to reach a recreation destination: on foot, on a bike, in a car, via public transportation, or utilizing any combination of these or other alternatives. The mode is often determined, at least in part, by the distance to be travelled. The GRASP system accounts for this by applying more than one catchment area distance to examine access to assets. A catchment area on a map, also called a buffer, is a specific distance drawn around each component. Any point within this distance reflects the score of that component. This is called a service area. These are overlapped and used to calculate a total GRASP Level of Service score for any given point within the study area. This process yields the data used to create all perspective maps and analytical charts. Recreation Needs and Opportunities Assessment 39
46 The GRASP methodology typically applies two different catchment area distances to calculate scoring totals, yielding two distinct perspectives used to examine a recreation system: 1. General Access to Recreation 2. Walkable Access to Recreation General Access analysis applies a primary catchment distance of one mile. This is considered a suitable distance for a bike ride or a short drive in a car. This one mile catchment is intended to capture recreational users travelling from home or elsewhere to a park or facility by way of bike, bus, or car. Walkable Access analysis uses a smaller catchment distance to capture users within walking distance of recreation facilities. This distance can range from as short as 1/4 mile to as long as 1/2 mile depending on the study area. For the Four Square Mile Study Area, a 1/3 mile catchment buffer was used. This a typical catchment distance used in GRASP studies, as it represents a ten minute walk for most users. Academic and professional research is inconclusive on the topic of just how far people are willing to walk for recreation. Some agencies have used one half mile as a walkable distance for studies they have conducted. Other studies in this country and internationally have used one mile or one kilometer (.62 miles) as walkable distances. In the GRASP methodology, a one third mile catchment area is preferred. This distance represents a maximum travel time of 10 minutes based on average human walking speed of three miles per hour. A one third mile catchment accounts for the fact that walking distances are often further than one third of a mile due a gridded street pattern and obstacles in the built or natural environment. This serves to ensure a walking travel time of ten minutes or less for most people. Further discussion of walkable distances and catchment buffer types may be found in Appendix D. Level of Service Analysis Maps and data quantifications produced using the GRASP methodology are known as perspectives. Each perspective is a model of how service is being provided across the study area. The model can be further analyzed to derive statistical information about service in a variety of ways. Maps are utilized along with tables and charts to provide benchmarks a community may use to determine its success providing services. Perspective maps and charts are produced based on scoring calculations determined by applying the GRASP process to the Four Square Mile Study Area inventory. Each facility or asset has been assigned a GRASP score. These GRASP scores are distributed on a map based on catchment areas as described earlier. A GRASP score ascribed to a catchment area yields a service area for a particular asset which reflects that score. When service areas for multiple components are plotted on a map, a picture emerges that represents the cumulative level of service provided by that set of components in a geographic area. Shown on a map, cumulative GRASP scoring is represented by darker or lighter shades. This data can also be used to portray areas that meet or do not meet a minimum standard, usually represented by different colors. A minimum standard GRASP score, also called a threshold, is usually set by the score of a typical park within a recreation system but may also be set using a median score, average score, or some other statistical indicator. See Maps 3A and 3B for illustration. 40 Four Square Mile Neighborhood


47 Map 3A: Darker and lighter orange shades on a perspective map show areas with higher or lower level of service respectively. Also shown are outdoor locations, indoor locations, and city infrastructure. Map 3B: Purple, yellow, and grey shades on a threshold map show areas that meet the minimum standard, fall below the minimum standard, or have no level of service respectively. Recreation Needs and Opportunities Assessment 41
48 Maps 3A and 3B illustrate two common types of perspective maps, the heat map and the threshold map. On a heat map, a darker orange shade results from the overlap of more service areas or areas served by higher quality components. All shades have GRASP scoring values associated with them such that for any given spot on a perspective map there is a GRASP Level of Service score that reflects cumulative scoring for nearby assets. The following sections will discuss the inventory, analysis, and findings from the Four Square Mile Study Area GRASP Level of Service Analysis. B. GRASP Inventory and Assumptions The GRASP Level of Service Analysis includes an inventory of assets and involves several assumptions. Although every effort is made to provide accurate findings, it is important to recognize these assumptions to fully understand the validity and limitations of the Four Square Mile GRASP analysis. Study Area The study area for the GRASP Level of Service Analysis was a boundary drawn one quarter of a mile beyond the Four Square Mile Sub Area boundary as defined in the 2004 Sub Area Plan. For the purpose of this study, in addition to parks and facilities owned and managed by Arapahoe County, park facilities provided by the City and County of Denver and the City of Aurora were included if they fell at least partially within the Four Square Mile Study Area. This included the following assets. Outdoor Locations Four of the inventory locations are owned and operated by Arapahoe County (AC). Also included were three County owned, undeveloped parcels owned by AC, the Eloise May Library grounds, eight City and County of Denver parks, and one City of Aurora park. Three school grounds were included as well, though these were discounted in the analysis due to limited public access. Babi yar Park City and County of Denver Park Bible Park City and County of Denver Park Challenge School Cherry Creek School District School Cheyenne/Arapaho Park Arapahoe County Park City of Chennai Park City and County of Denver Park Cook Park City and County of Denver Park Country Lane Park City of Aurora Park Denver Public School (Unnamed) Denver Public Schools School Eloise May Library Arapahoe Library District Library Golden Key Park City and County of Denver Park Hampden Heights Park City and County of Denver Park Hentzell Park City and County of Denver Park Quebec Way Trailhead Arapahoe County Undeveloped Wayside Park Arapahoe County Undeveloped Jacobs Park City and County of Denver Park Long s Pine Grove Arapahoe County Undeveloped Place Bridge Academy Denver Public Schools School Wabash Trailhead Arapahoe County Park Welch Park Arapahoe County Park 42 Four Square Mile Neighborhood
49 Indoor Facilities Only two indoor facilities were included in the inventory Cook Park Recreation Center and Eloise May Library. Cook Park Recreation Center City and County of Denver Park Eloise May Library Arapahoe Library District Library Trails Two extensive greenway trails were included in the inventory and analysis, the Cherry Creek Greenway Trail and the High Line Canal Trail. Assumptions 1. Proximity equates to access. This means that the presence of a recreational facility within a specific distance indicates that the facility is accessible from a location. Accessibility in this analysis does not refer specifically to ADA accessibility. 2. General access equates to a proximity of one mile, a reasonable distance for a drive in a car. 3. Walkable access equates to a proximity of one third of a mile, a reasonable distance attainable in 10 minutes walking at a leisurely pace. 4. Trails along Cherry Creek and the High Line Canal were each scored to account for value as an active component, a passive component, and as undeveloped green spaces. 5. Barriers within the study area identified as restrictive to non motorized travel include: Quebec St Parker Rd./Leetsdale Drive Mississippi Ave. Iliff Ave. High Line Canal between Parker Rd. and Iliff Ave. 6. The Cherry Creek Greenway was not considered a barrier due to its many access points. 7. Zones created by identified barriers serve as discrete areas of Four Square Mile within which any facilities are accessible without crossing a major street. Nine zones were identified in this way and used in analysis. 8. The minimum standard (also called threshold ) for service equates to that provided by Welch Park, which may be described as a park/facility with four recreation components on a typical site. C. GRASP Analysis The GRASP Methodology involves the overlap of mapping, scoring, demographics, and interpretation of the resulting perspectives to yield a picture of recreational service in a study area. The various efforts undertaken for this analysis are described in full detail below. General findings are summarized in the following section. General Level of Service This perspective indicates general access to recreation in the Four Square Mile Study Area by any means. One mile catchment buffers are placed around each component and shaded relative to the component s GRASP score. This represents a convenient travel distance by normal means such as driving, or perhaps bicycling. Recreation Needs and Opportunities Assessment 43
50 This perspective also utilizes a one third mile catchment area representing the distance that a resident can reasonably walk in 10 minutes. Asset scores are in effect doubled within this distance to reflect the added value of walkable proximity. This doubling of the GRASP value within a walkable distance of the component serves to place a premium those areas in closer, more walkable proximity to recreation. General Level of Service perspective maps are displayed as Map 4 and Map 5 and may also be found in Appendix C in a larger size. The heat map (Map 4) suggests that the study area has good distribution of facilities and good general access to parks and recreation facilities. Areas of higher concentration are notable, particularly in the northwest, largely due to the high scores of Cook Park and the Cook Park Recreation Center and in the southwest as a result of several City and County of Denver Parks clustered along the study area boundary. The threshold map (Map 5) displays GRASP scoring based on a minimum standard, called a threshold. For this study, a threshold score of 48.0 has been used, which equates to the same level of service as Welch Park which provides a pleasant site with four other recreation components. Areas shown in purple have LOS that meets or exceeds this threshold score of This map shows rather definitively that the Four Square Mile Study Area has well distributed recreation facilities that meet or exceed this minimum standard. 44 Four Square Mile Neighborhood


51 Map 4: General Access to Recreation in the Four Square Mile Study Area is shown here as a heat map. Recreation Needs and Opportunities Assessment 45


52 Map 5: The entire Four Square Mile Study Area has good general access to recreation within one mile, shown here as a threshold map based on a minimum standard score of 48.0 which equates to the level of service provided by Welch Park. The entire study area meets or exceeds this threshold score for general access. 46 Four Square Mile Neighborhood
53 Walkable Level of Service The majority of the GRASP analysis for Four Square Mile focuses on Walkable Level of Service. Walkability is a measure of how user friendly an area is to people travelling on foot. A walkable environment has benefits in regard to public health, the local economy, and quality of life. Many factors influence walkability. These include presence or absence and quality of footpaths, sidewalks, or other pedestrian rights of way; traffic and road conditions; land use patterns; and safety considerations among others. Perhaps the most significant factors affecting walkability in a study area are barriers. For the Four Square Mile Study Area walkable level of service perspective analysis, barriers were determined and used to clip the service coverage. These are typically major streets, waterways, or railroad tracks that restrict pedestrian or bicycle movement and pose a potential risk to public safety. This accounts for these obstacles as deterrents to active transportation that serves to limit access to recreation without using a car. Walkable Access to Recreation This perspective models access to recreation by walking or other active transportation mode such as bicycle or skateboard. A one third mile catchment distance is used exclusively. This represents a distance from which convenient access to the component can be achieved by an average person within a ten minute walk. Unlike the general access perspective, this analysis does not recognize any service across a barrier. One third mile catchment buffers for all assets are shaded relative to the component s GRASP score, and truncated at each barrier. Scores are adjusted to allow direct comparison to the first perspective showing general access to recreation. Walkable level of service for the Four Square Mile Study Area is displayed as Map 6 and Map 7 and may be found in Appendix C in a larger size. The walkability heat map (Map 6) is intended to show access to recreation in Four Square Mile if walking or other non motorized travel mode is used to reach assets. Similar to the general access heat map (Map 4) areas of higher concentration emerge around Cook Park and near the Denver Parks clustered along the southeast study area boundary. Higher service is also indicated around Bible Park in the southwest corner of the study area and between Cheyenne/Arapaho Park and Country Lane Park in Aurora. An additional cluster of high service is apparent adjacent to Eloise May Library. The effect of the barriers is particularly notable around this last area. In Map 7, areas displayed in gray have no service within a walkable distance. Areas shown in yellow are areas of opportunity where service is still developing or is approaching the minimum standard. Purple areas indicate walkable level of service that meets or exceeds the minimum standard. This map also introduces barrier zones, parts of the study area bounded by major roadways or canals. Within each zone, any point can be reached from any other point without crossing any barriers. Barrier zones are useful in an analysis of walkable access, as they reflect real world limitations to recreation opportunities. The data shown in this map provides the basis for additional analyses that follow. Recreation Needs and Opportunities Assessment 47


54 Map 6: Walkable Access to Recreation in the Four Square Mile Study Area is shown here as a heat map. 48 Four Square Mile Neighborhood

55 Map 7: Threshold map displays Walkable Access to All Components in the Four Square Mile Study Area based on a minimum standard. The minimum standard score of 48.0 equates to the LOS provided by Welch Park. Recreation Needs and Opportunities Assessment 49

56 Table 6: Walkability Statistics A B C E F G % Study Area with Service Average LOS per Acre Served Avg. LOS Per Acre/ Population per acre No Service Some Level of Service Below Threshold Good Level of Service Meets/Exceeds Threshold Four Square Mile Study Area 87% % 36% 51% Column A: Shows the percentage of study area that provides at least some recreational service. Column B: Shows the average numerical value of LOS for the total area. Column C: Shows the results of dividing the number from the previous column (Average LOS per Acre Served) by the population density of the area. Columns E, F, G: Show statistics from the walkability analysis applying a minimum standard, or threshold. Total GRASP scoring values were bracketed to show where LOS is above or below a threshold value of These columns show the percentages of the study area that have no service, fall below this threshold value, or exceed this threshold. This data may also be represented in a pie chart, as shown in Chart 1. Chart 1: Walkability of Four Square Mile Study Area by Acreage 50 Four Square Mile Neighborhood

57 This information is helpful in a general way. However, a closer examination of the nine barrier zones is even more revealing. The average level of service per acre is displayed for each zone in Chart 2. This shows clearly that, as an average, Zone 1 and Zone 7 fall well below the threshold score of 48.0, while Zone 6 has no service at all. Additionally, Zone 2 also falls short of this minimum standard, though at 44.1, this zone is approaching service threshold. Another glance at Map 7 shows that some areas within Zone 2 score above threshold and help bring up the average score. Chart 2: Service by Barrier Zone Chart 3 supports the assertion that Zones 1, 2, 6, and 7 may be areas of concern. This chart displays Level of Service by zone and highlights those zones that fall below the study area average for reference. Based on this data, it appears that Zone 4 falls short in some places as well. Despite this data, it appears that the average Level of Service for Zone 4 by acre is above the minimum standard score of Based simply on acreage, upon adjusting these scores based on population, this zone clearly has some trouble spots. This will be examined further in the following section. Recreation Needs and Opportunities Assessment 51


58 Chart 3: Service by Barrier Zone Based on Population Gap Analysis It can be revealing to isolate areas of low service or no service to perform further analysis or target future improvements. This is often called a gap analysis, as it excludes any part of the study area that meets or exceeds the minimum standard, thus highlighting those areas with service gaps. These may be called gap areas. Several perspectives were created with a specific focus on these low service and noservice areas. Map 8 shows low service and no service areas isolated and shaded based on GRASP score. Brighter areas indicate higher scores approaching the threshold score of 48.0, while duller shading indicates that service is still developing. Grey areas are those with no service. This perspective further highlights Zone 1, Zone 6, and Zone 7 as lacking in service, as these contain significant acreage with no service at all. Additionally, Zone 4 emerges as particularly neglected area with block after block with no public recreation service. 52 Four Square Mile Neighborhood


59 Map 8: Isolates areas with no service or low service, below threshold as indicated. The brighter yellow areas are close to reaching the threshold value of Dull yellow areas are still developing, while grey areas have no service at all. Recreation Needs and Opportunities Assessment 53
60 Demographic Analysis An examination of the demographic profile of areas with service gaps can be useful in prioritizing future planning efforts. Areas with higher population and lower income are typically better targets for future development or service enhancements. For instance, as Zone 7 has 64 residents/acre with a median income below $30,000, it has greater need for improvement than Zone 3, which has only five people/acre with a median income exceeding $100,000. Targeted development of recreation facilities in such higher density, lower income areas yields a greater bang for the buck, as more people with fewer resources are impacted. Table 7 below shows demographics for population and income for each barrier zone and for the entire Four Square Mile Study Area. Table 7: Four Square Mile Study Area Population Study Area Total Acres 2014 Population Median Population Per Acre Income Study Area 3,591 45, $42,068 Zone , $42,664 Zone , $47,522 Zone ,564 5 $100,104 Zone , $37,538 Zone 5 1,003 12, $37,660 Zone $0 Zone , $27,291 Zone ,852 8 $52,438 Zone , $33,399 Demographic indicators for the entirety of each barrier zone suggest the priority for service improvement. Zone 7 has a high population density and low median income, which may be a better priority than Zone 3, which has low density and higher income. Zone 6 may be a deemed a low priority, since it currently has no residential population to serve. Demographics can also be determined for gap areas within each zone. Map 9 shows the same isolated low service and no service areas shown in Map 8, this time based on population density with an indicator for median income. Interestingly, gap areas in many of the zones already discussed as particularly lacking in service (Zone 1, Zone 4, and Zone 7) tend to have the highest population densities as well as the lowest household incomes. Zone 5 and Zone 9, despite having some of the highest average scores, do contain low service and no service areas that overlap with fairly high population densities. These areas are worth consideration as priority areas for future planning to enhance access to recreation opportunities. It should be noted that despite having average scores that indicate some need, Zone 2 and Zone 6 may be lower priorities based on their demographic profile. Zone 2, indicated in Chart 2 as a lower service area, tends to have a lower population and higher median annual household income. Also, a substantial area of low service in Zone 2 along Cherry Creek contains no residents at all. Similarly, Zone 6 has no residents within its boundary. For these reasons, Zone 2 and Zone 6 may be less of a priority for future service improvements. 54 Four Square Mile Neighborhood

61 Map 9: This map shows population density of all low score and no score areas within each zone. Median household income is also indicated in $10,000 increments. Gap areas with no population in Zone 2 and Zone 6 have been removed from the map. Recreation Needs and Opportunities Assessment 55
62 Alternative Providers The Four Square Mile Study Area has many residential areas, both single family and multi family, that provide some recreation opportunities through homeowners association facilities. Particularly due to the abundance of multi family housing, these facilities are very common and well distributed. Any assessment of recreational service in the Four Square Mile Study Area would be incomplete without some examination of these assets. Although they were not included in the GRASP inventory and analysis, alternative provider facilities were thoroughly located by aerial photography as well as a windshield survey of the study area. A total of 186 alternative provider components were located in this manner. These were comprised of the following types of facilities: Pool/Aquatic Facilities 88 47% Tennis 32 17% Open Turf 18 10% Basketball 10 5% Playground 9 5% Volleyball 4 2% Dog Park 2 1% Other* 23 12% 186 *Assets listed as other include those that could not be clearly identified on an aerial photograph, areas that had formerly been a different type of component (usually a tennis court) which were in the process of being retrofitted, or access to some sort of water body. In terms of variety, alternative provider facilities tend to be limited. Nearly 75 percent of all alternative provider components located were either a pool/aquatic facility, tennis court, or open turf area. These facilities are also typically of lower quality than those provided by public entities. Service provided by alternative providers in the Four Square Mile Study Area must be considered in this light. Pools and outdoor aquatic facilities, such as a hot tub, were found to be most common by far, as these comprise nearly half of all alternative provider components located. This is significant, as it points to the limited service provided by Homeowner Association facilities. The seasonal nature and availability of outdoor aquatics decreases the value of these assets, as does the fact that pool facilities are more likely to restrict access to only those residents within a specific housing development. Tennis courts were more likely to be run down or in disrepair occasionally, a newer component has been installed to replace a removed tennis pad such as a dog park or open turf area. Basketball courts were most often of higher quality than other alternative provider components, though these only account for five percent of all facilities. Many Homeowner Association developments offer indoor recreation facilities such as fitness centers, indoor pools, or game rooms. These have not been accounted for, as they are beyond the scope of the project. 56 Four Square Mile Neighborhood
63 Map 10 shows the location of alternative providers, which are displayed as orange points within the study area. Due to the limited variety, lower quality, and restricted access of many of these facilities, a one third mile catchment was not deemed applicable. Instead, a 400 foot catchment buffer is displayed for each of these alternative provider components. This distance corresponds to a good level of service distance to reach a destination on foot as based on established planning guidelines, including the American Planning Association (see Planning.org and WalkerParking.com hyperlinks available in electronic copy of this report). This catchment distance accounts for preschool aged children as well as older users with limited mobility, and provides a physical limit to access consistent with resident only Homeowner Association facilities. This 400 buffer is provided only for reference. No barriers have been used in the creation of these catchment buffers. They are not intended to suggest an adequate level of service from an alternative provider in that location, but rather to provide an understanding of areas with some opportunity for recreation from a private source. As noted above, alternative provider facilities often fall short of public standards, so any consideration of these components to fill gaps in public service needs to take this into account. Nonetheless, an examination of the high need zones already discussed indicates that many of these, including Zone 1, Zone 4, and Zone 7, do indeed have many alternative facilities provided. On the other hand, some the focus areas within Zone 5 and Zone 9 have no alternative providers at all. This finding lends further support for these areas as good targets for future service improvements. Recreation Needs and Opportunities Assessment 57

64 Map 10: Alternative providers are shown here overlaid on the walkability threshold map. It is apparent that some service is provided by other providers in low service and no service areas. 58 Four Square Mile Neighborhood
65 D. Findings Several general findings were revealed by the Four Square Mile GRASP Analysis that seem to be of particular importance. These may be summarized as follows: The entire Four Square Mile Study Area has adequate level of service for those residents with a motor vehicle. Though walkable access to all recreation is quite good, with 87% of the study area having some level of service, only 51% of the study area meets or exceeds the minimum standard threshold score. The Cherry Creek Greenway Trail and High Line Canal Trail significantly impact the level of service in parts of the study area where these two components account for more than half of scoring in places that are above threshold, or comprise the entirety of scoring in some areas. Several areas have no walkable access to recreation at all including a substantial area of high population density in the northeast of the study area south of Mississippi Avenue Specific focus areas within Zone 1, Zone 4, Zone 5, Zone 7, and Zone 9 are particularly good priorities for future service improvements as these are low service or no service areas with higher population densities, lower annual household incomes, some of which lack access to any alternative provider facilities. Specific gap areas area indicated on the Findings Map, as focus areas A, B, C, D, E, and F. Recreation Needs and Opportunities Assessment 59


66 Findings Map: This map illustrates focus areas, those of particularly high need based on GRASP Level of Service Analysis, population density, median household income, and alternative provider facilities. These focus areas represent the least served locations within the Four Square Mile Study Area which should be targeted to improve recreation opportunities in the future. 60 Four Square Mile Neighborhood

67 V. Potential Funding Opportunities Arapahoe County Recreation District funds have been and will be available for use for outdoor recreational opportunities and amenities in the Four Square Mile Neighborhood as the budget allows. Additionally, Arapahoe County Open Space funds have and will be available for property where use is limited to passive outdoor recreation again, where budgets and fund balances allow. Once this plan is completed and recommendations are considered for implementation, additional funding for active recreational uses can come from a variety of sources including the Arapahoe County Open Space grant program, Great Outdoors Colorado (GOCO) grant funds and other potential funding sources depending on the availability of required match funds. A. Arapahoe County Open Space Fund and Grant Opportunity The Arapahoe County Open Spaces Program began in 2003 when citizens of Arapahoe County voted to fund the program through a quarter of a penny Open Space sales and use tax (25 cents on every $100 spent). The tax was renewed in 2011 when voters approved extending the program to Tax revenues generate approximately $21 million annually and are distributed according to the figure below: Open Space acquisition and development funds have been, and will be, utilized in the Four Square Mile Neighborhood where the property is limited to passive outdoor recreation uses only. The Arapahoe County Recreation District is also eligible to apply for the Arapahoe County Open Space competitive grant funds for active outdoor recreation projects if sufficient match funds are available. B. Arapahoe County Recreation District Fund The Arapahoe County Recreation District operates on a 0.8 mill property tax, which generates approximately $1 million district wide. A map of the district is shown in Figure 15. Annual expenditures for operations, maintenance, and development district wide are budgeted to match incoming revenues. Any additional Recreation District funding used in future endeavors can be used for active recreation. Recreation Needs and Opportunities Assessment 61

68 Figure 15: System Area Map 62 Four Square Mile Neighborhood
69 C. Great Outdoors Colorado Grant Funds (GOCO) Great Outdoors Colorado grants are available to communities statewide through a competitive application process. Based on the four funding areas mandated by the Colorado Constitution, and with input from grantees and Coloradans, several grant programs have been developed including: Local Government Park and Outdoor Recreation Grants, Open Space Grants, Planning Grants, and Trails Grants. The Arapahoe County Recreation District could apply for grants from GOCO if sufficient match funds were available. Recreation Needs and Opportunities Assessment 63
70 THIS PAGE INTENTIONALLY LEFT BLANK
71 VI. Recommendations A. Discussion The following sections provide a discussion of potential recommendations in detail. The first section on Level of Service Improvements illustrates a few different options to improve Level of Service in the Four Square Mile Study Area, informed by the GRASP Analysis and the citizen survey conducted by RRC Associates as part of this recreation assessment. This includes explanation of strategies that address high demand components, booster components, school partnerships, and land dedication. The second section on Recreational Connectivity discusses the value of a recreational trails system and outlines essential concepts as a reference for future trails planning. Level of Service Improvements Findings of the GRASP LOS analysis, along with responses from the community survey, provide some guidance in consideration of how to improve recreation in the Four Square Mile Study Area. Gap areas, those that either fall below the minimum standard threshold or provide no service, provide good opportunities for improvement. Although land acquisition and large scale capital investment is sometimes needed, there are alternatives. This section discusses recommendations to enhance level of service through improvement of existing sites, development of new facilities, and potential partnerships. Note: Any reference to level of service scoring throughout this recommendation discussion relies on walkable level of service analysis. Despite the fact that walkable coverage provided is fairly good, an examination does reveal areas on which to focus improvement efforts. High Demand Components The citizen survey asked respondents to rank facilities by importance based on those they felt needed to be added, expanded, or improved. Responses are shown in Figure 16. These high demand components should be considered in any efforts to add new components in the Four Square Mile Study Area. Many of these needs may be addressed within the existing system by upgrading facilities, developing new facilities, or by establishing or strengthening partnerships. The highest demand facilities based on survey responses are neighborhood parks and open space areas. In a place as highly developed as Four Square Mile, the greatest challenge to any such new development is land acquisition. Undeveloped lands currently owned by Arapahoe County along the High Line Canal Trail are rather small to adequately meet these needs. The Long s Pine Grove property does have excellent potential as a small neighborhood park; however, this location falls within an area that already has adequate service. A new park in one of the identified gap areas would effectively improve level of service, and possibly elevate lowservice or no service areas above threshold depending on its location and amenities. Recreation Needs and Opportunities Assessment 65
72 Paved recreational paths and soft surface trails were indicated as a high priority, as was greater connectivity between existing trails and pathways. The Cherry Creek Greenway Trails and High Line Canal Trails are excellent resources that will serve well as the backbone to further develop the Four Square Mile trail system. Further discussion on best practices, with some specific recommendations, may be found in the following section on Recreational Connectivity. An off leash dog park was cited as a top priority in the survey, and this was echoed by many public meeting attendees. Residents currently have no access to a public dog park within the Four Square Mile Study Area, despite a vocal group of dog owners. It is recommended that a further investigation or a feasibility study be conducted and that a public off leash dog park be developed based on this guidance. It may prove a challenge to find a suitable location due to the recent in fill development and the fact that much of the study area is heavily residential. However, there are industrial areas nearby Cherry Creek that might be worth further consideration. The proximity to Cherry Creek Trail is ideal and non residential neighbors are likely to be more agreeable. A community garden is a low cost investment component which serves to bring people together. A garden could be developed even on a trial or temporary basis if a suitable location is found. None of the undeveloped lands in the inventory would be ideal for an extensive community garden area, but Long s Pine Grove parcel might provide a nice context for a small garden as part of a neighborhood park. 66 Four Square Mile Neighborhood

73 Figure 16: Recreation Priorities of Survey Respondents Survey respondents were asked to list first, second, and third priorities for recreation in the Four Square Mile area. The results may be used to inform future planning efforts. A new playground nearby one of the many multi family housing developments in Four Square Mile would also be desirable. Despite its small size, the undeveloped trailside property at Wayside Park may be a good candidate, as it lies adjacent to a trail and is located in a lower income, higher density residential area with a notable absence of both public and private play facilities. Other components in some demand include an outdoor event space, an outdoor swimming pool, picnic shelters, a skatepark, public art, and disc golf amenities. The feasibility of these should be considered in the development of additional recreational assets within Four Square Mile in the future. Recreation Needs and Opportunities Assessment 67
74 Booster Components Another way to enhance existing assets is through the addition of booster components intended to boost the level of service in gap areas by adding new components to existing recreation sites that have space to accommodate them. In the Four Square Mile Study Area, opportunity to boost service in this way is limited, as the developed locations at Cheyenne/Arapaho Park, Welch Park, and Wabash Trailhead all fall within areas that already have adequate service. However, at the three undeveloped sites included in the inventory, there is potential to add components and improve level of service in nearby low service or no service areas. The only County owned asset actually located within a low service or no service area is Quebec Way Trailhead. Though this site has yet to be developed, any new assets on site would effectively improve level of service in surrounding neighborhoods. Based on GRASP scoring, the addition of just two components at Quebec Way Trailhead would elevate level of service above the threshold for nearby residents. Wayside Park and Long s Pine Grove, the other undeveloped County owned properties, are both in such proximity as to impact service in nearby low service and no service areas. Any development at Wayside Park would improve level of service in a highly populated, low service area. The addition of two components at this site would boost service above threshold for the surrounding neighborhood as well. Despite the assumption of High Line Canal as a barrier for the GRASP analysis model, the crossing point along Florida Avenue would serve to provide walkable access to a developed park at Long s Pine Grove for neighbors on the other side. The addition of three components to this site would push the level of service above threshold for part of this low service area across the High Line Canal. The following map (Figure 17) is intended to serve as a tool to assist future planning efforts. Low service and no service areas are shown again here, this time color coded to indicate the number of components needed to bring an area above the threshold score of 48.0, the GRASP score equivalent of Welch Park. This perspective is overlaid with alternative provider components to inform the discussion. 68 Four Square Mile Neighborhood


75 Figure 17: Component Needs Despite some complexity in scoring and analysis, the GRASP process is a component based system. Findings may be simplified to suggest the number of components needed in a low service or no service area to reach the threshold. Recreation Needs and Opportunities Assessment 69

76 School Partnerships School partnerships can provide valuable additional options for public recreation. School facilities may supplement parks and other public recreational resources, but their limited availability often makes neighbors less likely to use them. One way to address this issue is to partner with schools to promote use of school facilities by the community. Environmental cues and on site community programming can make school facilities more inviting. Site features such as welcome signage or an entry gateway on school grounds can make neighbors feel more welcome. A clear message about school hours and hours for public access can be helpful to those planning a visit. Volunteer adult supervision can encourage use of school playgrounds or other facilities. Organized events or drop in sessions are also helpful in creating awareness of school grounds as community assets. As no public schools currently exist within the Four Square Mile neighborhood, any such coordination with school administration would need to be initiated by the City and County of Denver or the City of Aurora. Efforts to work with these neighboring jurisdictions to make school assets more available to nearby residents would improve the level of service in the Four Square Mile Study Area. Improved access to Challenge School in Aurora would have particular impact as it is located within a low service area adjacent to a notable no service area. An informative summary of public use of school grounds may be found here: eating/shared use school property 70 Four Square Mile Neighborhood
77 A local program, called Learning Landscapes, has had great success fostering ties between schools and the nearby community. Developed by faculty and students at the University of Colorado at Denver, this initiative is a proven, low cost way to build a strong connection between local residents and neighborhood schools. More information on Learning Landscapes may be found here: Land Dedication There is a current structure for land dedication and cash in lieu of land dedication in the unincorporated areas of Arapahoe County. One final strategy to expand recreational opportunities in the Four Square Mile Study Area is to explore public land dedication for any future development projects to require private developers to dedicate a portion of land for public use, or cash in lieu that would benefit the Four Square Mile Neighborhood directly. Although land development in Four Square Mile has accelerated in recent years, in particular multi family housing stock, there are still undeveloped lands that might be developed in the future. Recreational Connectivity Non motorized access to recreation has become a priority for communities nationwide in recent years. As a result, the importance of trails in a recreation system cannot be overstated. Trails have a positive impact on public health, local economy, quality of life, and the environment. In the United States today, one third of the population cannot drive due to a variety of factors such as age, financial limitations, or visual impairment. A well planned trail system creates a viable alternative to getting in the car. Trails are becoming ever more essential infrastructure that defines a community, particularly in the State of Colorado where people enjoy active lifestyles unlike anywhere else in the country. With the Cherry Creek Greenway and the High Line Canal Trails, the Four Square Mile community has exceptional opportunities for non motorized access to different parts of the Study Area. However, as trail connections beyond these major trail corridors are still rather limited, room exists for improvement. The following discussion includes a description of several aspects of successful trail systems. Where to Start A trail may be loosely defined as a route for pedestrians, bicyclists, equestrians, and other active users. Trails can be off street or on street, paved or unpaved, dedicated, or shared. Any trail improves the ability of people to safely reach a destination without use of a motorized vehicle. Active transportation refers to getting from place to place under non motorized power be it on foot, on a bicycle, on a skateboard, on a horse, on a unicycle, on a scooter, etc. Trails make any mode of active transportation possible, but are most commonly used for walking and cycling. Walkability is a measure of how user friendly an area is to people travelling on foot. Many factors influence walkability. These include presence or absence and quality of footpaths, sidewalks, or other pedestrian rights of way; traffic and road conditions; land use patterns; building accessibility; and public safety considerations among others. Bikeability, similar to walkability, refers to the extent to which a community accommodates bicycle travel. Infrastructure for bicycle use can differ substantially from pedestrian infrastructure. Often, a bicycle route or lane is integrated with a roadway. Compared to a sidewalk or other off street trail, this type of amenity is often easier and less expensive to build, as it is subject to fewer limitations with regard to right of way, upfront costs, and private land ownership. Recreation Needs and Opportunities Assessment 71
78 Both walkability and bikeability are important aspects of recreational connectivity the extent to which community recreational resources are physically linked to allow for easy and enjoyable travel between them. As people today are more inclined to integrate recreational opportunities into their daily lives, aspects of the built environment are more important than they were in the past. This includes infrastructural elements such as trails and crossings. The infrastructure available to get active people to and from destinations is of greater importance than ever before, as more and more people prefer a leisurely walk or bike ride to a trip in the car. Barriers are any limitations to free and easy pedestrian and bicycle movement within a community. These are typically major infrastructural features such as roadways, waterways, or railroad tracks that impede active transportation and often pose a potential risk to public safety. The need to cross such obstacles serves to limit access to recreation facilities. Barriers may also involve other types of physical obstacles, topography, or exposure to the elements as well as perceived obstacles like crime risks or a lack of familiarity with an area. People increasingly expect that such barriers will be addressed and that parks, recreation centers, and other community resources be easy to access for a variety of users employing a variety of travel modes. Recreational connectivity in most American communities usually starts with trails, but it includes other infrastructural elements such as street/railroad crossings, sidewalk landscaping, lighting, and drainage, as well as services such as public transit options or bike share and car share availability. A trail system refers to all trails and associated infrastructure that serve active transportation users in a community. This may include trails of varying scale intended to serve users within a park, throughout a community, or across a region. It may include various types of trails for pedestrians, bicyclists, equestrians, or other active users. 72 Four Square Mile Neighborhood

79 Figure 18: City of Lafayette, Colorado Trails System The trail system of the City of Lafayette, Colorado provides a good example of a maturing trail system. Though barriers still exist which keep the trail system from being fully connected, six distinct trail networks exist to serve the city. A 1/3 mile catchment area is shown here in a different color for each network, with parks and open space areas shown in green. As a trail system matures, the need emerges to address barriers such as roadways, waterways, and railroad crossings that separate distinct trail networks in order to create a truly connected trail system. A trail network is a part of a trail system within which major barrier crossings have been addressed and all trails are connected. Trail networks within a trail system are typically separated from each other by such barriers or by missing trail connections. Signaled crosswalks, pedestrian underpasses, and bridges can be used to help users navigate barriers. New trails may be added to link trail networks and improve overall connectivity. Most communities have several trail networks that connect users to common destinations such as schools, shops, restaurants, and civic and religious institutions in addition to parks and recreation facilities. The more integrated these networks, the more connected a community. The example in Figure 18 shows different color catchment areas of one third mile for several such trail networks in the City of Lafayette, Colorado. Recreation Needs and Opportunities Assessment 73
80 Building a trail system involves many considerations beyond the control of park and recreation managers. Vacant lands, utility easements, street right of ways, and existing social trails may be worth exploring for trail feasibility and to determine how trail development in these areas might impact overall connectivity. However, other departments and agencies will need to be consulted and partnered to address issues such as land acquisition, street crossings, and utility maintenance. To complicate matters, the distinction between a recreational trail and a transportation trail can be hazy. On street connections via usable, comfortable bicycle lanes and routes are also critical to establishing good recreational connectivity. Though invaluable to community infrastructure, additional trails connections can introduce various stakeholders and many complications. The types of collaboration necessary to build a trail system are not without their challenges, yet can yield lasting partnerships that benefit the community. Trails Hierarchy It is helpful to recognize that trails may be developed at a variety of scales. Many trails serve only park users, while others are of community wide or regional extent. Also, people with a destination in mind tend to take the most direct route, while recreationists often enjoy going the long way around. An exemplary trail system will provide multiple opportunities for users to utilize trail segments to access different parts of a community directly or enjoy recreational loops or circuit trails of various size. A hierarchy of trails allows users to choose from several options to reach a destination directly or spend time simply enjoying the journey. Three distinct tiers may be distinguished that relate to a trail system: 1. Park Trails 2. Community Trails 3. Regional Trails Park Trails A trail system typically starts with within parks. Such interior trail assets, once established, provide a good point of departure to plan new trails outside of park boundaries. Trails within parks are assets as valuable as other types of park facilities or amenities such as a playground, a ballfield, or a picnic table. Loop trails within a park are particularly for exercise or recreational use. Community Trails With internal park trails established, the next step is to focus on connecting these park assets to each other and to various places within the community. This involves capitalizing on existing opportunities to create strategic off street and on street pedestrian and bicycle links between popular recreation locations. Wide, under utilized street corridors are good options for creating pedestrian trails and bicycle routes within developed parts of a community. With these critical pedestrian and bicycle arteries established, focus may then shift to developing spurs along these routes to other parks, schools, civic, commercial, and religious centers. Strategies to retrofit developed areas to meet the need for safe active transportation routes may be found in the Urban Street Design Guide released the in 2013 by the National Association of City Transportation Officials (NACTO, This valuable resource provides a full explanation of complete streets based on successful strategies employed in various North American cities. 74 Four Square Mile Neighborhood

81 Regional Trails Regional trails typically provide connections to access nearby communities, and often link existing trail systems together. Development of regional trails usually involves extensive coordination with county offices, private land owners, and/or government entities such as the Colorado Department of Transportation. Trails Typology In the Four Square Mile Study Area, the process of building a trail system is well underway. Trail opportunities exist at all levels of this hierarchy, and existing park assets are fairly well distributed. The current infrastructure lends itself well to future trail development. In addition to the park, community, and regional trail hierarchy already discussed, it is also useful to employ a trails typology in planning efforts (see Figure 19: Types of Trails). A new trail may actually involve a variety of infrastructural improvements. The primary consideration is how to accommodate pedestrian and bicycle users travelling along the same route. A basic trail typology of three different types is recommended. Each trail type refers to a distinct strategy for connecting one place to another: 1. Urban Trail 2. Bicycle Lane/Route 3. Open Space Trail Recreation Needs and Opportunities Assessment 75


82 An urban trail, an off street trail wide enough to accommodate both pedestrians and cyclists, is an ideal solution. This requires a street right of way that allows for a fully detached multi use trail, preferably with landscaping or other physical separation from the roadway. This type of shared use trail is paved with separate lane designations for pedestrians and bicyclists. An alternative to this is a bicycle lane or route. Along existing roads where space in the right of way is limited, or a lower cost option is preferred, this alternative involves routing cyclists along a dedicated, on street bicycle only lane with a pedestrian sidewalk along the roadside. If the street cross section is so narrow as to prohibit full time dedicated bicycle lanes, an advisory bicycle lane may be an option. The City of Minneapolis provides a good description of advisory bicycles lanes: bike lane. In some instances, a particular street is simply designated as a safe, preferred bicycle route, typically with signage but with no actual lane striping. This is a good option for low speed, low volume, residential or rural road conditions. Finally, the traditional open space trail provides users with an off street connection for shared use intended for pedestrians, bicyclists, and occasionally equestrian users. These types of trails typically travel through open space areas or parks, along greenways, or through trail or conservation easements. This is often considered the ideal trail type, yet the land dedication needed for an open space trail often makes it impractical or impossible in an established community. For this reason, open space trails are usually located on the periphery of developed areas. Figure 19: Types of Trails Three trail types to consider in developing a trail system in an established community. Pedestrian and bicycle users are accommodated in different ways in each trail type. Selection for each is largely driven by the surrounding built environment. Colors apply as follows: Blue for urban trails, Green for bike lanes/routes (shown here with street sidewalks), and Red for open space trail connections through less developed areas. 76 Four Square Mile Neighborhood
83 Making Connections Development of a trails system is all about creating a network of connections. Here is a common sense way to think about the process. Connect Stakeholders Even the most well planned, extensive trail system has to start somewhere. Developing a trail system takes time and careful planning. The scope of creating and maintaining such a network is a substantial undertaking that involves many players. This often includes school districts, user groups, county offices, state entities, federal agencies, and/or private land owners among others. Other potential partners can include utility companies, law enforcement, public works departments, and public transit operators as well as parks and recreation colleagues. It is important to convince stakeholders that their cooperation is critical to the public good. It can be helpful to remind them of the economic boost that often results from investment in recreational infrastructure like a trail system. Of course, not all players stand to gain from trail development. It is essential that land managers and planners be aware of all possible implications inherent in their efforts. Here are a few general strategies to use in coordinating planning efforts in establishing a trail system: Work with a variety of departments, offices, agencies, and entities to build consensus and create advocates in planning trail future connections. Create connections that allow safe, comfortable routes between parks, schools, homes, and commercial areas. Look at existing infrastructure for areas such as utility easements, drainages, and detention ponds that may support trails and improve connectivity. Consider ways in which various stakeholder may share cost burdens. For greatest economic impact, develop a trail system that clearly links recreation with commercial opportunities. Remember that the demand for trails is greater than ever remind stakeholders that investment of time and resources will yield quality of life dividends and boost the local economy. Connect Places Trail development should start with a list of destinations. These may be parks, schools, civic institutions, commercial areas, neighborhood nodes, or other important locations. As such, destinations also serve as points of origin; a comprehensive list will provide a blueprint for trail planning efforts. Trails may be prioritized based on the importance of the locations they access within the community. Connect Trails A trails system is nothing more than an assembly of trail connections that works together in a cohesive manner. It is useful to keep this in mind. The process of building a trail system takes time. Patience is essential. As the low hanging fruit is picked, those trails with more complicated politics or more substantial price tags become focal points. However, there may be more than one way to link two trails, and sometimes alternative solutions are perfectly viable. Flexibility and creativity can come in handy. Recreation Needs and Opportunities Assessment 77

84 Connect People As the Four Square Mile trail system continues to develop, additional resources will be desirable to support users. Signage and wayfinding strategies, trailheads and access points, public trail maps, and smartphone applications can be successfully utilized to connect people to trails and provide a positive user experience. Signage and Wayfinding Signage and wayfinding strategies are employed to enhance a trail system by promoting ease of use and improved access to recreational resources. An important aspect of effective signage and wayfinding markers is branding. An easily identifiable hierarchy of signage for different types of users assists residents and visitors alike as they navigate between recreation destinations. Further, a strong brand can imply investment and commitment to active transportation which can positively impact community identity and open up economic opportunities. Trailheads & Access Points An essential, yet often overlooked aspect of a trail system is the need to provide users with access to trails. There are two ways to approach this with a trailhead or with an access point. First, a formal trailhead may include various amenities such as a parking area, bicycle racks, signage, restrooms, drinking water, a trail map, and an information kiosk. A trailhead provides access to trails that typically serve a higher volume of users with parking and a staging area for their visit. 78 Four Square Mile Neighborhood
85 The second approach involves simply providing a trail access point, usually without the extensive amenities found at a trailhead. Trail access points are more appropriate in residential or commercial areas where users are more likely to walk or ride a bicycle to reach the trail. They may also be commonly found along spur trails or secondary trails that serve to access a more heavily used primary trail. In the Four Square Mile Study Area, the trail system is well developed, and includes both the Cherry Creek Greenway Trail and a meandering High Line Canal Trail. Access to trails from residential and commercial areas is available in many places. Access points such as these are provided to eliminate the need for users to pass through private property to reach an off street trail. New trails should be planned to accommodate access points whenever possible. A simple spur trail from a street sidewalk to a primary trail will usually suffice. Map & App Resources By making trail maps available, users may enjoy trails in Four Square Mile with greater confidence and with a better understanding of distances, access points, amenities, and the system as a whole. Even with a developing trail system, a trail map can provide valuable information to users. In addition to showing streets with bicycle paths and safe on street bike routes, the maps may also include information about trail ownership, which is helpful, as it displays some trails within easements or even on private land with use agreements. Another way to provide trail mapping to users is through web based smartphone or tablet mobile technologies. Maps made available on this type of platform are more dynamic, always on hand, and can be easily updated as a trail system evolves. Though this type of resource requires upfront investment and may be cost prohibitive, it is likely that as technologies advance, these costs will become more manageable in the future, making web based maps a more viable long term planning solution. Public Transportation A final consideration regarding recreational connectivity is public transportation. Though this falls outside the realm of parks and recreation, many recreational users enjoy the convenience that public transit affords. Partnership with the Regional Transportation District (RTD) is recommended to ensure that future public transit planning in Four Square Mile considers access to park lands, trails, and common destinations such as schools and recreation centers to best serve the community. Additional Resources The National Park and Recreation Association (NRPA) recently compiled summaries of current research and best practices on active transportation and safe routes to parks. These and other valuable resources may be found on the NRPA website: papers/ Recreation Needs and Opportunities Assessment 79
86 B. General Recommendations Several general recommendations may be summarized as follows. It is assumed that all capital efforts will go through the appropriate public input process as they are undertaken. A system of asset monitoring should be implemented to maintain the existing level of service at Arapahoe County parks and open spaces in the Four Square Mile Study Area. Undeveloped County lands at Long s Pine Grove, Quebec Way Trailhead, and Wayside Park should be developed to boost the level of service for nearby residents. Public access to additional resources should be pursued or developed to increase service in focus areas A, B, C, D, E, and F as outlined on the Findings Map. Partnering with Denver and Aurora to make school assets (such as athletic fields, ball courts, and playgrounds) more available to nearby residents would improve the level of service in the Four Square Mile Study Area. Improved access to Challenge School in Aurora would have particular impact, as it is located within a low service area adjacent to a notable no service area. A public, off leash dog park should be considered if a suitable location can be determined within the Four Square Mile Study Area. A community garden should be considered if a suitable location can be determined within the Four Square Mile Study Area. A County wide Trails Master Plan should be developed to include the Four Square Mile Neighborhood. With valuable regional trails already established to serve the community, additional trail connections to neighborhood trails and parks should be planned for and developed. Additional crossing points should be developed to span the High Line Canal in order to provide better public access to resources on the other side, and to the High Line Canal Trail itself. Long term sustainability of the High Line Canal and its natural and recreational resources should be promoted through work with Denver Water and other jurisdictions. Appropriate land acquisition opportunities should be explored. Land development code changes and opportunities for land dedication for parks and trail corridors should be explored through the County. Implement a strategic, brand consistent communications campaign to promote enhanced awareness and use of both existing recreational amenities and future improvements. Tactics may include public trail and facility mapping, hierarchy of signage for identification and wayfinding, and use of the Arapahoe County web site, as well as optimized web based technologies for smartphone and tablet use. 80 Four Square Mile Neighborhood
87 C. Implementation Plan Project Site Goal Next Steps Timeframe Arapahoe County Explore opportunities for land dedication for parks and trail corridors. Participate in County land development code changes Ongoing Arapahoe County Work with neighboring jurisdictions to increase level of service in focus areas; including partnerships with schools. Utilize report recommendations to encourage increases Ongoing Four Square Mile Neighborhood Strive to reach and maintain an adequate level of service. Monitor Assets using Level of Service Analysis Ongoing High Line Canal Trail Ensure the long term sustainability of the trail and its natural and recreational resources. Participation with Denver Water and multiple jurisdictions Ongoing Four Square Mile Neighborhood Explore appropriate acquisition opportunities. Utilize report recommendations to inform decision making Ongoing Communications Campaign for Awareness and Engagement Increase community awareness and use of existing recreational amenities and future improvements. Develop signage plan and explore technology based enhancements beginning with new mapping features on the AC web site. Ongoing Quebec Way Trailhead Development as trailhead with High Line Canal Trail Connectivity and potential passive park amenities. Site plan and development Active Florida Crossing of High Line Canal Trail Identify feasibility, opportunities, and constraints of crossing alternatives. Perform inventory of infrastructure and study use and operations to create recommendations Active Wayside Park Development as small pocket park. Site plan and development of potential park amenities Short Undetermined Pursue development of a dog park. Initial scoping to determine feasibility and suitable location Short Undetermined Pursue development of a community garden. Initial scoping to determine feasibility and suitable location Short Parker/Mississippi Crossing of High Line Canal Trail Determine feasibility of implementing crossing study recommendation of an underpass for the High Line Canal Trail. Research funding and development opportunities and constraints Medium Countywide Trails Master Plan Draft a countywide trails master plan, which includes the Four Square Mile Neighborhood. Regional and community trail connectivity analysis and recommendations Medium Long's Pine Grove Development as trailhead with High Line Canal Trail connectivity and potential passive park amenities. Site plan and development Medium Cheyenne/Arapaho Park Development of west side of park. Site plan and development, including utilization of study to inform potential amenities Medium Iliff Corridor Corridor received Transportation Improvement Program funding for transportation operations, including bike/pedestrian facilities. Design and build bike/pedestrian facilities as part of transportation project Long Recreation Needs and Opportunities Assessment 81
88 THIS PAGE INTENTIONALLY LEFT BLANK
89 Appendix A Community Input The following information was gathered from focus group and public meeting participants, as well as the on line MindMixer site, regarding the current Park, Recreation, Open Space, and Trail Facilities in the Four Square Mile Neighborhood. Strengths The rural feel and natural setting. Mature landscaping. Many large and mature trees. Cheyenne/Arapaho Park well maintained. Great bike trails (safety and accessibility). Connectivity from High Line Canal Trail to the bike trail is good and is wide enough for both bikers and walkers. Weaknesses Parker Road accessibility and sometimes parking. Lack of trail underpass at Parker and Florida. Lack of dog cleanup posts empty often. Lack of a dog park. Limited accessibility to trails and parks like Welch Park. Significant risk of development along High Line Canal Trail that could impact the use of that trail. Risk also in jurisdiction since it passes through so many counties and divisions it s an amenity that everyone shares. Modifications to the canal needs to be considerate of those that live around it. Development along the High Line Canal and the lack of amenities between Florida and Mississippi east of Parker Road parcel are rapidly developed, and there will be no open space left to serve that part of the community. Two very different concepts they are in the process of buying parcels on one side over another. Welch Park almost has direct access to High Line, but there is no bridge across the canal. Some people have built stairs into the ground as a crossing. Need to have more parks on the east side of Parker. Long term sustainability of the water in the canal. There needs to be a distinction of what and better understanding within the community of what is considered public land and what is considered private land. Like Prospect Village (Private?) vs. Welch Park (public) vs. golf course (Public/Private?). The public, from their opinion, think that anything open space is theirs to use. They are allowed in High Line canal to use. It s a secondary use. Public vs. private with property rights being where they are and there needs to be a distinction. Recreation Needs and Opportunities Assessment 83
90 What are the key issues and values in the Four Square Mile community that need to be considered while developing this Needs and Opportunities Assessment? Maintenance and continuation of natural look and feel in the community Natural look, easy to care for, Xeriscape to cut down on fire hazard, low crime, safe traffic, and pedestrian access Need to keep the rural feel of the area Natural use to be available to anyone Preservation of views and mature landscaping Improved trail system, maintaining what is currently available and improving surfaces and maintenance Respect for the existing wildlife (deer, owls, and coyotes have made their homes here) Safety Safer routes for pedestrians in heavy traffic locations Lighting in regard to safety ADA accessibility Need for overhead shading Property Acquisition Acquisition of property while it is still available of the next year or two Mississippi corridor is lacking and should be more active for acquisition Would like to see specific use areas as a short term need versus additional multi use areas for long term development Connectivity of trails and safety issue/short term Connectivity for where it is hard for pedestrians needs to happen sooner than later. There are no gathering settings where large groups can congregate More Connections to High Line Canal and Cherry Creek Trails Are there any portions of the community that are underserved, if so, which ones? Need to have more parks on the east side of Parker What additional Park, Open Space, and Trail Facilities do you feel should be offered/created that are not currently available? Where should these be located? Restrooms Dog Park Ice Skating Rink Community Garden Trail Connections Community Art Instillations/Art in Public Spaces Exercise Station (circuit) Specially Focused Parks (example: mediation park) Place for Young Kids (non descript) Things to do (indoor basketball park) recreation center, like Utah Park facility) Senior center 84 Four Square Mile Neighborhood
91 Who are the key partners and stakeholders in the community with regard to assisting with the implementation of this plan? Camden Park Homeowner Association. Mountain View Gardens Homeowner Association. Alton Park Homeowner Association. Apartment Complexes Owners divided by geographic area and define who lives in each. Speak to a Homeowner Association in each sector (sector is not defined). Parker Road is a dividing line. There are more rental properties and higher density to one side while the other side is medium density. There are different needs and opinions on either side. Local governmental agencies; Water District, Fire District, Library District, Sheriff Department. The Four Square Mile Area has a variety of separated community pockets There is no single identity of Four Square Mile Community South Parker vs. North Parker. East and West of Parker. Biking Group. Tri County Health with elected officials. Denver Water Board they own the resource and the ground. How do you believe the Park, Open Space, and Trail facilities should be financially supported, should they be self supported through user fees, completely through taxes, alternative funding, or a combination of each? What happens when a big development is done? Can there be in lieu money? There has been little history to gauge public interest. It would be dependent on the specifics of the project/bond issue. Could be a sales tax. All options should be looked at. Apply for grants with the County if a good project is put in for Arapahoe County Open Space they can combine with GOCO. Combination of tax and pay for service. Cherry Creek has been successful in the past. Sponsorship and dog licensing fees. LID (Local Improvement Tax) Open Space could supplement it. Are there any political sensitivities we should be aware of that could impact the success of the county s planning effort? The Arapahoe County Recreation District has never been a viable institution, as they are a Title 30 and only a financial mechanism. Clarification is needed that the Recreation District doesn t have lots of money. If it is found that there are insufficient funds or the community does not support any tax initiative to build or maintain Park, Open Space, and Trail facilities to the standards desired by the community, what alternative funding ideas would you have to help support those facilities? Aurora could annex them and take it, but the community would have to approve. Public improvement fee like Havana Gardens. Kickstarter. Recreation Needs and Opportunities Assessment 85
92 THIS PAGE INTENTIONALLY LEFT BLANK
93 Appendix B Park and Recreation Influencing Trends The following information highlights relevant regional and national outdoor recreation trends from various sources that may influence the Four Square Mile Neighborhood s recreation planning for the next several years. The highest ranking age cohort in Four Square Mile is (22.4% of the population) followed by (15.5%) and (11.4 %). Additionally, the cohort is expected to grow from 14.7% in 2010 to 17.7% in Planning for the next ten years suggests a growing demand for programs and services for young adults, Baby Boomers and seniors. Demographic Trends in Recreation The Millennial Generation The highest ranking age cohort in the Four Square Mile Neighborhood is the age range. This group represents potential adult program participants. Many in this age group are beginning long term relationships and establishing families. This age range is included within the Millennial Generation (born around 1978 to 2000). In their book, Millennials Rising, the Next Great Generation, authors William Strauss and Neil Howe identify seven Millennials characteristics. 2 These characteristics were discussed in a 2010 California State Parks Bulletin article entitled, Here come the Millennials : What You Need to Know to Connect with this New Generation : 1. Special: Used to receiving rewards just for participating, Millennials are raised to feel special. 2. Sheltered: Millennials lead structured lives filled with rules and regulations. Less accustomed to unstructured play than previous generations and apprehensive of the outdoors, they spend most of their time indoors, leaving home primarily to socialize with friends and families. 3. Team Oriented: This group has a powerful instinct for community and places a High value on teamwork and belonging. 4. Confident (and technologically savvy): Upbeat and with a can do attitude, this generation is more optimistic and tech savvy than their elders. 5. Pressured: Millennials feel pressured to achieve and pressured to behave. They have been pushed to study hard and avoid personal risk. 6. Achieving: This generation is expected to do great things, and they may be the next great generation. 7. Conventional (and diverse): Millennials are respectful of authority and civic minded. Respectful of cultural differences because they are ethnically diverse, they also value good conduct and tend to have a standardized appearance. The California State Parks article provides ideas for engaging Millennials in parks and recreation. 3 2 Howe, Neil, and William Strauss, (2000). Millennials Rising, the Next Great Generation. Vintage: New York, New York. 3 California State Parks, Recreation Opportunities. (2010) Here come the Millennials : What You Need to Know to Connect with this New Generation, accessed January 12, 2015, pages 4 6. Recreation Needs and Opportunities Assessment 87
94 The Baby Boomers Baby Boomers are defined as individuals born between 1946 and 1964, as stated in Leisure Programming for Baby Boomers. 4 They are a generation that consists of nearly 76 million Americans. In 2011, this influential population began its transition out of the workforce. As Baby Boomers enter retirement, they will be looking for opportunities in fitness, sports, outdoors, arts and cultural events, and other activities that suit their lifestyles. With their varied life experiences, values, and expectations, Baby Boomers are predicted to redefine the meaning of recreation and leisure programming for mature adults. In the July 2012 issue of NPRA s Parks and Recreation magazine, an article entitled Five Trends Shaping Tomorrow Today by Emilyn Sheffield, Professor of Recreation and Parks Management at the California State University, at Chico, indicated that Baby Boomers are driving the aging of America with Boomers and seniors over 65 composing about 39 percent of the nation s population. 5 In the leisure profession, this generation s devotion to exercise and fitness is an example of its influence on society. When Boomers entered elementary school, President John F. Kennedy initiated the President s Council on Physical Fitness; physical education and recreation became a key component of public education. As Boomers matured and moved into the workplace, they took their desire for exercise and fitness with them. Now as the oldest Boomers are nearing 65, park and recreation professionals are faced with new approaches to provide both passive and active programming for older adults. Boomers are second only to Gen Y/Millennials (born between 1980 and 1999) in participation in fitness and outdoor sports. 6 Jeffrey Ziegler, a past president of the Arizona Parks and Recreation Association identified Boomer Basics in his article, Recreating retirement: how will Baby Boomers reshape leisure in their 60s? 7 Highlights are summarized below. Boomer Basics: Boomers are known to work hard, play hard, and spend hard. They have always been fixated with all things youthful. Boomers typically respond that they feel 10 years younger than their chronological age. Their nostalgic mindset keeps Boomers returning to the sights and sounds of their 1960s youth culture. Swimming pools have become less of a social setting and much more of an extension of Boomers health and wellness program. Because Boomers in general have a high education level, they will likely continue to pursue education as adults and into retirement. The Four Square Mile Neighborhood demographic profile indicates that 19.8% of the current population falls within the Baby Boomer age range (those approximately years of age). Boomers will look to park and recreation professionals to give them opportunities to enjoy many lifelong hobbies and sports. When programming for this age group, a customized experience to cater to the need for self fulfillment, healthy pleasure, nostalgic youthfulness, and individual escapes will be important. Recreation trends will shift from games and activities that Boomers associate with senior citizens, as Ziegler suggests that activities such as bingo, bridge, and shuffleboard will likely be avoided because Boomers relate these activities to being old. 4 Linda Cochran, Anne Roshschadl, and Jodi Rudick, Leisure Programming For Baby Boomers, Human Kinetics, Emilyn Sheffield, Five Trends Shaping Tomorrow Today, Parks and Recreation, July 2012 p Participation Report, Physical Activity Council, Jeffry Ziegler, Recreating Retirement: How Will Baby Boomers Reshape Leisure in Their 60s? Parks and Recreation, October Four Square Mile Neighborhood
95 Boomers will reinvent what being a 65 year old means. Parks and recreation agencies that don t plan for Boomers carrying on in retirement with the same hectic pace they ve lived during their years in employment will be left behind. Things to consider when planning for the demographic shift: Boomer characteristics What drives Boomers? Marketing to Boomers Arts and entertainment Passive and active fitness trends Outdoor recreation/adventure programs Travel programs Youth Planning for the Demographic Shift As one of the five trends shaping tomorrow today, Emilyn Sheffield also identified that the proportion of youth is smaller than in the past, but still essential to our future. As of the 2010 Census, the age group under age 18 forms about a quarter of the U.S. population, and this percentage is at an all time low. Nearly half of this population group is ethnically diverse, and 25 percent is Hispanic. Multiculturalism Our country is becoming increasingly racially and ethnically diverse. In May 2012, the U.S. Census Bureau announced that non white babies now account for the majority of births in the United States. This is an important tipping point, said William H. Frey, 8 the senior demographer at the Brookings Institution, describing the shift as a transformation from a mostly white Baby Boomer culture to the more globalized, multi ethnic country that we are becoming. Cultural and ethnic diversity adds a unique flavor to communities expressed through distinct neighborhoods, multicultural learning environments, restaurants, places of worship, museums, and nightlife. 9 According to Emilyn Sheffield, in the United States, the Hispanic population increased by 43 percent over the last decade, compared to five percent for the non Hispanic portion, and accounted for more than half of all population growth. The growing racial and ethnic diversity is particularly important to recreation and leisure service providers, as family and individual recreation patterns and preferences are strongly shaped by cultural influences. 10 As the recreation field continues to function within a more diverse society, race and ethnicity will become increasingly important in every aspect of the profession. More than ever, recreation professionals will be expected to work with, and have significant knowledge and understanding of, individuals from many cultural, racial, and ethnic backgrounds. The Four Square Mile demographic profile indicates that 19.7 percent of the population is Hispanic (any race), 21.3 percent is African American, and 7.1 percent is Asian. 8 Adam Serwer, The End of White America, Mother Jones, drum/2012/05/end whiteamerica, May 17, Baldwin Ellis, The Effects of Culture & Diversity on America, culturediversity america.html, accessed on Sept. 20, Emilyn Sheffield, Five Trends Shaping Tomorrow Today, Parks and Recreation, July 2012 p Recreation Needs and Opportunities Assessment 89
96 Outdoor Participation varies by Ethnicity: Participation in outdoor activities is higher among Caucasians than any other ethnicity and lowest among African Americans in nearly all age groups. Minority Youth, More Focused on School: Minority youth participants cite school work as the top reason they don t get out more often a barrier they cite more prominently than Caucasian youth. Hispanics, Looking for Nearby Outdoor Recreation: Hispanic participants and nonparticipants alike cite a lack of access to nearby places to participate in outdoor activities as a barrier to participation more often than other ethnicities. Recreational Preferences Among Ethnic/Racial Groups (Self Identifying): Nationwide, participation in outdoor sports in 2012 was highest among Caucasians in all age groups and lowest among African Americans, according to the 2013 Outdoor Recreation Participation Report. 11 The biggest difference in participation rates was between Caucasian and African American adolescents, with 64 percent of Caucasians ages participating and only 46 percent of African Americans in this age range participating. African Americans African American youth ages 6 17 (54% participation), are the only age group in this demographic to participate in outdoor recreation at a rate of more than 50 percent. By comparison, Caucasians in four of the five age groupings participated in outdoor sports at rates of 60 percent or more, with only those aged 45+ (40% participation) participating at under 50 percent. According to the 2013 Outdoor Recreation Participation Report, the most popular outdoor activities among African Americans are: running and jogging (19%); fishing (freshwater, saltwater, and fly) (11%); road and mountain biking and BMX (11%); birdwatching/wildlife viewing (5%); and camping (car, backyard, and RV) (4%). Asian Americans Research about outdoor recreation among Asian Americans in the San Francisco Bay Area (Chinese, Japanese, Korean, and Filipino) 12 found significant differences among the four groups concerning the degree of linguistic acculturation (preferred language spoken in various communication media). The research suggests that communications related to recreation and natural resource management should appear in ethnic media, but the results also suggest that Asian Americans should not be viewed as homogeneous with regard to recreation related issues. Another study 13 found that technology use for finding outdoor recreation opportunities is highest among Asian/Pacific Islander populations. Over 60 percent of these populations use stationary or mobile technology in making decisions regarding outdoor recreation. According to the 2013 Outdoor Recreation Participation Report, the most popular outdoor activities among Asians/Pacific Islanders are: running and jogging (24%); road and mountain biking and BMX (14%); hiking (13%); camping (car, backyard, and RV) (10%), fishing (freshwater, saltwater, and fly) (9%;); and skiing (cross country, alpine, freestyle, and telemark) (8%). 11 Outdoor Recreation Participation Report 2013, Outdoor Foundation, P.L. Winter, W.C. Jeong, G.C. Godbey, Outdoor recreation among Asian Americans: A case study of San Francisco Bay Area residents, Journal of Park and Recreation Administration, Harry Zinne and Alan Graefe, Emerging Adults and the Future of Wild nature, International Journal of Wildness. December Four Square Mile Neighborhood
97 Caucasians According to the 2013 Outdoor Recreation Participation Report, the most popular outdoor activities among Caucasians are: running and jogging (18%); fishing (freshwater, saltwater, and fly) (17%); road and mountain biking and BMX (16%); camping (car, backyard, and RV) (16%); and hiking (14%). Hispanics (Any Race) Participation in outdoor sports among those who identify as Hispanic is at seven percent nationwide, according to the 2013 Outdoor Recreation Participation Report. 14 Those who do get outdoors, however, participate more frequently than other outdoor participants, with an average of 43 outings per year. Hispanic youth (ages 6 17) are the most likely age group in the Hispanic demographic to participate in outdoor recreation, followed closely by those in the age range. The most popular outdoor activities among Hispanics are: running and jogging (22%); road and mountain biking and BMX (17%); fishing (freshwater, saltwater, and fly) (14%); camping (car, backyard, and RV) (11%); and hiking (9%). Multiculturalism and Marketing Today the marketplace for consumers has dramatically evolved in the United States from a largely Anglo demographic, to the reality that the United States has shifted to a large minority consumer base known as new majority. The San Jose Group, a consortium of marketing communications companies specializing in reaching Hispanic and non Hispanic markets of the United States, suggests that today s multicultural population of the United States, or the new majority, is million, which translates to about 35.1 percent of the country s total population. The United States multicultural population alone could essentially be the 12 th largest country in the world. 15 Parks and recreation trends in marketing leisure services continue to emerge and should be taken into consideration in all planning efforts, as different cultures respond differently to marketing techniques. Facilities According to Recreation Management magazine s 2013 State of the Industry Report, 16 national trends continue to show an increased user base of recreation facilities (private and public). To meet that growing need, a majority of the survey respondents (62.7%) reported that they have plans to build new facilities or make additions or renovations to their existing facilities over the next three years. The average age of respondents main facilities is 27.7 years. Public parks and recreation respondents planning construction were the most likely to be planning renovations (50.5%), building new facilities (28.3%), and making additions to current facilities (27.9%). The average amount planned by public parks and recreation respondents for construction for parks in the 2013 budgets saw an increase of 15.5 percent from an average of $3,440,000 in last year s survey to an average of $3,973,000 for The five most commonly planned facility additions include: dog parks, splash play areas, trails, park structures (shelters/restrooms), and playgrounds. 14 Outdoor Recreation Participation Report 2013, Outdoor Foundation, SJG Multicultural Facts & Trends, San Jose Group, posted October 25, Emily Tipping, 2012 State of the Industry Report, State of the Managed Recreation Industry, Recreation Management, June Recreation Needs and Opportunities Assessment 91
98 The current national trend is toward one stop indoor recreation facilities to serve all ages. Larger, multi purpose recreation centers that serve large portions of the community help increase cost recovery, promote retention, and encourage cross use. Agencies across the U.S. are increasing revenue production and cost recovery. Multi use facilities versus specialized space is a trend, offering programming opportunities as well as free play opportunities. One stop facilities attract young families, teens, and adults of all ages. Dog Parks Dog parks are a rising trend for parks and recreation. The year 2013 was the second year in which dog parks were the top planned addition to parks and recreational facilities. Recreation Management magazine 17 suggests that they can represent a relatively low cost way to provide a popular and often visited community amenity. Dog parks can be as simple as a gated area, or more elaborate with designed for dogs amenities like water fountains, agility equipment, and pet wash stations, to name a few. According to Dog Fancy magazine, an ideal dog park should include the following: One acre or more surrounded by a 4 to 6 foot fence Shade and water Adequate drainage Parking near the site A double gated entry Benches Pet waste disposal stations with pickup bags and covered waste receptacles Fitness Programming There have been many changes in fitness programs in the last ten years. What clients wanted in 2000 is not necessarily what they want today. The American College of Sports Medicine s (ACSM s) Health and Fitness Journal 18 has conducted an annual survey since 2007 to determine trends that would help create a standard for health and fitness programming. Table 8 shows survey results that focus on trends in the commercial, corporate, clinical, and community health and fitness industry. Strength training remains at a solid 2 nd for the second year in a row and body weight training appears for the first time in the top 20 trend survey. Zumba and outdoor activities appeared in the top 10 for the first time in 2012, and Zumba remains at 12 one of the biggest trends in fitness over the past three years. 17 Emily Tipping, 2013 State of the Industry Report, Trends in Parks and Recreation, Recreation Management, June Walter R. Thompson, Worldwide Survey of Fitness Trends for 2012, Health & Fitness Journal, American College of Sports Medicine, Four Square Mile Neighborhood
99 Table 8: Top 10 Worldwide Fitness Trends for 2007 and Children and obesity 1. Educated and experienced fitness professionals 2.Special fitness programs for older adults 2. Strength training 3.Educated and experienced fitness professionals 3. Body weight training 4. Functional fitness 4. Children and obesity 5. Core training 5 Exercise and weight loss 6 Strength training 6. Fitness programs for older adults 7. Personal training 7. Personal training 8. Mind/Body Exercise 8. Functional fitness 9 Exercise and weight loss 9 Core training 10. Outcome measurements 10. Group personal training Source: American College of Sport Medicine General Programming One of the most common concerns in the recreation industry is creating innovative programming to draw participants into facilities and services. Once in, participants recognize that the benefits are endless. According to Recreation Management magazine s 2013 State of the Industry Report, 19 the most popular programs, offered by survey respondents, include holiday events and other special events (64.2 %), fitness programs (61.4%), educational programs (58.9), day camps and summer camps (55.2%), youth sports teams (54.3%), sports tournaments and races (49.2 %), mind body/balance programs (49.1%), swimming programming (teams and lessons) (48.5%), adult sports teams (47.8 %), sports training (44.1%), arts and crafts (42.7%), and programs for active older adults (40.9%). The report also suggested slightly more 3 in 10 (30.2%) respondents indicated that they are planning to add additional programs at their facilities over the next three years. The most common types of programming they are planning to add include: 1. Educational programs (up from No. 5 on 2012 survey) 2. Fitness programs (up from No. 3) 3. Mind body/balance programs yoga, tai chi, Pilates, or martial arts (up from No. 6) 4. Day camps and summer camps (up from No. 10) 5. Holiday events and other special events (up from No. 7) 6. Environmental education (down from No. 1) 7. Teen programming (down from No. 2) 8. Active older adults programming (down from No. 4) 9. Sports tournaments or races (not on the 2012 survey 10. Sport training (not on the 2012 Survey) Off the top 10 list for new programming from 2012 are adult sport teams and performing arts. 19 Emily Tipping, 2013 State of the Industry Report, Trends in Parks and Recreation, Recreation Management, June Recreation Needs and Opportunities Assessment 93
100 Festivals and Events In the context of urban development, from the early 1980s, there has been a process that can be characterized as festivalization, which has been linked to the economic restructuring of towns and cities, and the drive to develop communities as large scale platforms for the creation and consumption of cultural experience. The success rate for festivals should not be evaluated simplistically solely on the basis of profit (sales), prestige (media profile), and size (numbers of events). Research by the European Festival Research Project (EFRP) 20 indicates that there is evidence of local and city government supporting and even instigating and managing particular festivals themselves to achieve local or regional economic objectives, often defined very narrowly (sales, jobs, tourists, etc.). There are also a growing number of smaller more local community based festivals and events in communities, most often supported by local councils, which have been spawned partly as a reaction to larger festivals that have become prime economic drivers. These community based festivals often will re claim cultural ground based on their social, educational, and participative value. For more information on the values of festivals and events, see the CRC Sustainable Tourism research guide 21 on this topic. In 2014, festivals were growing in popularity as economic drivers and urban brand builders. Chad Kaydo describes the phenomenon in the January 2014 issues of Governing magazine: Municipal officials and entrepreneurs see the power of cultural festivals, innovation focused business conferences and the like as a way to spur short term tourism while shaping an image of the host city as a cool, dynamic location where companies and citizens in modern, creative industries can thrive. 22 Examples of successful festivals include: South by Southwest (SXSW) this annual music, film, and digital conference and festival in Austin, Texas, is a leading example. Launched in 1987, the festival s economic impact has grown steadily over recent years. In 2007, it netted $95 million for Austin s economy. In 2013, the event topped $218 million. Coachella Valley Music and Arts Festival in California this two week cultural event draws bigname bands, music fans, and marketers, attracting 80,000 people per day. First City Festival in Monterey, California Private producer, Goldenvoice, launched this smaller music event in August 2013 with marketing support from the Monterey County Convention and Visitors Bureau, drawing on the city s history as host of the Monterey Jazz Festival. Adding carnival rides and local art, furniture, and clothing vendors to the live music performances, the event drew 11,000 attendees each of its two days. The City of Chicago launched a new festival in the fall of 2014 called the Great Chicago Fire Festival with a parade, live music, and a centerpiece of fifteen floats representing local neighborhoods destroyed in the Chicago fire of 1871 that were burned in effigy in the Chicago River. The hope is that the event will become Chicago s Mardi Gras. 20 EFRP is an international consortium seeking to understand the current explosion of festivals and its implications and perspective, aef.eu/en/activities/efrp/, accessed October Ben Janeczko. Trevor Mules and Brent Ritchie, Estimating the Economic Impacts of Festivals and Events: A Research Guide, Cooperative Research Centre for Sustainable Tourism, 2002, the economic impacts of festivals and events a researchguide, accessed October Chad Kaydo, Cities Create Music, Cultural Festivals to Make Money, Governing, January 2014, cities create mucis festivals.html. 94 Four Square Mile Neighborhood
101 Healthy Lifestyle National Trends In October, 2010 the Robert Wood Johnson Foundation s Vulnerable Populations Portfolio 23 shared thoughts on how health is impacted by where and how we live, learn, work, and play. Below demonstrates the connection that nonmedical factors play in where health starts before illness sets in. Where We Live Residential instability has adverse health impacts. Examples include: Homeless children are more vulnerable to mental health problems, developmental delays, and depression than children who are stably housed. Difficulty keeping up with mortgage payments may be linked to lower levels of psychological well being and a greater likelihood of seeing a doctor. The connection between access to public transportation and health studies found that people who live in counties with high sprawl indexes were likely to have a higher body mass index than people living in more compact counties. Convenient, affordable, and available eating habits result from inability to move from place to place within the community. PolicyLink and the Food Trust, two nonprofits focused on expanding access to fresh foods where low income people live, have found that decreased access to healthy food means people in low income communities suffer more from diet related diseases like obesity and diabetes than those in higher income neighborhoods with easy access to healthy food, particularly fresh fruits and vegetables. Communities without crime are healthier. Researchers from the Baltimore Memory Study found that residents living in the most dangerous neighborhoods were nearly twice as likely to be obese as those living in the least dangerous neighborhoods. Where We Work The relationship between work and health is critical to creating productive environments. Investing in the right ways to support employees, businesses can help create a workforce that is less stressed and more content. The net result: a happier, healthier workforce which is more productive and yields better results. An approach such as lifestyle leave to take care of the inevitable personal and family needs that arise is a valuable asset for many of the parents. Programs which help provide employees with the peace of mind also help them to breathe and work more easily. Business leaders and employees alike should view work as a place of opportunity a source of support, satisfaction, and motivation, which can offer mutual benefits when done right. 23 Health starts Where We Live, Learn, Work, and Play, RWJF Vulnerable Populations Portfolio, Robert Wood Johnson Foundation, accessed Recreation Needs and Opportunities Assessment 95
102 Where We Learn Eight times more lives can be saved with education than with medical advances. Without graduating from high school, one is likely to earn less money and struggle to make ends meet, work longer hours, and maybe even two jobs just to feed a family, and live in a compromised neighborhood without access to healthy food. Better educated people have more opportunities to make healthier decisions. They have the money and access necessary to buy and eat healthier foods. Data from the National Longitudinal Mortality Study indicates that people with higher education live five to seven years longer than those who do not finish high school. Schools are not just centers of teaching and learning, they are places that provide the opportunity to improve the health of all Americans. Where We Play Play is a profound biological process that shapes brain function. Play prompts us to be continually, joyously, physically active, combating obesity and enhancing overall health and well being. Play can interrupt the damage done by chronic stress, and gives the immune system some relief. Play is a basic need; a biological requirement for normal growth and development. Scientists associated with the National Institute for Play are united in their concern about play undernutrition, noting that the corrosive effects of this form of starvation gradually erode emotional, cognitive, and physiological well being a major aspect of sedentary, obesity, and poor stress management can be readily linked to play starvation. Providing places to spend leisure time and recreate are critical to creating healthy communities. Statewide Trends: Health and Obesity In an effort to educate Americans and encourage them to take steps toward a healthier future, the United Health Foundation annually presents America s Health Rankings: A Call to Action for Individuals & Their Communities. The UHF has tracked the health of the nation for the past 22 years, providing a unique, comprehensive perspective on how the nation (and each state) measures up. Recent editions of the Rankings suggest that our nation is extremely adept at treating illness and disease. However, Americans are struggling to change unhealthy behaviors such as smoking and obesity, which cause many of these diseases. Obesity continues to be one of the fastest growing health issues in our nation, and America is spending billions in direct health care costs associated with poor diet and physical inactivity. 96 Four Square Mile Neighborhood
103 Colorado, which has long claimed bragging rights as the leanest state in the nation, received some bad news in recent years. 24 While, the adult obesity rate of 20 percent gives Colorado a number one ranking in the country for low obesity, the Colorado 2013 Health Report Card 25 found that Colorado s obesity rate has doubled in less than 20 years. The Health Report Card 26 also found that childhood obesity levels in Colorado for children aged has fallen from 14.2 percent in 2007 to 10.9 percent in However, one third of Colorado children do not participate in regular physical activity, leading Colorado to a 24 th in the nation ranking for childhood vigorous physical activity. Colorado s poor performance for this and other child health indicators (earning Colorado a C rating for Healthy Beginnings and Healthy Childhood 27 ) does not bode well for healthy adults in the future. The State of Colorado, along with non profit partners such as the Colorado Health Foundation and Live Well Colorado, has invested in numerous programs aimed at countering the obesity epidemic. Efforts are directed at healthy eating and combating sedentary lifestyles. Policy makers want Colorado to be the first state in the country to start reducing obesity levels, which is actually happening in Arapahoe County, where the obesity rate fell from 20.3 in 2006 to a 2011 rate of Shade Structures Communities around the country are considering adding shade structures as well as shade trees to their parks, playgrounds, and pools, as a weapon against cancer and against childhood obesity 28 ; both to reduce future cancer risk and promote exercise among children. A 2005 study found that melanoma rates in people under 20 rose three percent a year between 1973 and 2001, possibly due to a thinning of the ozone layer in the atmosphere. It is recommended that children seek shade between 10 a.m. and 4 p.m., but with so little shade available, kids have nowhere to go. Additionally, without adequate shade, many play areas are simply too hot to be inviting to children. On sunny days, the playground equipment is hot enough to scald the hands of would be users. Trees would help, as tree leaves absorb about 95 percent of ultraviolet radiation, but they take a decade or more to grow large enough to make a difference. So, many communities are building shade structures instead. The non profit Shade Foundation of American is a good resource for information about shade and shade structures, 24 Katie Kerwin McCrimmon, Obesity levels spike in Colorado, Solutions, levels spike in colorado/, Accessed November 17, he%20numbers_final.pdf Liz Szabo, Shade: A weapon against skin cancer, childhood obesity, USA Today, June 30, 2011, usatoday.30.usatoday.com/news/health/wellness/story/2011/06/shade serves as a weapon against skin cancer childhoodobesity/ /1, accessed 5/23/3013. Recreation Needs and Opportunities Assessment 97
104 Trails and Health That a connected system of trails increases the level of physical activity in a community has been scientifically demonstrated through the Trails for Health initiative of the (CDC). 29 Trails can provide a wide variety of opportunities for being physically active, such as walking/running/hiking, rollerblading, wheelchair recreation, bicycling, cross country skiing and snowshoeing, fishing, hunting, and horseback riding. Recognizing that active use of trails for positive health outcomes is an excellent way to encourage people to adopt healthy lifestyle changes, American Trails has launched a Health and Trails resource section in its website: www/americantrails.org/resources/benefits/. The health benefits are equally as high for trails in urban neighborhoods as for those in state or national parks. A trail in the neighborhood, creating a linear park, makes it easier for people to incorporate exercise into their daily routines, whether for recreation or non motorized transportation. Urban trails need to connect people to places they want to go, such as schools, transit centers, businesses, and neighborhoods. 30 Economics of Health Economic Effects of Inactivity and Obesity The Alliance for Biking and Walking s Bicycling and Walking in the United States 2012 Benchmark Report indicates that 31 : Bicycling and walking levels fell 66 percent between 1960 and 2009, while obesity levels increased by 156 percent. Between 1966 and 2009, the number of children who bicycled or walked to school fell 75 percent, while the percentage of obese children rose 276 percent. In general, states with the highest levels of bicycling and walking have the lowest levels of obesity, hypertension (high blood pressure), and diabetes and have the greatest percentage of adults who meet the recommended 30 plus minutes per day of physical activity. Inactivity and obesity in the United States cost the country hundreds of billions of dollars annually. Recent studies 32 have identified at least four major categories of economic impact linked with the meteoric rise of obesity in this country, likely leading to over $215 billion in economic costs associated with obesity, annually: Direct medical costs (as much as 100% higher than for healthy weight adults). Productivity costs (absenteeism, presenteeism [working while sick], disability, and premature mortality total productivity costs as high as $66 billion annually). Transportation costs and human capital costs (studies indicate significant but further work is needed to quantify). 29 Guide to Community Preventive Services Centers for Disease Control and Prevention (CDC), 30 Health Community: What you should know about trail building, National Trails Training Partnership: Health and Fitness, accessed on May 24, The Alliance for Biking and Walking published Bicycling and Walking in the United States 2012 Benchmark Report. 32 Ross A. Hammond and Ruth Levine, The Economic Impact of Obesity in the United States, Dove Medical Press: Diabetes, Metabolic Syndrome and Obesity: Targets and Therapy, accessed December 31, Four Square Mile Neighborhood
105 The economic benefits of bicycling and walking: Bicycling and walking projects create 11 to 14 jobs per $1 million spent, compared to just seven jobs created per $1 million spent on highway projects. Cost benefit analyses show that up to $11.80 in benefits can be gained for every $1 invested in bicycling and walking. At the 2013 Walking Summit held in Washington D.C., 33 presenters called walking a wonder drug with the generic name physical activity. While other forms of physical activity work equally well, three factors were cited as making walking the most effective treatment: 1. Low or no cost 2. Simple to do for people of all ages, incomes, and fitness levels 3. Because walking is America s favorite physical activity, we are more likely to stick with a walking program than other fitness or pharmaceutical regiments Natural Environments and Open Space Conservation The top ten recommendations of the National Recreation and Parks Association (NRPA) Conservation Task Force were published in the November 2011 issue of Parks and Recreation magazine. 34 These recommendations are a compilation of best practices used by trend setting agencies. 1) Take a leadership role in the community to promote conservation. Park and recreation agencies have a unique opportunity to bring governmental agencies, non profit organizations, community leaders, and the public together for the cause of working together on community wide conservation objectives clean water, wildlife habitat preservation, reducing energy use, and improving environmental quality. Park and recreation agencies must lead the way in promoting conservation to diverse and underserved audiences. 2) Lead by example in employing best management conservation practices in parks. Park and recreation agencies should become the catalyst in the community for conservation by showing how best practices can be adopted not mowing what you do not need to mow; stopping wasteful energy consumption; and reducing pesticide use, for example. Show the public how conservation practices can benefit everyone. 3) Engage volunteers in conservation and stewardship. Create a sense of belonging and stewardship for parks by creating a personal sense of ownership and value. Enable people to identify with their parks and natural resources, and to care about their future. Sustain stewardship by creating meaningful public participation in implementation of conservation principles and practices. 33 Jay Walljasper, Walking as a Way of Life, Movement for Health and Happiness, The Walking Summit Brochure, October 2013, 34 Conservation Leaders in our Community, National Recreation and Parks Association (NRPA), November 2011 Magazine, pages , referral=other&pnum=&refresh=fj302m1i0be7&eid=8201df86 57c9 428c b31c 18125a54265c&skip= Recreation Needs and Opportunities Assessment 99
106 4) Establish a strategic land acquisition strategy based on knowledge and awareness of significant natural and cultural resources (watershed protection, unique ecological characteristics, and sensitive natural areas deserving protection). As the largest owners of public land within most communities, park and recreation agencies should lead the way in developing a strategic vision for preserving open space and conserving important landscapes and natural features. 5) Engage youth in conservation. Get kids and teens outdoors and enjoying their parks. The experience of nature is inherently rewarding for youth. Set as a goal to connect kids in the community to nature and the outdoors. Children and youth will be fascinated by nature and will develop a lifelong affinity as well as a conservation ethic if they have early opportunities to enjoy nature and recreate outdoors in a safe, rewarding way. 6) Conserve energy in all ways. Park and recreation agencies must lead by example, showing the public how and why they should adopt practices that they can see demonstrated in parks and recreation facilities. Park and recreation agencies should adopt energy conservation measures that make sense and save public taxpayer funds. 7) Protect natural resources in parks and in the community. A core mission of public parks is to protect land and water resources and to be stewards of natural resources. This means committing personnel and resources to protect natural and cultural resources and creating sustainable long term methods of funding this conservation mission. Parks and recreation agencies are entrusted with some of the most important public assets of a community and the conservation and long term protection of this public trust is and should be a core component of every parks and recreation agency s mission. 8) Create sustainable landscapes that demonstrate principles of conservation. Utilize sustainable landscape practices to save taxpayer funds, to measurably improve conservation benefits, and to educate the public about conservation. For example, agencies can reduce turf grass and mowing frequency; replace turf with native plants; manage floodplains for multiple uses including conservation and public recreation; enhance wetlands for water filtration and groundwater recharge; plant model landscapes of drought tolerant native plants adapted to climate and culture; and promote parks as food sources through edible landscapes and community gardens. 9) Forge partnerships that foster the mission of conservation. The greatest and most beneficial conservation successes most often occur as a result of collaboration. Park and recreation agencies should partner with non profit and community service organizations, universities and colleges, school systems, other governmental agencies, and non traditional partners for conservation outcomes. Promote health, education, and other goals while working toward a common mission of conservation. 10) Utilize technology to promote conservation. Park and recreation agencies need to embrace technology to promote conservation. This is not only in applications such as GIS, but in utilizing social media to engage the public, especially youth. Technology is not to be feared as something that detracts from the conservation mission of parks agencies, but rather it is to be accepted as a means of sharing knowledge and connecting people to conservation and stewardship. 100 Four Square Mile Neighborhood
107 Nature Programming Noted as early as 2003 in Recreation Management magazine, park agencies have been seeing an increase in interest in environmental oriented back to nature programs. In 2007, the National Recreation and Park Association (NRPA) sent out a survey to member agencies in order to learn more about the programs and facilities that public park and recreation agencies provide to connect children and their families with nature. 35 A summary of the results follow: Sixty eight percent (68%) of public parks and recreation agencies offer nature based programming, and 61% have nature based facilities. The most common programs include nature hikes, nature oriented arts and crafts, fishingrelated events, and nature based education in cooperation with local schools. When asked to describe the elements that directly contribute to their most successful programs, agencies listed staff training as most important followed by program content and number of staff/staff training. When asked what resources would be needed most to expand programming, additional staff was most important followed by funding. Of the agencies that do not currently offer nature based programming, 90 percent indicated that they want to in the future. Additional staff and funding were again the most important resources these agencies would need going forward. The most common facilities include: nature parks/preserves, self guided nature trails, outdoor classrooms, and nature centers. When asked to describe the elements that directly contribute to their most successful facilities, agencies listed funding as most important followed by presence of wildlife and community support. Figures from the Association for Interpretative Naturalists, a national group of nature professionals, demonstrate that nature based programs are on the rise. According to Tim Merriman, the association s executive director, the group was founded in 1954 with 40 members. It now boasts 4,800 members, with research indicating that about 20,000 paid interpreters are working nationally, along with an army of more than 500,000 unpaid volunteers staffing nature programs at parks, zoos, and museums. The growth of these programs is thought to come from replacing grandparents as the teacher about the great outdoors. There s a direct link between a lack of exposure to nature and higher rates of attention deficit disorder, obesity, and depression. In essence, parks and recreation agencies can and are becoming the preferred provider for offering this preventative healthcare. Fran P. Mainella, former director of the National Park Service and Instructor at Clemson University. It is also speculated that a return to natural roots and renewed interest in life s basic elements was spurred as a response to September 11, National Recreation and Parks Association (NRPA), NRPA Completes Agency Survey Regarding Children and Nature, nrpa_survey_regarding_children_and_nature_2007.pdf, April Margaret Ahrweiler, Call of the Wild From beautiful blossoms to bugs and guts, nature programs are growing as people return to their roots Recreation Management Magazine, October Recreation Needs and Opportunities Assessment 101
108 In his book Last Child in the Woods: Saving Children from Nature Deficit Disorder, 37 Richard Louv introduced the concept of the restorative qualities of being out in nature, for both children and adults. This concept, and research in support of it, has led to a growing movement promoting connections with nature in daily life. One manifestation of this is the development of Nature Explore Classrooms in parks. Nature Explore 38 is a collaborative program of the Arbor Day Foundation and the non profit organization, Dimensions Educational Research Foundation, with a mission of helping children and families develop a profound engagement with the natural world, where nature is an integral, joyful part of children s daily learning. Nature Explore works to support efforts to connect children with nature. Economic & Health Benefits of Parks There are numerous economic and health benefits of parks, including the following: Trails, parks, and playgrounds are among the five most important community amenities considered when selecting a home. Research from the University of Illinois shows that trees, parks, and green spaces have a profound impact on people s health and mental outlook. 39 US Forest Service research indicates that when the economic benefits produced by trees are assessed, the total value can be two to six times the cost for tree planting and care. 40 Fifty percent (50%) of Americans regard outdoor activities as their main source of exercise. 41 The Trust for Public Land has published a report titled: The Benefits of Parks: Why America Needs More City Parks and Open Space. The report makes the following observations about the health, economic, environmental, and social benefits of parks and open space 42 : Physical activity makes people healthier. Physical activity increases with access to parks. Contact with the natural world improves physical and physiological health. Residential and commercial property values increase. Value is added to community and economic development sustainability. Benefits of tourism are enhanced. Trees are effective in improving air quality and act as natural air conditioners. Trees assist with storm water control and erosion. Crime and juvenile delinquency are reduced. Recreational opportunities for all ages are provided. Stable neighborhoods and strong communities are created. 37 Richard Louv, Last Child in the Woods: Saving Children from Nature Deficit Disorder, Algonquin Books of Chapel Hill, North Carolina, What is the Nature Explore Program, NE_FAQ_002.pdf, accessed on August 12, F.E. Kuo, Environment and Crime in the Inner City: Does Vegetation Reduce Crime? Environment and Behavior, Volume 33, pp Nowak, David J., Benefits of Community Trees, (Brooklyn Trees, USDA Forest Service General Technical Report, in review). 41 Outdoor Recreation Participation Report 2010, Outdoor Foundation, Paul M. Sherer, The Benefits of Parks: Why America Needs More City Parks and Open Space, The Trust for Public Land, San Francisco, CA, Four Square Mile Neighborhood
109 Researchers have long touted the benefits of outdoor exercise. According to a study published in the Journal of Environmental Science and Technology by the University of Essex in the United Kingdom, as little as five minutes of green exercise improves both mood and self esteem. 43 A new trend started in China as they prepared to host the 2008 Summer Olympics. Their aim was to promote a society that promotes physical fitness and reaps the benefits of outdoor exercise by working out on outdoor fitness equipment. The United States is now catching up on this trend, as park and recreation departments have begun installing outdoor gyms. Equipment that can be found in these outdoor gyms is comparable to what would be found in an indoor workout facility, such as leg and chest presses, elliptical trainers, pull down trainers, etc. With no additional equipment such as weights and resistance bands, the equipment is fairly easy to install. Outdoor fitness equipment provides a new opportunity for parks and recreation departments to increase the health of their communities, while offering them the opportunity to exercise outdoors. Such equipment can increase the usage of parks, trails, and other outdoor amenities while helping to fight the obesity epidemic and increase the community s interaction with nature. Riparian and Watershed Best Practices The ability to detect trends and monitor attributes in watershed and/or riparian areas allows planners opportunities to evaluate the effectiveness of their management plan. By monitoring their own trends, planners can also identify changes in resource conditions that are the result of pressures beyond their control. Trend detection requires a commitment to long term monitoring of riparian areas and vegetation attributes. The United States Environmental Protection Agency, (EPA) suggests the following steps to building an effective watershed management plan. See Water.epa.gov 44 for more information from the EPA. Build partnerships Characterize the watershed Set goals and identify solutions Design and implementation program Implement the watershed plan Measure progress and make adjustments Sports and Recreation Trends General Sports and Recreation Trends The National Sporting Goods Association (NSGA) survey on sports participation in found that the top five athletic activities ranked by total participation included: exercise walking, exercising with equipment, swimming, camping, and aerobic exercising. Additionally, the following active, organized, or skill development activities remain popular: hiking, running/jogging, bicycle riding, basketball, golf, and soccer. 43 Cited in: Sally Russell, Nature Break: Five Minutes of Green Nurture, Green Nurture Blog, of environmental science and technology, Accessed on November 14, Implement the Watershed Plan Implement Management Strategies, US Environmental Protection Agency, Sport/Recreation Activity Participation, National Sporting Goods Association, 2013, Recreation Needs and Opportunities Assessment 103
110 The Sports & Fitness Industry Association (SFIA produces a yearly report on sports, fitness, and leisure activities in the US. The following findings were highlighted in the 2013 Report 46 : Overall participation in sports, fitness, and related physical activities remained relatively steady from 2011 to Fitness Sports had the largest increase in participation (2% increase to 61.1%). Racquet Sports participation also increased (1% increase to 12.8 %), but still remains lower than the 2008 peak rate of 14%. Both team (21.6%) and water sports 12.5%) participation increased slightly, while individual (36%) and winter sports (6.6%) participation decreased slightly. Outdoor Sports participation remained stable at around 49%. Spending on team sports at school and lessons/instruction/sports camp was expected to increase in 2013 as it has in 2011 and Twenty eight percent (28%) of all Americans are inactive, while 33% are active to a healthy level (engaged in high calorie burning level sport/fitness activities in a frequent basis). Indiana was among the states with the highest activity levels (from 38% to 43.4%). Outdoor Recreation The Outdoor Foundation releases an annual Participation in Outdoor Recreation report. According to the 2013 report, 47 while there continues to be fallout from the recent economic downturn, the number of outdoor recreation outings reached the highest participation an all time high in The foundation reports that the top outdoor activities in 2012 were running, fishing, bicycling, camping, and hiking. Bird watching is also among the favorite outdoor activities by frequency of participation. The Outdoor Foundation s research brought the following key findings. Return to Nature: Nearly 50% of Americans ages six and older participated in outdoor recreation in That equates to a total of million Americans and a net gain of one million outdoor participants. Top Five Biggest Participation Percentage Increase in Outdoor Activities in the Past three years: Triathlon (Off Road), Adventure Racing, Telemarking, Freestyle Skiing, Triathlon (Traditional/Road). Outdoor recreation trends are also a recurring topic of study by the United States Forest Service through the Internet Research Information Series (IRIS). An IRIS report dated January provides the following recent nature based outdoor recreation trends: Participation in walking for pleasure and family gatherings outdoors were the two most popular activities for the U.S. population as a whole. These outdoor activities were followed closely in popularity by viewing/photographing wildlife, boating, fishing, snow/ice activities, and swimming. There has been a growing momentum in participation in sightseeing, birding, and wildlife watching in recent years Sports, Fitness and Leisure Activities Topline Participation Report, Sporting Goods Manufacturers Association (renamed Sports and Fitness Industry Association in 2012, 47 Outdoor Recreation Participation Report 2013, Outdoor Foundation, Recent Outdoor Recreation Trends, USDA Forest Service Internet Research Information Series (IRIS) Research Brief, January 2012, accessed August, Four Square Mile Neighborhood
111 Role and Response of Local Government Collectively, these trends have created profound implications for the way local governments conduct business. Some local governments are now accepting the role of providing preventative health care through parks and recreation services. The following concepts are from the International County/County Management Association. 49 Parks & Recreation departments should take the lead in developing communities conducive to active living. There is growing support for recreation programs that encourage active living within their community. One of the highest priorities is a cohesive system of parks and trails and accessible neighborhood parks. In summary, the United States of America, its states, and its communities share the enormous task of reducing the health and economic burden of obesity. While numerous programs, policies, and products have been designed to address the problem, there is no magic bullet to make it go away. The role of public parks and recreation as a health promotion and prevention agency has come of age. What matters is refocusing its efforts to ensure the health, well being, and economic prosperity of communities and citizens. Administration Trends for Recreation and Parks Municipal parks and recreation structures and delivery systems have changed, and more alternative methods of delivering services are emerging. Certain services are being contracted out, and cooperative agreements with non profit groups and other public institutions are being developed. Newer partners include the health system, social services, justice system, education, the corporate sector, and community service agencies. These partnerships reflect both a broader interpretation of the mandate of parks and recreation agencies and the increased willingness of other sectors to work together to address community issues. The relationship with health agencies is vital in promoting wellness. The traditional relationship with education and the sharing of facilities through joint use agreements is evolving into cooperative planning and programming aimed at addressing youth inactivity levels and community needs. Listed below are additional administrative national trends: Level of subsidy for programs is lessening and more enterprise activities are being developed, thereby allowing subsidy to be used where deemed appropriate. Information technology allows for better tracking and reporting. Pricing is often determined by peak, off peak, and off season rates. More agencies are partnering with private, public, and non profit groups. Agency Accreditation Parks and Recreation agencies are affirming their competencies and value through accreditation. This is achieved by an agency s commitment to 150 standards Accessed in Recreation Needs and Opportunities Assessment 105

112 There are currently 116 agencies around the nation that have received the Commission for Accreditation of Parks and Recreation Agencies (CAPRA) accreditation. Additional benefits of CAPRA accreditation include: Boosts staff morale Encourages collaboration Improves program outcomes Identifies agency and cost efficiencies Builds high level of trust with the public Demonstrates promise of quality Identifies best management practices Americans with Disabilities Act (ADA) Compliance On September 14, 2010, the U.S. Department of Justice (DOJ) issued an amended regulation implementing the Americans with Disabilities Act (ADA 2010 Standards). 50 On March 15, 2011 the amended Act became effective, and for the first time in history, includes recreation environment design requirements. Covered entities were to be compliant with design and construction requirements and the development of three year transition plan by March 15, Implementation of the three year transition plan must be complete by March 15, People with disabilities are allowed equal access to all services provided by local, state, and federal governments, including recreational services. The ADA allows full and equal access by persons with disabilities to any place of public accommodation, governmental or private. July 26, 1990, the United States officially recognized the rights of people with disabilities by enacting the Americans with Disabilities Act (ADA). Accreditation is a distinguished mark of excellence that affords external recognition of an organization's commitment to quality and improvement. Accreditation has two fundamental purposes; to ensure quality and to ensure improvement. The National Recreation and Parks Association administratively sponsors two distinct accreditation programs. The Council on Accreditation of Parks, Recreation, Tourism, and Related Professions (COAPRT) approves Academic institutions and Commission for Accreditation of Parks and Recreation Agencies (CAPRA) approves agencies. It is the only national accreditation of parks and recreation agencies, and is a valuable measure of an agency s overall quality of operation, management, and service to the community. 50 U.S. Department of Justice, Americans with Disabilities Act, ADA Home Page, accessed on November 15, Four Square Mile Neighborhood
Section II. Planning & Public Process Planning for the Baker/Carver Regional Trail began in 2010 as a City of Minnetrista initiative.
 Section II Planning & Public Process Planning for the began in 2010 as a City of initiative. city staff began discussions with the Park District on the possibility of a north/south regional trail connection
Airport Planning Area
 PLANNING AREA POLICIES l AIRPORT Airport Planning Area LOCATION AND CONTEXT The Airport Planning Area ( Airport area ) is a key part of Boise s economy and transportation network; it features a multi-purpose
JOSLIN FIELD, MAGIC VALLEY REGIONAL AIRPORT DECEMBER 2012
 1. Introduction The Federal Aviation Administration (FAA) recommends that airport master plans be updated every 5 years or as necessary to keep them current. The Master Plan for Joslin Field, Magic Valley
10/25/2013. What is the SCORP?! 2013 Local Government Survey 2013 Statewide Public Survey Advisory Group Priority Areas Your Suggestions!
 COLORADO OUTDOOR RECREATION TRENDS RESULTS FROM THE SCORP AND STATEWIDE Colorado Outdoor Recreation Resource Partnership September 2013 PRESENTATION What is the SCORP?! 2013 Local Government Survey 2013
JATA Market Research Study Passenger Survey Results
 JATA Market Research Study Passenger Survey Results Prepared for the Jackson Area Transportation Authority (JATA) April, 2015 3131 South Dixie Hwy. Suite 545 Dayton, OH 45439 937.299.5007 www.rlsandassoc.com
NAPA VALLEY VISITOR INDUSTRY 2012 Economic Impact Report
 Join Visit Napa Valley NAPA VALLEY VISITOR INDUSTRY 2012 Economic Impact Report Research prepared for Visit Napa Valley by Destination Analysts, Inc. Table of Contents SECTION 1 Introduction 2 SECTION
NAPA VALLEY VISITOR INDUSTRY 2016 Economic Impact Report
 NAPA VALLEY VISITOR INDUSTRY 2016 Economic Impact Report Research prepared for Visit Napa Valley by Destination Analysts, Inc. Table of Contents S E C T I O N 1 Introduction 2 S E C T I O N 2 Executive
Title VI Service Equity Analysis
 Pierce Transit Title VI Service Equity Analysis Pursuant to FTA Circular 4702.1B NE Tacoma Service May 2016 Pierce Transit Transit Development Dept. PIERCE TRANSIT TITLE VI SERVICE EQUITY ANALYSIS TABLE
PEMBERTON VALLEY RECREATIONAL TRAILS MASTER PLAN UPDATE Community Open House. April 2018
 PEMBERTON VALLEY RECREATIONAL TRAILS MASTER PLAN UPDATE Community Open House April 2018 Introductions Introductions Matt Bakker, BHA Project Coordinator Other Team Members: Liz Scroggins, Grey Owl Consulting
DRAFT Appendix A Appendix B. Planning Process & Public Participation
 1 2 3 4 5 Appendix A Appendix B Planning Process & Public Participation This chapter provides an overview of the planning process. Summaries of public input for the comprehensive planning process are provided.
Sevierville, TN. Technical Appendices
 Sevierville, TN Technical Appendices 2017 2955 Valmont Road Suite 300 777 North Capitol Street NE Suite 500 Boulder, Colorado 80301 Washington, DC 20002 n-r-c.com 303-444-7863 icma.org 800-745-8780 Contents
A COMPARISON OF THE MILWAUKEE METROPOLITAN AREA TO ITS PEERS
 KRY/WJS/EDL #222377 (PDF: #223479) 1/30/15 PRELIMINARY DRAFT Memorandum Report A COMPARISON OF THE MILWAUKEE METROPOLITAN AREA TO ITS PEERS EXECUTIVE SUMMARY This memorandum report provides a statistical
AGENDA ITEM 5 D WAKULLA ENVIRONMENTAL INSTITUTE (WEI) TRAIL FEASIBILITY STUDY
 TRAIL FEASIBILITY STUDY") March 19, 2018 AGENDA ITEM 5 D WAKULLA ENVIRONMENTAL INSTITUTE (WEI) TRAIL FEASIBILITY STUDY TYPE OF ITEM: Action STATEMENT OF ISSUE The Wakulla Environmental Institute (WEI) Trail is one of several trails
March 19, 2018 AGENDA ITEM 5 D WAKULLA ENVIRONMENTAL INSTITUTE (WEI) TRAIL FEASIBILITY STUDY TYPE OF ITEM: Action STATEMENT OF ISSUE The Wakulla Environmental Institute (WEI) Trail is one of several trails
PREFACE. Service frequency; Hours of service; Service coverage; Passenger loading; Reliability, and Transit vs. auto travel time.
 PREFACE The Florida Department of Transportation (FDOT) has embarked upon a statewide evaluation of transit system performance. The outcome of this evaluation is a benchmark of transit performance that
NAPA VALLEY VISITOR INDUSTRY 2014 Economic Impact Report
 NAPA VALLEY VISITOR INDUSTRY 2014 Economic Impact Report Research prepared for Visit Napa Valley by Destination Analysts, Inc. Table of Contents SECTION 1 Introduction 2 SECTION 2 Executive Summary 5 SECTION
Figure 1.1 St. John s Location. 2.0 Overview/Structure
 St. John s Region 1.0 Introduction Newfoundland and Labrador s most dominant service centre, St. John s (population = 100,645) is also the province s capital and largest community (Government of Newfoundland
Trail Use in the N.C. Museum of Art Park:
 Trail Use in the N.C. Museum of Art Park: New Connections, New Visitors Jacqueline MacDonald Gibson, PhD Daniel Rodriguez, PhD Taylor Dennerlein, MSEE, MCRP, EIT Jill Mead, MPH Evan Comen University of
T H E VILLAGE OF P h i l m o n t, N Y
 T H E VILLAGE OF P h i l m o n t, N Y Summit Reservoir Area Plan November 17, 2014 Executive Steering Committee Meeting 2 Agenda 1:00 1. Welcome 2. Housekeeping & updates i. Committee contact list review
1.0 BACKGROUND NEW VETERANS CHARTER EVALUATION OBJECTIVES STUDY APPROACH EVALUATION LIMITATIONS... 7
 New Veterans Charter Evaluation Plan TABLE CONTENTS Page 1.0 BACKGROUND... 1 2.0 NEW VETERANS CHARTER EVALUATION OBJECTIVES... 2 3.0 STUDY APPROACH... 3 4.0 EVALUATION LIMITATIONS... 7 5.0 FUTURE PROJECTS...
Juneau Household Waterfront Opinion Survey
 Juneau Household Waterfront Opinion Survey Prepared for: City and Borough of Juneau Prepared by: April 13, 2004 TABLE OF CONTENTS Executive Summary...1 Introduction and Methodology...6 Survey Results...7
State Park Visitor Survey
 State Park Visitor Survey Methods, Findings and Conclusions State s Department of Recreation, Park and Tourism Management surveyed state park visitor and trip characteristics, and collected evaluations
Trail # NW Tuesday, June DESIGN. Provide an Review the Provide an. Project Goals: System system. wayfinding
 I. Welcome / Introductions Bethany Creek Trail #2 Segment 3 Neighborhood Meeting #1 Bethany Presbyterian Church 15505 NW Springville Road, Portland, OR 97229 Tuesday, June 26, 2018 @ 6:00PM Meeting Minutes
6/28/11 TELEPHONE (n=400, RDD) AND ON-LINE (n=6,294) SURVEY RESULTS
 AND ON-LINE (n=6,294) SURVEY RESULTS") 6/28/11 TELEPHONE (n=0, RDD) AND ON-LINE (n=6,294) SURVEY RESULTS Update Surveys An Institute for Consensus Building www.sri-consulting.org MASTER PLAN UPDATE 6/28/11 Quantifying the responses from the
6/28/11 TELEPHONE (n=0, RDD) AND ON-LINE (n=6,294) SURVEY RESULTS Update Surveys An Institute for Consensus Building www.sri-consulting.org MASTER PLAN UPDATE 6/28/11 Quantifying the responses from the
CHAPTER 2 COUNTY PROFILE
 COUNTY PROFILE CHAPTER 2: COUNTY PROFILE This chapter provides a profile of Amador County, California, in the planning context of parks and recreation services. This profile includes a description of the
Division of Governmental Studies and Services. Final Report. Washington State Outdoor Recreation Survey Report
 D 1 Appendix D: Survey Analysis Division of Governmental Studies and Services Final Report November 29, 2017 Washington State Outdoor Recreation Survey Report Report Authors: Christina Sanders, Acting
Committee. Presentation Outline
 CW-33-15 11/9/2015 Community and Corporate Services Committee November 10, 2015 1 Presentation Outline Background Vision and Objectives Study Process and Timeline Public and Stakeholder Engagement Organization
Business Item No
 Metropolitan Parks and Open Space Commission Meeting date: February 6, 2018 For the Community Development Committee meeting of February 20, 2018 For the Metropolitan Council meeting of February 28, 2018
State of the Shared Vacation Ownership Industry. ARDA International Foundation (AIF)
") State of the Shared Vacation Ownership Industry ARDA International Foundation (AIF) This paper includes a high-level overview of the timeshare industry with a core focus on financial growth, owner demographics
State of the Shared Vacation Ownership Industry ARDA International Foundation (AIF) This paper includes a high-level overview of the timeshare industry with a core focus on financial growth, owner demographics
Word Count: 3,565 Number of Tables: 4 Number of Figures: 6 Number of Photographs: 0. Word Limit: 7,500 Tables/Figures Word Count = 2,250
 Katherine F. Turnbull, Ken Buckeye, Nick Thompson 1 Corresponding Author Katherine F. Turnbull Executive Associate Director Texas Transportation Institute Texas A&M University System 3135 TAMU College
Longmont to Boulder Regional Trail Jay Road Connection DRAFT FINAL REPORT
 Longmont to Boulder Regional Trail Jay Road Connection DRAFT FINAL REPORT December 2018 Project Summary Boulder County, Colorado, in partnership with the City of Boulder, is evaluating options for multi-use
Tourism Impacts and Second Home Development in Coastal Counties: A Sustainable Approach
 Tourism Impacts and Second Home Development in Coastal Counties: A Sustainable Approach Brunswick, Currituck and Pender Counties, North Carolina (Funded by North Carolina Sea Grant) Center for Sustainable
2013 IRVING HOTEL GUEST SURVEY Final Project Report
 2013 IRVING HOTEL GUEST SURVEY Final Project Report Research prepared for the Irving Convention & Visitors Bureau by Destination Analysts, Inc. Table of Contents SECTION 1 Introduction 2 SECTION 2 Executive
Chapter 1: Introduction Draft
 Chapter 1: Draft TABLE OF CONTENTS 1... 4 1.6.1 Stakeholder Engagement Plan... 10 Chapter 1 Page 2 TABLE OF EXHIBITS Exhibit 1.1-1 ABIA Annual Growth Since 1993... 5 Exhibit 1.4-1: ABIA Location Map...
Recreationists on the Gifford Pinchot National Forest: A Survey of User Characteristics, Behaviors, and Attitudes
 Recreationists on the Gifford Pinchot National Forest: A Survey of User Characteristics, Behaviors, and Attitudes by Alan R. Graefe The Pennsylvania State University Robert C. Burns University of Florida
CHAPTER 5. Chapter 5 Recreation Element
 CHAPTER 5 Recreation Element Chapter 5 Recreation Element The Recreation Element of the Meyers Area Plan is a supplement to the Recreation Element of the TRPA Regional Plan and the El Dorado County General
Manatee County. Manatee County Parks, Recreation, and Open Spaces Master Plan. Status Update. Manatee County Board of County Commissioners Update
 Manatee County Parks, Recreation, and Open Spaces Master Plan Status Update Manatee County Board of County Commissioners Update May 9, 2017 Manatee County C R Manatee County Parks, Recreation, What is
2015 IRVING HOTEL GUEST SURVEY Final Project Report
 2015 IRVING HOTEL GUEST SURVEY Final Project Report Research prepared for the Irving Convention & Visitors Bureau by Destination Analysts, Inc. Table of Contents S E C T I O N 1 Introduction 2 S E C T
Department of Agricultural and Resource Economics, Fort Collins, CO
 June 2007 EDR 07-15 Department of Agricultural and Resource Economics, Fort Collins, CO 80523-1172 http://dare.colostate.edu/pubs OF WINE AND WILDLIFE: ASSESSING MARKET POTENTIAL FOR COLORADO AGRITOURISM
2012 In-Market Research Report. Kootenay Rockies
 2012 In-Market Research Report Kootenay Rockies Executive Summary This report summarizes key highlights for the Kootenay Rockies (KR) region taken from the British Columbia In-Market study conducted in
2013 Business & Legislative Session Visitor Satisfaction Survey Results
 2013 Business & Legislative Session Visitor Satisfaction Survey Results Completed by Juneau Economic Development Council in partnership with The Alaska Committee August 2013 JEDC research efforts are supported
IL 390 Station. Wood Dale Open House Summary 5/18/17
 Wood Dale Open House Summary 5/18/17 The first public open house for the Wood Dale Comprehensive Plan took place on May 18 th, 2017. The program was conducted as a fun community event and there were 216
ZoPath Trail. Extreme Park. Group III. Brendan Pillar, Conor Coakley James Amendola, & Mark McDermott. May 4, 2006
 ZoPath Trail & Extreme Park Group III Brendan Pillar, Conor Coakley James Amendola, & Mark McDermott May 4, 2006 HOW TO GET FROM THE TOWPATH S NORTHERN TRAILHEAD TO HERE? Bridging Two 1 st -Class Regional
Puerto Ricans in Ohio, the United States, and Puerto Rico, 2014
 Issued April 2016 Centro DS2015US-12 Puerto Ricans in Ohio, the United States, and Puerto Rico, 2014 In 2014, Ohio had the tenth largest number of Puerto Ricans in the United States with 108,174 residents,
Santa Barbara County Association of Governments 2002 COMMUTE PROFILE
 Santa Barbara County Association of Governments 2002 COMMUTE PROFILE for Santa Barbara, San Luis Obispo and Ventura Counties FINAL REPORT Santa Barbara County Association of Governments - 2002 COMMUTE
Puerto Ricans in Rhode Island, the United States, and Puerto Rico, 2013
 Issued September 2016 Centro DS2015US-07 Puerto Ricans in Rhode Island, the United States, and Puerto Rico, 2013 In 2013 an estimated 36,217 Puerto Ricans lived in Rhode Island and accounted for at least
An outdoor waterpark is a facility offering three or more waterslides and other aquatic facilities.
 Methodology for Feasibility Studies for Waterparks By David J. Sangree, MAI, CPA, ISHC Before a developer or an organization considers constructing a new indoor or outdoor waterpark at a resort or standalone,
Hazlet. 1. Overview of Hazlet and Its Waterfront. Hazlet Township. 1.1 Geographic Overview
 Hazlet 1. Overview of Hazlet and Its Waterfront 1.1 Geographic Overview Hazlet Township is located in Monmouth County. The Township has a land area of 5.6 square miles. Situated in the Bayshore region
The Economic Contributions of Agritourism in New Jersey
 The Economic Contributions of Agritourism in New Jersey Bulletin E333 Cooperative Extension Brian J. Schilling, Extension Specialist in Agricultural Policy Kevin P. Sullivan, Institutional Research Analyst
Part Three : COMMUNITY PLAN AREAS AND SPECIAL STUDY AREAS SACRAMENTO 2030 GENERAL PLAN. Introduction
 Special study Areas Part Three : COMMUNITY PLAN AREAS AND SPECIAL STUDY AREAS SACRAMENTO 2030 GENERAL PLAN Introduction Beyond the boundaries of the 2030 General Plan, the City has defined Special Study
HEALTH SECTOR ECONOMIC INDICATORS REPORT
 HEALTH SECTOR ECONOMIC INDICATORS REPORT For: Mid North Coast Local Health District Report prepared by: April 2013 Table of Contents Introduction 3 Executive Summary 4 Output 5 Value-Added 7 Workforce
Gold Coast. Rapid Transit. Chapter twelve Social impact. Chapter content
 Gold Coast Rapid Transit Chapter twelve Social impact Chapter content Social impact assessment process...235 Existing community profile...237 Consultation...238 Social impacts and mitigation strategies...239
2009 Muskoka Airport Economic Impact Study
 2009 Muskoka Airport Economic Impact Study November 4, 2009 Prepared by The District of Muskoka Planning and Economic Development Department BACKGROUND The Muskoka Airport is situated at the north end
The City of Durango Community Interest and Opinion Survey Executive Summary
 The City of Durango Community Interest and Opinion Survey Executive Summary Overview ETC Institute administered a community interest and opinion survey for the City of Durango between January and March
Dover Park Master Plan. Community Design Event Tuesday, May 22, 5 7 pm
 Dover Park Master Plan Community Design Event Tuesday, May 22, 5 7 pm Agenda I. Introduction / Overview 20 minutes II. Small Group Design Activity 60 minutes III. Small Group Report Out IV. Conclusion
Cedar Rapids Area Convention and Visitors Bureau Visitor Study
 Cedar Rapids Area Convention and Visitors Bureau Visitor Study 2003-2004 University of Northern Iowa Sustainable Tourism & The Environment Program www.uni.edu/step Project Directors: Sam Lankford, Ph.D.
Chapter 1: Introduction
 Chapter 1: TABLE OF CONTENTS 1... 4 1.1 Master Plan Study Content... 4 1.2 Purpose and Scope of Master Plan Study... 4 1.3 Airport History and Role... 6 1.4 Airport Location and Service Area... 6 1.5 ABIA
4MRV Parks Master Plan: Site Analysis
 4MRV Parks Master Plan: Site Analysis Lardner/Klein Landscape Architects in association with: RK&K Grimm + Parker Kittelson & Associates Partners for Economic Solutions RIB U.S.Cost Civil Engineering Architecture
Appendix B Ultimate Airport Capacity and Delay Simulation Modeling Analysis
 Appendix B ULTIMATE AIRPORT CAPACITY & DELAY SIMULATION MODELING ANALYSIS B TABLE OF CONTENTS EXHIBITS TABLES B.1 Introduction... 1 B.2 Simulation Modeling Assumption and Methodology... 4 B.2.1 Runway
DRAFT Service Implementation Plan
 2017 Service Implementation Plan October 2016 SECTION NAME 2017 Service Implementation Plan October 2016 2017 SERVICE IMPLEMENTATION PLAN TABLE OF CONTENTS Table of Contents... I List of Tables... III
Blueways: Rivers, lakes, or streams with public access for recreation that includes fishing, nature observation, and opportunities for boating.
 Parks, Open Space and Trails PRINCE WILLIAM COUNTY 2008 COMPREHENSIVE PLAN TRAILS PLAN CONTENTS The components of the trails plan are: Intent Definitions Goals, Policies, and Action Strategies Trails Map
FORECASTING FUTURE ACTIVITY
 EXECUTIVE SUMMARY The Eagle County Regional Airport (EGE) is known as a gateway into the heart of the Colorado Rocky Mountains, providing access to some of the nation s top ski resort towns (Vail, Beaver
POPULATION INTRODUCTION
 POPULATION INTRODUCTION The socio-economic data available at the time of this writing is a conglomeration of data provided by the Kentucky State Data Center, OKI Regional Council of Governments, 2010 U.S.
Puerto Ricans in Connecticut, the United States, and Puerto Rico, 2014
 Issued April 2016 Centro DS2016US-8 Puerto Ricans in Connecticut, the United States, and Puerto Rico, 2014 In 2014, Connecticut was the 6th state with most Puerto Ricans (301,182) in the United States.
I I EXECUTIVE SUMMARY. A. Introduction
 EXECUTIVE SUMMARY EXECUTIVE SUMMARY A. Introduction I I 1 The Pinellas County Metropolitan Planning Organization (MPO) is planning extensions for the Pinellas Trail, a pedestrian and bicycle facility that
Parkland County Municipal Development Plan Amendment Acheson Industrial Area Structure Plan
 Parkland County Municipal Development Plan Amendment Acheson Industrial Area Structure Plan New Plan Acheson Industrial Area Structure Plan Amendment Parkland County Municipal Development Plan Board Reference
THE PARK AT CANYON RIDGE
 THE PARK AT CANYON RIDGE 272 UNITS NEAR DTC & FITZSIMONS DENVER, COLORADO EXECUTIVE SUMMARY HFF is pleased to present the opportunity to acquire The Park at Canyon Ridge ( Property ), a 272-unit, garden-style
MONTEREY REGIONAL AIRPORT MASTER PLAN TOPICAL QUESTIONS FROM THE PLANNING ADVISORY COMMITTEE AND TOPICAL RESPONSES
 MONTEREY REGIONAL AIRPORT MASTER PLAN TOPICAL QUESTIONS FROM THE PLANNING ADVISORY COMMITTEE AND TOPICAL RESPONSES Recurring topics emerged in some of the comments and questions raised by members of the
RE: Access Fund Comments on Yosemite National Park Wilderness Stewardship Plan, Preliminary Ideas and Concepts
 September 30, 2016 Superintendent Yosemite National Park Attn: Wilderness Stewardship Plan P.O. Box 577 Yosemite, CA 95389 RE: Access Fund Comments on Yosemite National Park Wilderness Stewardship Plan,
POLICY & STRATEGIES The Vancouver Park Board approves major changes in Vancouver parks, including the design and development of parks.
 September 8, 2017 TO: Park Board Chair and Commissioners FROM: General Manager Vancouver Board of Parks and Recreation SUBJECT: Brewers Park and Clinton Park Renewal Concept Plans RECOMMENDATION THAT the
Economic Impact of Tourism in Hillsborough County September 2016
 Economic Impact of Tourism in Hillsborough County - 2015 September 2016 Key findings for 2015 Almost 22 million people visited Hillsborough County in 2015. Visits to Hillsborough County increased 4.5%
2004 SOUTH DAKOTA MOTEL AND CAMPGROUND OCCUPANCY REPORT and INTERNATIONAL VISITOR SURVEY
 2004 SOUTH DAKOTA MOTEL AND CAMPGROUND OCCUPANCY REPORT and INTERNATIONAL VISITOR SURVEY Prepared By: Center for Tourism Research Black Hills State University Spearfish, South Dakota Commissioned by: South
Coordinated Population Forecast for Clackamas County, its Urban Growth Boundaries (UGB), and Area Outside UGBs
, and Area Outside UGBs") Coordinated Population Forecast for Clackamas County, its Urban Growth Boundaries (UGB), and Area Outside UGBs 2017-2067 Prepared by Population Research Center College of Urban and Public Affairs Portland
Coordinated Population Forecast for Clackamas County, its Urban Growth Boundaries (UGB), and Area Outside UGBs 2017-2067 Prepared by Population Research Center College of Urban and Public Affairs Portland
Parks and Recreation Master Plan
 Emerging Themes Parks and Recreation Master Plan City of Mount Dora, Florida September 17, 2018- Revised October 1, 2018 Agenda Welcome & duction Master Plan The Inventory & Existing Community Overview
CITY OF COTATI: LOCAL ECONOMIC REPORT
 EDB Sonoma County Economic Development Board Cotati Chamber of Commerce economy 2010-11 CITY OF COTATI: LOCAL ECONOMIC REPORT E c o n o m i c D e v e l o p m e n t B o a r d 4 0 1 C o l l e g e Av e n
A COMPARISON OF THE MILWAUKEE METROPOLITAN AREA TO ITS PEERS
 KRY/WJS/EDL #222377 v4 (PDF: #223479v2) 4/1/15 APPENDIX D REVISED DRAFT Memorandum Report A COMPARISON OF THE MILWAUKEE METROPOLITAN AREA TO ITS PEERS EXECUTIVE SUMMARY This report provides a statistical
CHAPTER 6 NOISE EXPOSURE
 CHAPTER 6 NOISE EXPOSURE FAA requires that the NEM submitted for review represent the aircraft noise exposure for the year of submittal (in this case 2008) and for a future year (2013 for OSUA). However,
Chapter 1: The Population of NHS Greater Glasgow and Clyde
 Population Estimate (thousands) Chapter 1: The Population of NHS Greater Glasgow and Clyde Population Trends and Projections National Records of Scotland estimated (NRS SAPE) 1 the 2013 NHS Greater Glasgow
CHAPTER 3: COMMUNITY PROFILE
 CHAPTER 3: COMMUNITY PROFILE Chapter 3 includes the following information: 1. Community Context 2. The Land 3. The People Who Live Here 4. The Housing Landscape 5. The Economy 6. Past and Future Growth
2.1 TITLE: VMC PARKS MASTER PLAN AND IMPLEMENTATION STRATEGY PROJECT UPDATE
 2.1 Item: VMC Sub-committee Report DATE: Tuesday, June 12, 2018 WARD: 4 TITLE: VMC PARKS MASTER PLAN AND IMPLEMENTATION STRATEGY PROJECT UPDATE FROM: Jason Schmidt-Shoukri, Deputy City Manager, Planning
PROFILE OF THE PUERTO RICAN POPULATION IN UNITED STATES AND PUERTO RICO: 2008
 PROFILE OF THE PUERTO RICAN POPULATION IN UNITED STATES AND PUERTO RICO: 2008 Sonia G. Collazo, Camille L. Ryan, Kurt J. Bauman U.S. Census Bureau Housing and Household Economic Statistics Division This
Establishes a fare structure for Tacoma Link light rail, to be implemented in September 2014.
 RESOLUTION NO. R2013-24 Establish a Fare Structure and Fare Level for Tacoma Link MEETING: DATE: TYPE OF ACTION: STAFF CONTACT: PHONE: Board 09/26/2013 Final Action Ric Ilgenfritz, Executive Director,
The Economic Impact of Tourism in Hillsborough County. July 2017
 The Economic Impact of Tourism in Hillsborough County July 2017 Table of contents 1) Key Findings for 2016 3 2) Local Tourism Trends 7 3) Trends in Visits and Spending 12 4) The Domestic Market 19 5) The
2006 RENO-SPARKS VISITOR PROFILE STUDY
 2006 RENO-SPARKS VISITOR PROFILE STUDY PREPARED FOR RENO-SPARKS CONVENTION & VISITOR AUTHORITY Study Conducted and Reported by 475 Hill Street, Suite 2 Reno, Nevada 89501 (775) 323-7677 www.infosearchintl.com
Saginaw Charter Township Master Plan
 Saginaw Charter Township Master Plan Overview of Draft & Public Hearing August 20, 2014 230 South Washington Avenue Saginaw Michigan 48607 (989) 754-4717 www.spicergroup.com Saginaw Charter Township Master
Review of Government Secondary School Requirements within the Sunbury South Precinct Structure Plan
 Review of Government Secondary School Requirements within the Sunbury South Precinct Structure Plan Expert Witness Statement August 11 th, 2017 Prepared by Robert Panozzo Director, ASR Research Pty Ltd
Tourism Impacts and Second Home Development in Pender County: A Sustainable Approach
 Tourism Impacts and Second Home Development in Pender County: A Sustainable Approach (Funded by North Carolina Sea Grant) Center for Sustainable Tourism Division of Research and Graduate Studies East Carolina
City of Durango 5.8 FUNDING TRAILS DEVELOPMENT
 5.8 FUNDING TRAILS DEVELOPMENT The City has been successful in establishing dedicated local funding sources as well as applying for grants to develop the City s trail system, having received nearly $2.4
The Millennial Traveller 2018
 The Millennial Traveller 2018 Counter Intelligence Retail Counter Intelligence Retail is the travel retail industry s leading agency, with services covering areas including research, category development
Recreation Opportunity Analysis Authors: Mae Davenport, Ingrid Schneider, & Andrew Oftedal
 Authors: Mae Davenport, Ingrid Schneider, & Andrew Oftedal // 2010 Supply of Outdoor Recreation Resources // Recreation Location Quotient Analysis recreation opportunity analysis // 59 2010 Supply of Outdoor
TOWN PLANNING SUBMISSION TO THE GREATER SYDNEY COMMISSION LANDS AT ARTARMON
 TOWN PLANNING SUBMISSION TO THE GREATER SYDNEY COMMISSION LANDS AT ARTARMON March 2017 TABLE OF CONTENTS 1.0 INTRODUCTION 3 2.0 THE SUBJECT SITE 4 3.0 STRATEGIC PLANNING CONTEXT 6 4.0 SUMMARY AND CONCLUSIONS
MAPPING UNSHELTERED HOMELESSNESS IN INDIANAPOLIS ISSUE C17-20 NOVEMBER 2017
 MAPPING UNSHELTERED HOMELESSNESS IN INDIANAPOLIS ISSUE C17-20 NOVEMBER 2017 AUTHOR Chris Holcomb, Graduate Student, School of Public and Environmental Affairs, IUPUI 334 N. Senate Avenue, Suite 300 Indianapolis,
ARRIVAL CHARACTERISTICS OF PASSENGERS INTENDING TO USE PUBLIC TRANSPORT
 ARRIVAL CHARACTERISTICS OF PASSENGERS INTENDING TO USE PUBLIC TRANSPORT Tiffany Lester, Darren Walton Opus International Consultants, Central Laboratories, Lower Hutt, New Zealand ABSTRACT A public transport
Area Surrounding Maplewood Manor
 BAY CITY, MICHIGAN HOUSING COMMISSION Neighborhood Revitalization Plan Area Surrounding Maplewood Manor January 13, 2014 CITY COMMISSION DRAFT PLAN PRESENTATION BAY CITY, MICHIGAN 1 Planners Phil McKenna,
6. How connected do you feel to the Sans Souci community?
 Please complete and return before May 1st, 2017, to be entered for a prize drawing. Further instructions are available on the last page. Digital version available at GCPlanning.org. 1. Do you live and/or
The Economic Impact of Tourism in Jacksonville, FL. June 2016
 The Economic Impact of Tourism in Jacksonville, FL June 2016 Highlights Visitor spending surpassed $2.0 billion in 2015, growing 4.4%. As this money flowed through Duval County, the $2.0 billion in visitor
Puerto Ricans in Georgia, the United States, and Puerto Rico, 2014
 Issued September 2016 Centro DS2014GA-14 Puerto Ricans in Georgia, the United States, and Puerto Rico, 2014 In 2014, an estimated 89,462 Puerto Ricans lived in Georgia and accounted for 1.7 percent of
Puerto Ricans in Massachusetts, the United States, and Puerto Rico, 2014
 Issued April 2016 Centro DS2016US-07 Puerto Ricans in Massachusetts, the United States, and Puerto Rico, 2014 In 2014, Massachusetts was the fifth state with most Puerto Ricans in the United States. In
Business Item No XXX. Proposed Action That the Metropolitan Council approve the Coon Creek Regional Trail Master Plan.
 Business Item No. 2015-XXX Metropolitan Parks and Open Space Commission Meeting date: July 7, 2015 For the Community Development Committee meeting of July 20, 2015 For the Metropolitan Council meeting
DEMOGRAPHICS AND EXISTING SERVICE
 EXECUTIVE SUMMARY The Central Corridor light-rail transit (LRT) project will open in 2014 and operate between downtown Minneapolis and downtown St. Paul, serving the University of Minnesota and University
Those with Interest in the City of Cambridge Trail System
 Community Services Department City Hall 50 Dickson Street, P.O. Box 669 Cambridge ON N1R 5W8 Tel: 519-740-4681 July 20, 2010 To: Re: Those with Interest in the City of Cambridge Trail System City of Cambridge