Whitehorse Bear Hazard Assessment
|
|
|
- Kristopher Arnold
- 6 years ago
- Views:
Transcription


1 Whitehorse Bear Hazard Assessment Whitehorse, Yukon Territory Prepared by Wind River Bear Institute Canada Lori Homstol and Claire Edwards With GIS support from Sandra MacDougall and Andrew Smith Sponsored by
2 ACKNOWLEDGEMENTS Yukon Government Department of Environment, the City of Whitehorse, Ta an First Nation, Kwanlin Dün First Nation, Margo Supplies Ltd., Wild Wise Yukon and Yellowstone to Yukon provided funding for the assessment, which was conducted over 21 days in July, August and September of EXECUTIVE SUMMARY To conduct the Whitehorse Bear Hazard Assessment, we compiled data from the Yukon Territorial Government (YG), information from public input sessions, habitat mapping data, information collected during interview sessions and data collected in the field to summarize and describe human-bear conflict causes in Whitehorse, Yukon. Non-natural attractants were surveyed in all urban residential subdivisions, rural residential subdivisions, trailer parks and campgrounds, as well as in a sampling of seven schools, 13 playgrounds, and four trails. Information was also gathered from interviews with Environment Yukon employees, City of Whitehorse employees, local non-government organizations and public information sessions, where data was collected on public opinion of conflict history within the city and opinions on bear management. Black bears accounted for most wildlife occurrence reports (81%), with grizzly bears accounting for 15% of reports (YG data). The remaining 4% were bears of unknown species. Occurrence reports typically begin in early April, peak in late June and early July, and decline sharply from August to October. The cause of conflict was most often related to bears accessing human food and garbage. During non-natural attractant audits, we noted high proportions (over 50% of properties surveyed) of unsecured attractants considered high value to bears (e.g. garbage, recycling, compost/organics), particularly in rural residential areas. Mapping was conducted at a scale of 1:20,000 based on the Ecological Map created by Applied Ecosystems Ltd in All areas surveyed were ranked by comparative hazard for bears and people. Hazard maps account for proximity to green space, previous reported human-bear conflict, non-natural attractants and natural bear habitat, and rank each subdivision within area type (e.g. rural residential, urban residential) from highest to lowest hazard. Downtown, Robert Service campground, 2
3 Hidden Valley school and the playground at Northlands trailer park ranked in the highest hazard categories for residential areas, campgrounds, sample of schools, and sample of playgrounds respectively. Northlands trailer park, Hi Country RV Park, Golden Horn school and the playground at Mary Lake ranked the lowest hazard categories for residential areas, campgrounds, sample of schools, and sample of playgrounds respectively. We discuss management options for decreasing the accessibility of garbage for bears, how to manage natural attractants (in particular, soapberry), and make recommendations to reduce human-caused bear mortality and increase human safety in Whitehorse. HIGHEST PRIORITIES RECOMMENDATIONS 1. Conduct a thorough assessment of available bear-resistant garbage management systems (described in the Discussion section) to determine which system would work best for Whitehorse. With the unique needs of each subdivision type, there is not likely one prescription that would fit every area. We suggest either the Haul-All system for the entire city; or an equivalent system with tested and certified self-latching bear-resistant garbage totes for urban residential areas and a system similar to Haul-All for rural residential areas. 2. Implement a city-wide bear-resistant waste management system (for residential and commercial properties). 3. For Kwanlin Dün areas (MacIntyre, Crow & Swan), replace wooden garbage boxes at residences and community buildings with bear-resistant metal boxes that can hold garbage and recycling/compost. Hold a community spring clean-up to remove any left over bones from the fall hunt that were given to dogs. Make the event social to encourage resident participation. 4. Draft and pass a wildlife attractants bylaw (see Appendix V for a sample bylaw from the District of Squamish). Consider including all non-natural attractants, including bird feeders, livestock (electric fence) and fruit trees. 5. Install bear-resistant food lockers and garbage bins at campground tenting sites, prioritizing Robert Service campground tenting area. 3
4 6. Pedestrian garbage bins in parks, campgrounds and scattered around the city are often not bear-resistant, as many have had the latches removed. These bins should be completely audited (and monitored on a 1-5 year cycle) and replaced or repaired as required. Prioritize bins bordering on green space and campgrounds. 7. Open sightlines and remove soapberry plants prioritizing the areas abutting green spaces in the highest hazard areas: the downtown escarpment, Hamilton Boulevard, Copper Ridge, Hidden Valley school, the tenting loop at Robert Service campground. Work with Fire smart initiatives to pool planning and resources. 8. Require new developments to install bear-resistant garbage bins (or provide bear resistant garbage totes) as part of the development plan. 9. Implement an education program for city workers (bylaw, permit granting staff) about the merits of electric fencing (constructed for predator exclusion) for livestock. The cost-sharing program implemented by the agriculture branch appears to be under-utilized and should be advertised to local agriculturalists. MODERATE PRIORITIES 1. Landfill maintenance should be increased to ensure the electric fence maintains a high charge. Keep vegetation and loose garbage that could short out wires near the fence low for at least four feet outside the fence (use a weed-whacker/bobcat as often as is necessary). 2. Start a program to manage community fruit trees (including education). Assist residents who want to harvest their fruit (with community gleaning programs etc.) so bears don t access the fruit first. Implement a program to replace unwanted fruit trees with trees that blossom in the spring but do not produce fruit (e.g. spring snow crabapple trees). 3. Start a bear-resistant bin loaner program for recycling and livestock feed. These programs have been quite popular in some communities (e.g. Bragg Creek, AB; Meadow Creek, BC). 4. Remove fruiting berry bushes from city landscaping and enact a policy of planting natural food less attractive to bears. 4
5 5. If certain trails are experiencing high numbers of bear sightings, consider a trail audit, to assess sightlines and bear food on trails popular with recreationalists. 6. Audit the remaining schools to determine if sightlines need to be increased or bear food (e.g. soapberry) needs to be removed. 7. Erect educational bear signage at the recreation areas, prioritizing Day Use areas, as users are more likely to have food with them. Replace non bearresistant bins with bear-resistant ones. 8. Continue partnerships (including the Bear Working Group) with the City of Whitehorse, Wild Wise Yukon and Environment Yukon to ensure humanbear conflict issues are mitigated with input and resources from all stakeholders. Developing capacity through staff and volunteers at Wild Wise Yukon will help keep much of the work required for these recommendations local. 9. Update this hazard assessment in approximately five years to track progress and measure success. 5
6 TABLE OF CONTENTS Whitehorse Bear Hazard Assessment October, 2015 ACKNOWLEDGEMENTS... 2 EXECUTIVE SUMMARY... 2 RECOMMENDATIONS... 3 HIGHEST PRIORITIES... 3 MODERATE PRIORITIES... 4 INTRODUCTION OBJECTIVES OF BEAR HAZARD ASSESSMENTS STUDY AREA METHODS DATA COLLECTION Occurrence & TIPP line reports Habitat Mapping Field Data Public Input DATA ANALYSIS Occurrence & TIPP line reports Habitat Mapping Field Data Public Input Hazard Rankings RESULTS OCCURRENCE & TIPPLINE REPORTS HABITAT MAPPING FIELD DATA Urban residential Rural Residential Urban Commercial Industrial Areas Trailer Parks Campgrounds and RV Parks Schools Playgrounds Trails City Parks and Recreation areas Additional audits Public Input HAZARD RANKINGS CURRENT PROGRAMS TO REDUCE HUMAN-BEAR CONFLICT DISCUSSION ATTRACTANT MANAGEMENT Garbage Management
7 Other non-natural attractants First Nation Communities Natural attractants Potential future sources of conflict in Whitehorse In Summary CONCLUSION AND RECCOMENDATIONS HIGHEST PRIORITIES MODERATE PRIORITIES LITERATURE CITED APPENDIX I... I LIST OF INTERVIEWEES DURING THE FIELD VISIT TO WHITEHORSE, JULY AND AUGUST I APPENDIX II... II RESIDENTIAL, COMMERCIAL AND INDUSTRIAL SURVEY DETAILS... II APPENDIX III... IV ECOSYSTEM MAP (APPLIED ECOSYSTEM MANAGEMENT 2000) HABITAT DESCRIPTIONS AND RANKING ACCORDING TO HABITAT QUALITY FOR GRIZZLY AND BLACK BEARS... IV APPENDIX IV... IX HAZARD RANKINGS... IX APPENDIX V... XI SAMPLE WILDLIFE ATTRACTANTS BYLAW... XI LIST OF FIGURES FIGURE 1. MONTHLY GRIZZLY BEAR AND BLACK BEAR OCCURRENCES (SIGHTINGS, ENCOUNTERS, CONFLICTS, AND BEAR MORTALITIES) IN WHITEHORSE, YUKON, (YG OCCURRENCES FROM , TIPP LINE REPORTS FROM , N = 328). 28 FIGURE 2. OCCURRENCE TYPE BY YEAR IN WHITEHORSE, YUKON FOR GRIZZLY BEAR AND BLACK BEARS. 29 FIGURE 3. PROBABLE CAUSE OF HUMAN-BEAR CONFLICT IN WHITEHORSE, YUKON ( ). 30 FIGURE 4. NUMBER OF BEAR ATTRACTANTS PER RESIDENCE IN ALL AREA TYPES OF WHITEHORSE, YUKON, FIGURE 5. RELATIVE QUALITY OF NON-NATURAL BEAR ATTRACTANTS VISIBLE FROM THE STREET AT SURVEYED RESIDENCES IN ALL AREA TYPES OF WHITEHORSE, YUKON, FIGURE 6. NUMBER OF BEAR ATTRACTANTS PER RESIDENCE IN URBAN RESIDENTIAL AREAS OF WHITEHORSE, YUKON, FIGURE 7. RELATIVE QUALITY OF NON-NATURAL BEAR ATTRACTANTS THAT WERE VISIBLE FROM THE STREET IN URBAN RESIDENTIAL AREAS OF WHITEHORSE, YUKON, FIGURE 8. CURBSIDE GARBAGE TOTE AUDIT COUNT FOR THE NUMBER OF GARBAGE BINS SET OUT ON THE STREET THE NIGHT BEFORE PICKUP IN URBAN RESIDENTIAL SUBDIVISIONS OF WHITEHORSE, YUKON, FIGURE 9. NUMBER OF BEAR ATTRACTANTS PER RESIDENCE IN RURAL RESIDENTIAL AREAS OF WHITEHORSE, YUKON,
8 FIGURE 10. RELATIVE QUALITY OF NON-NATURAL BEAR ATTRACTANTS IN RURAL RESIDENTIAL AREAS OF WHITEHORSE, YUKON, FIGURE 11. NUMBER OF BEAR ATTRACTANTS PER RESIDENCE VISIBLE FROM THE STREET IN INDUSTRIAL AREAS OF WHITEHORSE, YUKON, FIGURE 12. RELATIVE QUALITY OF NON-NATURAL BEAR ATTRACTANTS VISIBLE FROM THE STREET IN INDUSTRIAL AREAS IN WHITEHORSE, YUKON, FIGURE 13. NUMBER OF BEAR ATTRACTANTS PER RESIDENCE VISIBLE FROM THE STREET IN TRAILER PARKS OF WHITEHORSE, YUKON, FIGURE 14. RELATIVE QUALITY OF NON-NATURAL BEAR ATTRACTANTS VISIBLE FROM THE STREET IN TRAILER PARKS IN WHITEHORSE, YUKON, FIGURE 15. NUMBER OF ATTRACTANTS PER SITE AT CAMPGROUNDS IN WHITEHORSE, YUKON, FIGURE 16. RELATIVE QUALITY OF NON-NATURAL BEAR ATTRACTANTS VISIBLE FROM THE STREET IN CAMPGROUNDS IN WHITEHORSE, YUKON, FIGURE 17. HI COUNTRY RV PARK BEAR HAZARD ASSESSMENT. FROM LEFT TO RIGHT ARE ASSESSMENTS FOR PRE-BERRY (APRIL 1 JULY 15), BERRY (JULY 16 AUGUST 31) BEAR FEEDING SEASONS IN WHITEHORSE, YUKON. POST-BERRY SEASON (SEPTEMBER 1 NOVEMBER 30) HAD THE SAME RESULT AS PRE-BERRY SEASON. 50 FIGURE 18. PIONEER RV PARK BEAR HAZARD ASSESSMENT. FROM LEFT TO RIGHT ARE ASSESSMENTS FOR PRE-BERRY (APRIL 1 JULY 15), BERRY (JULY 16 AUGUST 31) BEAR FEEDING SEASONS IN WHITEHORSE, YUKON. POST-BERRY SEASON (SEPTEMBER 1 NOVEMBER 30) HAD THE SAME RESULT AS PRE-BERRY SEASON. 50 FIGURE 19. ROBERT SERVICE CAMPGROUND BEAR HAZARD ASSESSMENT. FROM LEFT TO RIGHT ARE ASSESSMENTS FOR PRE-BERRY (APRIL 1 JULY 15), BERRY (JULY 16 AUGUST 31) BEAR FEEDING SEASONS IN WHITEHORSE, YUKON. POST-BERRY SEASON (SEPTEMBER 1 NOVEMBER 30) HAD THE SAME RESULT AS PRE-BERRY SEASON. 51 FIGURE 20. WOLF CREEK CAMPGROUND BEAR HAZARD ASSESSMENT. FROM LEFT TO RIGHT ARE ASSESSMENTS FOR PRE-BERRY (APRIL 1 JULY 15), BERRY (JULY 16 AUGUST 31) BEAR FEEDING SEASONS IN WHITEHORSE, YUKON. POST-BERRY SEASON (SEPTEMBER 1 NOVEMBER 30) HAD THE SAME RESULT AS PRE-BERRY SEASON. 51 FIGURE 21. ÉCOLE ÉMELIE TREMBLAY SCHOOL BEAR HAZARD ASSESSMENT. FROM LEFT TO RIGHT ARE ASSESSMENTS FOR PRE-BERRY (APRIL 1 JULY 15), BERRY (JULY 16 AUGUST 31) BEAR FEEDING SEASONS IN WHITEHORSE, YUKON. POST-BERRY SEASON (SEPTEMBER 1 NOVEMBER 30) HAD THE SAME RESULT AS PRE-BERRY SEASON. 53 FIGURE 22. ELIJAH SMITH SCHOOL BEAR HAZARD ASSESSMENT. FROM LEFT TO RIGHT ARE ASSESSMENTS FOR PRE-BERRY (APRIL 1 JULY 15), BERRY (JULY 16 AUGUST 31) BEAR FEEDING SEASONS IN WHITEHORSE, YUKON. POST-BERRY SEASON (SEPTEMBER 1 NOVEMBER 30) HAD THE SAME RESULT AS PRE-BERRY SEASON. 53 FIGURE 23. GOLDEN HORN SCHOOL BEAR HAZARD ASSESSMENT. FROM LEFT TO RIGHT ARE ASSESSMENTS FOR PRE-BERRY (APRIL 1 JULY 15), BERRY (JULY 16 AUGUST 31) BEAR FEEDING SEASONS IN WHITEHORSE, YUKON. POST-BERRY SEASON (SEPTEMBER 1 NOVEMBER 30) HAD THE SAME RESULT AS PRE-BERRY SEASON. 53 FIGURE 24. GREY MOUNTAIN SCHOOL BEAR HAZARD ASSESSMENT. FROM LEFT TO RIGHT ARE ASSESSMENTS FOR PRE-BERRY (APRIL 1 JULY 15), BERRY (JULY 16 AUGUST 31) BEAR FEEDING SEASONS IN WHITEHORSE, YUKON. POST-BERRY SEASON (SEPTEMBER 1 NOVEMBER 30) HAD THE SAME RESULT AS PRE-BERRY SEASON. 54 8
9 FIGURE 25. PORTER CREEK SCHOOL BEAR HAZARD ASSESSMENT. FROM LEFT TO RIGHT ARE ASSESSMENTS FOR PRE-BERRY (APRIL 1 JULY 15), BERRY (JULY 16 AUGUST 31) BEAR FEEDING SEASONS IN WHITEHORSE, YUKON. POST-BERRY SEASON (SEPTEMBER 1 NOVEMBER 30) HAD THE SAME RESULT AS PRE-BERRY SEASON. 54 FIGURE 26. HIDDEN VALLEY SCHOOL BEAR HAZARD ASSESSMENT. FROM LEFT TO RIGHT ARE ASSESSMENTS FOR PRE-BERRY (APRIL 1 JULY 15), BERRY (JULY 16 AUGUST 31) BEAR FEEDING SEASONS IN WHITEHORSE, YUKON. POST-BERRY SEASON (SEPTEMBER 1 NOVEMBER 30) HAD THE SAME RESULT AS PRE-BERRY SEASON. 55 FIGURE 27. TAKHINI ELEMENTARY SCHOOL BEAR HAZARD ASSESSMENT. FROM LEFT TO RIGHT ARE ASSESSMENTS FOR PRE-BERRY (APRIL 1 JULY 15), BERRY (JULY 16 AUGUST 31) BEAR FEEDING SEASONS IN WHITEHORSE, YUKON. POST-BERRY SEASON (SEPTEMBER 1 NOVEMBER 30) HAD THE SAME RESULT AS PRE-BERRY SEASON. 55 FIGURE 28. COPPER RIDGE TRAIL BEAR HAZARD ASSESSMENT. FROM LEFT TO RIGHT ARE ASSESSMENTS FOR PRE-BERRY (APRIL 1 JULY 15), BERRY (JULY 16 AUGUST 31) BEAR FEEDING SEASONS IN WHITEHORSE, YUKON. POST-BERRY SEASON (SEPTEMBER 1 NOVEMBER 30) HAD THE SAME RESULT AS PRE-BERRY SEASON. 57 FIGURE 29. ESCARPMENT TRAIL BEAR HAZARD ASSESSMENT. FROM LEFT TO RIGHT ARE ASSESSMENTS FOR PRE-BERRY (APRIL 1 JULY 15), BERRY (JULY 16 AUGUST 31) BEAR FEEDING SEASONS AND POST-BERRY SEASON (SEPTEMBER 1 NOVEMBER 30) IN WHITEHORSE, YUKON, FIGURE 30. YUKON COLLEGE TRAIL BEAR HAZARD ASSESSMENT. FROM LEFT TO RIGHT ARE ASSESSMENTS FOR PRE-BERRY (APRIL 1 JULY 15), BERRY (JULY 16 AUGUST 31) BEAR FEEDING SEASONS AND POST-BERRY SEASON (SEPTEMBER 1 NOVEMBER 30) IN WHITEHORSE, YUKON, FIGURE 31. MILLENNIUM TRAIL BEAR HAZARD ASSESSMENT. FROM LEFT TO RIGHT ARE ASSESSMENTS FOR PRE-BERRY (APRIL 1 JULY 15), BERRY (JULY 16 AUGUST 31) BEAR FEEDING SEASONS IN WHITEHORSE, YUKON. POST-BERRY SEASON (SEPTEMBER 1 NOVEMBER 30) HAD THE SAME RESULT AS PRE-BERRY SEASON. 58 FIGURE 32. IS HUMAN-BEAR CONFLICT IN WHITEHORSE A SIGNIFICANT ISSUE (QUESTION 1)? 62 FIGURE 35. WHICH POTENTIAL RECYCLING AND COMPOST MANAGEMENT SYSTEMS WOULD YOU LIKE TO SEE IN PLACE (QUESTION 6)? 63 FIGURE 36. HOW WOULD YOU LIKE TO SEE BIRD FEEDERS MANAGED IN YOUR NEIGHBORHOOD (QUESTION 7)? 64 FIGURE 37. HOW WOULD YOU LIKE TO SEE FRUIT TREES MANAGED IN YOUR NEIGHBORHOOD (QUESTION 8)? 64 FIGURE 38. DO YOU SUPPORT EDIBLE LANDSCAPING IN THE CITY OF WHITEHORSE (QUESTION 9)? 65 FIGURE 39. WHICH INITIATIVES TO MANAGE AGRICULTURAL ATTRACTANTS WOULD YOU SUPPORT (QUESTION 10)? 65 FIGURE 40. OVERALL HAZARD RANKINGS FOR WHITEHORSE, YUKON SUBDIVISIONS, HIGHEST HAZARD SUBDIVISIONS SCORED BETWEEN 6 AND 8, HIGH MODERATE SUBDIVISIONS SCORED BETWEEN 4 AND 6, LOW MODERATE SUBDIVISIONS SCORED BETWEEN 2 AND 4, AND LOWEST HAZARD SUBDIVISIONS SCORED UNDER 2 ON A 10-POINT HAZARD RANKING SCALE. 67 FIGURE 41. OVERALL HAZARD RANKINGS FOR WHITEHORSE, YUKON CAMPGROUNDS HIGHEST HAZARD CAMPGROUNDS SCORED BETWEEN 6.25 AND 7, HIGH MODERATE CAMPGROUNDS SCORED BETWEEN 5.5 AND 6.25, LOW MODERATE CAMPGROUNDS SCORED BETWEEN 4.75 AND 5.5, AND LOWEST HAZARD CAMPGROUNDS SCORED BETWEEN 4 AND 4.75 ON A 10-POINT HAZARD RANKING SCALE. 69 9
10 FIGURE 42. OVERALL HAZARD RANKINGS FOR A SAMPLE OF WHITEHORSE, YUKON SCHOOLS, HIGHEST HAZARD SCHOOLS SCORED BETWEEN 8.25 AND 9, HIGH MODERATE SCHOOLS SCORED BETWEEN 7.5 AND 8.25, LOW MODERATE SCHOOLS SCORED BETWEEN 6.75 AND 7.5, AND LOWEST HAZARD SCHOOLS SCORED BETWEEN 6 AND 6.75 ON A 10-POINT HAZARD RANKING SCALE. 70 FIGURE 43. OVERALL HAZARD RANKINGS FOR A SAMPLE OF WHITEHORSE, YUKON PLAYGROUNDS, HIGHEST HAZARD PLAYGROUNDS SCORED BETWEEN 5.75 AND 7, HIGH MODERATE PLAYGROUNDS SCORED BETWEEN 4.5 AND 5.75, LOW MODERATE PLAYGROUNDS SCORED BETWEEN 3.25 AND 4.5, AND LOWEST HAZARD PLAYGROUNDS SCORED BETWEEN 2 AND 3.25 ON A 10-POINT HAZARD RANKING SCALE. 70 LIST OF TABLES TABLE 1. SUMMARY OF BEAR SPECIES REPORTED WITHIN THE CITY OF WHITEHORSE, YUKON FROM TABLE 2. BLACK BEAR MORTALITIES BY COHORT IN WHITEHORSE, YUKON, (SOURCE: YG DATABASE) TABLE 3. FREQUENCY OF GRIZZLY BEAR AND BLACK BEAR OCCURRENCES BY NEIGHBORHOOD IN WHITEHORSE, YUKON, (TIPPLINE DATA ONLY) TABLE 4. RATE OF USER ERROR FOR BEAR-RESISTANT TOTES DURING ATTRACTANT AUDITS IN WHITEHORSE, YUKON, TABLE 5. SUMMARY OF WHITEHORSE, YUKON CAMPGROUND AUDITS, ATTRACTANTS WERE COUNTED IF THEY WERE LEFT AT THE SITE UNATTENDED TABLE 6. NON-NATURAL ATTRACTANTS SURVEY RESULTS AT 7 SCHOOLS IN WHITEHORSE, YUKON, TABLE 7. BEAR-RESISTANT GARBAGE BIN AUDIT AT 13 PLAYGROUNDS IN WHITEHORSE, YUKON, TABLE 8. EDUCATION AND GARBAGE FACILITIES AT TRAILHEADS IN RECREATION AREAS IN WHITEHORSE, YT, TABLE 9. CONDOMINIUM COMPLEX GARBAGE BIN AUDIT IN WHITEHORSE, YUKON, TABLE 10. PUBLIC PEDESTRIAN BIN GARBAGE BIN AUDIT IN WHITEHORSE, YUKON, TABLE 11. SUMMARY OF GENERAL PUBLIC SUPPORT FOR POTENTIAL RECOMMENDATIONS TO REDUCE HUMAN-BEAR CONFLICT IN WHITEHORSE, YUKON TABLE 12. SUMMARY OF KWANLIN DÜN FIRST NATION SUPPORT FOR POTENTIAL RECOMMENDATIONS TO REDUCE HUMAN-BEAR CONFLICT IN WHITEHORSE, YUKON TABLE 13. PRO S AND CONS OF BEAR RESISTANT WASTE MANAGEMENT SOLUTIONS AVAILABLE LIST OF MAPS MAP 1. CITY OF WHITEHORSE AERIAL PHOTO. STUDY AREA IS BOUNDED BY THE CITY LIMITS (BLACK LINE) MAP 2. OCCURRENCE REPORTS COMPILED FROM YG DATASET AND TIPPLINE REPORTS FROM , COLORED BY OCCURRENCE TYPE MAP 3. PRE-BERRY FEEDING SEASON HABITAT QUALITY BASED ON ECOSYSTEM MAP (APPLIED ECOSYSTEM MANAGEMENT LTD. 2000) RATINGS IN WHITEHORSE, YUKON MAP 4. BERRY FEEDING SEASON HABITAT QUALITY BASED ON ECOSYSTEM MAP (APPLIED ECOSYSTEM MANAGEMENT LTD. 2000) RATINGS IN WHITEHORSE, YUKON
11 MAP 5. POST-BERRY FEEDING SEASON HABITAT QUALITY BASED ON ECOSYSTEM MAP (APPLIED ECOSYSTEM MANAGEMENT LTD. 2000) RATINGS IN WHITEHORSE, YUKON MAP 6. RADIO-COLLARED GRIZZLY BEAR LOCATIONS IN AND NEAR WHITEHORSE, YUKON FROM THE SOUTHERN LAKES GRIZZLY BEAR PROJECT ( ) MAP 7. BEAR SIGHTINGS AND BEAR TRAVEL CORRIDORS FROM PUBLIC INPUT SESSIONS IN WHITEHORSE, YUKON, JULY AUGUST MAP 8. SUBDIVISIONS IN WHITEHORSE, YUKON, RANKED ACCORDING TO OVERALL BEAR HAZARD SCORE, LIST OF PHOTOS PHOTO 1. SHEPHERDIA CANADENSIS BERRIES ALONG A TRAIL IN DOWNTOWN WHITEHORSE, NEAR THE ESCARPMENT. JULY 27, PHOTO 2. OVERFILLED GARBAGE BIN ACCESSED BY WILDLIFE (BIRDS) AND INAPPROPRIATE USE OF CURBSIDE GARBAGE TOTES IN WHITEHORSE, YUKON, PHOTO 3. A CAMPSITE IN ROBERT SERVICE CAMPGROUND WITH UNSECURED ATTRACTANTS LEFT UNATTENDED PHOTO 4. NON BEAR-RESISTANT GARBAGE BINS AT ROBERT SERVICE CAMPGROUND PHOTO 5. A TRAIL IN PORTER CREEK SUBDIVISION WITH HIGH SIGHTLINES
12 INTRODUCTION Conflicts between humans and bears are increasing worldwide, contributing to declines in local populations of species (Can et al. 2013). Across North America wildlife was historically managed using bounties, over-hunting and over-trapping. Predators were particularly targeted in many areas as they were viewed as either dangerous to life and property, or as competition for resources (e.g. moose/wild game). The Yukon Territory was no different; however, without the high human population density to completely wipe out large predators that were extirpated in much the south, Yukon maintains its historic complement of predators. While predator control is no longer as widespread and unrestricted as it once was, killing (or removing by relocation) predators is still a common wildlife management tool. Whether undertaken by wildlife managers or property owners, the effects of predator control on local bear populations can be devastating if not carefully monitored and managed. Bears have a slow reproductive rate: black bears give birth to (on average) two to three cubs every two years starting around age four (Czetwertynski, 2007) and grizzly bears give birth to (on average) two cubs every three years, starting around age eight (McCann, 1998). This means that it is more difficult, and can take more time, for bears to repopulate an area when their population is depressed, when compared with other, faster-reproducing species. Unlike coastal areas of neighboring British Columbia, where black bear populations can approximate 1 bear/km 2 (Appleton 2006), Yukon s short growing season and dry habitat does not allow for a dense bear population. Black bears numbers are estimated at a little under 25 bears/1000 km 2 and grizzly bears are estimated at approximately 5-22 bears/1000 km 2 (Smith and Osmond-Jones 1990). Wildlife managers have been shifting policies in attempts to reduce human-wildlife conflict from reactive measures to proactive measures. Proactive measures, such as increasing emphasis on education, enforcement, and prevention of conflict have allowed threatened and endangered bear populations in various locations North America to begin to recover (e.g. Alberta ESRD 2013, U.S. Fish and Wildlife Service 2015, New Jersey Division of Wildlife 2015). Bear population recovery can lead to increased conflict with humans; however, wildlife managers are creating programs to help prevent human-bear conflict. One such program is the assessment of hazards to bears and public safety within a community, which is used to take steps to address hazards and move forward with pro-active bear management. The Whitehorse Bear Working Group (a group comprising Wild Wise Yukon, The City of Whitehorse, and the Yukon Government), contracted Wind River Bear Institute, Canada (Wind River Consulting) to conduct a bear hazard assessment of the City of Whitehorse in the summer of The goals of the Wind River Bear 12
13 Institute are to reduce human-caused bear mortality, which we accomplish through social programs (including bear hazard assessments) and biological programs (including Bear Shepherding programs). OBJECTIVES OF BEAR HAZARD ASSESSMENTS For the purpose of this hazard assessment, a hazard is defined as any risk of injury or property damage to humans, and/or any risk of injury or death to a bear. Bear hazard assessments are used to provide a community or organization professional advice and direction to identify, rank, prioritize and mitigate causes of bear hazards (human-bear conflict) in their area. Human-bear conflict can increase risks to human safety, and can be a significant source of mortality for bears, which is problematic in declining or threatened populations. A bear hazard assessment is the first step of the multi-step process formally identified in British Columbia for a community seeking Bear Smart status, which involves the following: 1. Conduct a bear hazard assessment 2. Write a human-bear conflict management plan 3. Implement an education program 4. Implement a bear-proof waste management system 5. Implement and enforce Bear Smart bylaws 6. Revise Official Community Plan documents to be consistent with the Management Plan The goals of a bear hazard assessment are to Identify sites, areas, trails, and practices that have historic, existing, and potential human-bear conflict; Identify knowledge gaps of bear use and human-bear conflict in the area Provide recommendations for further investigation, and additional hazard assessment phases; and Produce management recommendations to reduce existing and potential conflict within the community (Davis et al. 2002). Bear hazard assessments should be repeated or updated as knowledge gaps are filled, as the community implements recommended changes, and as standards of practice change. The community stakeholders should also implement a monitoring system to gauge progress in measures of success. Measures of success include: A trend toward a decrease in the presence of non-natural foods available to bears, 13
14 Decreases in the number of; o Human-bear conflicts reported to the C.O.S., o Bears destroyed by the C.O.S., RCMP, and individuals, o Bears translocated. Decreases in property damage, and Decreases in resources expended in dealing with human-bear conflicts. Success will most likely be achieved if local community members champion a recommendation and obtain community support to see the recommendation through when possible. STUDY AREA The original inhabitants of the Whitehorse area were the Tagish Kwan, who are linguistically affiliated with the Southern Tutchone, and include Southern Tutchone people, Tagish people, and Tlingit people. Kwanlin, which means running water through canyon in Southern Tutchone, is what the indigenous inhabitants of the area called Miles Canyon, the Yukon River s famous rapids. It was an area people used for hunting and fishing for hundreds, if not thousands, of years. Today, the Kwanlin Dün, and the Ta an Kwäch än First Nations, both Southern Tutchone people, inhabit the Whitehorse area. In 1896, prospectors in the Klondike region east of Dawson City, Yukon, discovered gold, and approximately 10,000 people migrated to the area seeking gold, passing through Whitehorse on the way. Paddle-wheelers transporting people on the Yukon River could only travel as far as the rapids south of the city, in Miles Canyon. A permanent settlement was established, as the area became a natural stopping point at the dangerous rapids. The gold rush ended in 1899 when gold was discovered in Alaska. Whitehorse subsequently experienced a brief copper boom, and played a significant role linking the north and south travel routes during World War II. The city is, in modern times, a popular tourism destination, and is still a stopover point for people traveling to and from Alaska. ( Whitehorse has a population of just fewer than 28,000 people (Yukon Bureau of Statistics Population Report 2013) and is located at km 1426 on the Alaska Highway in the Southern Lakes region of the Yukon Territory. Whitehorse is in the Cordilleran climate region, the Complex Soils of Mountain Areas soil region, the Cordilleran vegetation region, and the Boreal Cordillera ecozone, Yukon Southern Lakes Ecoregion. At 60, 22 N, the city has a subarctic climate with an average annual temperature of -0.1 C. Summer days have 20 hours of daylight near the solstice, and average daily temperatures around 20 C. Lying in the rain shadow of 14
15 the Coast Mountains, the area is relatively dry, receiving on average 145 cm of precipitation in the form of snow and 163 mm of precipitation in the form of rain (Environment Canada 2010). White Spruce (Picea glauca) and Subalpine Fir (Abies lasiocarpa) dominate the forest cover; with Trembling Aspen (Populous tremuloides) and Lodgepole Pine (Pinus contorta) appear in varying amounts throughout the lower elevations. Higher elevations contain Subalpine Fir in a krumholz (stunted) form. Alpine vegetation is sparse, with mosses, lichens and herbs; most of the alpine consists of rock and ice (Ecological Framework of Canada). The Whitehorse Bear Hazard Assessment was generally confined to Whitehorse city limits (Map 1). This is a large area that includes urban residential, rural residential, commercial, industrial and green space recreational uses. Many areas outside of human developments are natural and undisturbed, or contain networks of trails. Map 1. City of Whitehorse aerial photo. Study area is bounded by the city limits (black line). 15
16 METHODS DATA COLLECTION Human-bear conflict in a community can be influenced by many factors, including the quality of bear habitat in and adjacent to developments, availability of nonnatural food (e.g. garbage, recycling, bird feeders, pet food, etc.) and history of conflict in the study area. We compiled data from the Yukon Territorial Government (YG) (Occurrence &TIPP Line reports), information from public input sessions, habitat mapping data, information collected during extensive interview sessions and data collected in the field from July to August 2015 (Field data). Occurrence & TIPP line reports YG uses two methods to collect data internally: YG data and the Turn in Poachers and Polluters (TIPP) hotline. When members of the public call the TIPP line to report a human-bear conflict, the report is recorded as an encounter/sighting, an incident (actual conflict, e.g. bear accessing garbage), a mortality (bear is removed either by relocation or death), or other. YG hunting harvest data is also collected, including the harvest location. Conservation Officers respond to reports and record encounters, incidents, mortalities, harvests and the probably cause of the conflict if it can be ascertained. Consistency of these reports, however, varies by officer. Reports are compiled in a YG database. Habitat Mapping Applied Ecosystem (2000) supplied the habitat mapping data. This project mapped wildlife habitat in the Whitehorse area in 1999 at a scale of 1:20,000, and described the different ecosystem types based on soil and vegetation cover in field samples. The Southern Lakes Grizzly Bear Project has radio-collared a number of bears using the Whitehorse area. Some of this data, when bears were in close proximity to the City, were used to illustrate how grizzly bears use the area. Field Data To assess the risk of conflict and prescribe mitigation measures, we identified areas within the city where high quality bear habitat overlaps with areas where high levels of non-natural food occur. To accomplish this assessment effectively, we employed different methods of data collection for different development types within Whitehorse. We categorized development types according to common characteristics in the following ways: 16
17 Urban residential Rural residential Urban commercial Industrial areas Trailer parks Campgrounds and RV parks Schools Playgrounds Trails City parks and recreation areas Additional audits For each development type, similar methods were used, with adjustments to account for inherent differences between development types. Field efforts were concentrated on collecting data to detail availability of non-natural attractants and quality of surrounding bear habitat. The goal was to compare each subdivision or development type assessed, with others of the same type, and to rank them from highest to lowest risk of hazard. The goal was to reveal common concerns for each subdivision or development type (listed above) and to highlight which areas within groups are currently experiencing, or are more likely to experience higher conflict with bears in the future. Urban residential All urban residential neighborhoods in Whitehorse were surveyed, including: Hillcrest, Logan, Arkell, Ingram, Copper Ridge, Granger, MacIntyre, Downtown, Takhini, Riverdale, Porter Creek, Crestview, Crow and Swan, and Whistle Bend. In each subdivision, we conducted a garbage audit, a general attractant audit, and assessed playgrounds and schools. We discuss playgrounds and schools separately in this document. Garbage audits began between 21:00 and midnight, and consisted of a count of the number of garbage totes placed curbside before the garbage pickup day. A minimum of 300 residences were surveyed in larger subdivisions, a minimum of 200 residences in medium-sized subdivisions (e.g. Granger), and a minimum of 100 residences in small subdivisions (e.g. Logan, Ingram). If a subdivision contained fewer than 100 residences, every residence was surveyed. The City provides each residence with a black garbage tote and a green compost tote, each of which are picked up bi-monthly from the curb. 17
18 A general attractant audit was conducted in each subdivision to assess the number of non-natural attractants constantly available to wildlife. Only non-natural attractants visible from the street without entering private property were counted and auditors did not record resident addresses. The same number of total residences was surveyed as for the garbage audits. Non-natural attractants included unsecured garbage, recycling, compost, bird feeders, pet food, fruit trees, mountain ash trees and barbeques. Coolers, pet food, and petroleum products were categorized under other. If a garbage tote was visible, it was counted that garbage as available, despite not being able to confirm whether the bin contained garbage at that moment. This was done because residents were often observed putting bags of garbage into garbage totes outside homes between pickup days. Even if garbage totes are empty, they are likely both an olfactory attractant and a visual attractant to food-conditioned bears. Compost was recorded in the same way as garbage; if the tote was visible from the street it was counted as an available attractant. All barbeques were counted as available attractants despite not knowing if residents had emptied the grease traps or burnt off their grills. Bears are not currently targeting mountain ash berries in Whitehorse (Ramona Maraj, Yukon carnivore biologist, personal communication, July 22, 2015), but mountain ash berries are a preferred food source for black bears where the plant occurs in the wild naturally and can be a source of human-bear conflict in urban areas (Homstol et al. 2006). Therefore, mountain ash berries were included in our assessment as a potential future source of human-bear conflict in Whitehorse. Rural Residential All rural residential neighborhoods were surveyed for non-natural attractants and public opinion of conflict history. Because community members in rural residential areas of Whitehorse are responsible for their own garbage disposal (to the landfill), garbage tote audits were not conducted. Only general attractant audits were conducted in these areas. As rural residences are less visible from the road, residents were contacted by door-to-door canvasses, speaking with them directly about attractants on their property and history of human-bear conflict both on their property and in the neighborhood. In each rural residential area, ten houses were surveyed for non-natural attractants, using the same methodology as for urban residential areas, with the exception of Wolf Creek, where 20 homes were surveyed due to the subdivision s larger size. Urban Commercial An attractant audit was conducted on ten businesses in the urban commercial core (Downtown) by assessing how various commercial operators stored garbage, recycling, compost and restaurant grease. 18
19 Industrial Areas Fifteen residences were surveyed in four Whitehorse industrial areas (Kulan, MacRae, Marwell, and Mt. Sima). In each area, general attractant audits were conducted as per the methodology for residential areas; however, petroleum products were also counted, because industrial areas are more likely than residential areas to have large amounts of unsecured petroleum products, which bears often find attractive. Trailer Parks All five trailer parks within the city of Whitehorse were surveyed. In each area an attractant audit was conducted on 50 residences (same methodology as the residential area attractant audits). Three of the trailer parks (Lobird, Northlands Park, and Mountain View) provide a central bin or bins for garbage and/or recycling, and the other two (Range Road trailer park and Kopper King) require residents to manage their own waste. General attractant audits were conducted at all the trailer parks, where unsecured garbage, recycling, compost, bird feeders, pet food, fruit trees, mountain ash trees and barbeques were recorded. Campgrounds and RV Parks Campground and RV Parks were assessed through attractant audits on a site-by-site basis, and by recording general non-natural attractants available at the campground. A ground survey of natural attractants and sight lines around the perimeter of the campground was also conducted. Natural attractants can attract bears into closer proximity to humans, which increases the risk of an encounter and subsequent conflict. Sight lines (how far a person can see into the forest) influence both a bear and a person s ability to detect the other; areas with higher sight lines allow for greater visibility and can help avoid surprise encounters. Non-Natural Attractants Since most people in RV Parks and campgrounds are visitors unfamiliar with the area and potentially unfamiliar with camping in bear country, campgrounds and RV Parks were assessed by how they conducted visitor education (signage, speaking to them at check-in), how they managed general attractants onsite (central garbage, recycling and other non-natural attractants), and the nature of any human-bear conflict issues experienced in the recent past. A general attractant audit, (similar to audits conducted in residential areas), was conducted, surveying between 13 and 66 campsites, depending on the size of the campground and the number of campers onsite. Natural attractants To assess natural attractants (bear food) and sight lines surrounding campgrounds, the perimeter was walked; rangefinder measurements of sight lines recorded, and the relative abundance of common bear foods assessed (for both black bears and 19
20 grizzly bears), whenever the vegetation appeared to change. Three sightlines in each zone were recorded, which were averaged to get a sightline for that particular zone. For the assessment of natural attractants (bear food) in each zone, a representative 10m 2 plot was used to estimate the percentage of ground cover in the plot each bear food plant occupied. Schools We assessed schools by noting availability of non-natural attractants, natural attractants, sightlines and proximity to green space. We recorded central garbage storage, recycling storage and pedestrian garbage bins in schoolyards. The same methodology was used to assess bear food and sight lines as in Campgrounds and RV Parks. Playgrounds Playgrounds were assessed using the same methodology as used for schools, recording availability of non-natural attractants in pedestrian garbage bins and employing the same methodology for assessment of natural attractants and sight lines. Trails Whitehorse has an extensive trail system through urban and residential green spaces, popular with both residents and visitors. Four trails were sampled based on proximity to previous reported human-bear conflict. Trails were assessed by walking the entire length and recording sightline visibility, (using a range finder) up and down the trail and perpendicular to the trail on both sides. Sightline measurements were recorded and relative bear food abundance estimated in each zone (obvious change in vegetation along the trail as we walked), using the same methodology as in Campgrounds and RV Parks. City Parks and Recreation areas Parks and recreation areas are likely to receive high visitor use, making educational effort (e.g. signage) important, as recreational areas are not manned the way campgrounds and RV Parks are. We recorded whether major recreational areas had any educational signage, or bear-resistant garbage and/or recycling bins at trailheads. Additional audits Pedestrian garbage bins located around the city were checked to determine if they were bear-resistant. Twenty-one condominium complexes were also audited to check their garbage and recycling systems. 20
21 Public Input We held two open house drop-in presentations, at the Whitehorse public library over approximately four hours, on July 30 and July 31. Each session consisted of quick surveys to gauge level of public support for potential recommendations that have been implemented in other Management areas in North America. Recommendations ranged from bear-resistant garbage disposal systems to bylaws, and partnerships for electric fence cost-sharing or other programs designed to reduce the availability of non-natural attractants to bears. Attendees drew on maps to record previous sightings and conflicts they experienced within the city limits. Wild Wise Yukon advertised the events on social media, using flyers, and in a radio interview on CBC. Identical posters were displayed at the Canada Games Center, the Kwanlin Dün office, and at the Ta an First Nation office, which were open for feedback for several weeks. In addition to the public information sessions, an online public opinion poll was circulated for three weeks (Survey Monkey). Twenty-eight participants answered 10 questions to determine management options the public might support in order to reduce human-bear conflict. Extensive interviews were conducted with numerous City of Whitehorse employees, Yukon Government employees, First Nation representatives, and local nongovernmental organizations. A list of those interviewed is provided in Appendix I. 21
22 DATA ANALYSIS Occurrence & TIPP line reports YG provided historical grizzly and black bear occurrence reports for the City of Whitehorse from two key sources: the Yukon Government Microsoft Access Database of wildlife occurrences, and the TIPP line. The YG database included historical grizzly and black bear occurrences up to, and including the year All grizzly and black bear reports from within the YG occurrence database after the electric fencing of the landfill in 1997 (with locational data) were identified and mapped using ArcMap and occurrences (n=86) which took place within or near the City of Whitehorse were selected for analysis. There were not enough occurrence reports with locational information from prior to the fencing of the Whitehorse Landfill site to allow assessment of pre- and post- mitigation changes. AllSmith Overland provided GIS support and encounter and sighting data from the TIPP line, which included 243 sightings and encounters from the Whitehorse area from In 2012 there was some overlap between the TIPP and YG database, encounters reported in both systems were cross-referenced to ensure that they were not duplicates. It was expected, however, that these reports likely involve many of the same individual bears. Reports from the YG and TIPP line were merged into one Statistical Package for the Social Sciences (SPSS Version 21) database for analysis. We summarized data to get information on where and when conflicts occur (by year, and by season), and the probable source of the conflict. In some cases we lumped the data from both sources together, cross-referenced them to ensure there was no duplication, but in other cases we separated the data out by source. To avoid confusion, we specify which data source we used in the Results section. Habitat Mapping Ecosystem types were ranked and mapped into feeding seasons of pre-berry (April 1 July 15), berry (July 16 August 31), and post-berry (September 1 November 30). The ecosystem descriptions used were from the Ecosystem Map created by Applied Ecosystem Management Ltd. (2000) to define feeding seasons. It is important to note that the scale of this map is 1:20,000; small patches of habitat (along with road and trail-side vegetation) may be overlooked due to the coarseness of the map scale. Zones were ranked by their importance to both black bears and grizzly bears based on the vegetation description of ecosystem type. We crossreferenced some of the more important ecosystem types with high quality habitat areas surveyed in the field to ensure accurate interpretations of habitat quality. 22
23 Field Data Data collected throughout the city was analyzed by Subdivision type or development type in similar ways. Saturation of attractants Saturation of attractants was calculated for all areas where attractant audits were conducted (urban residential, rural residential, industrial areas, trailer parks, and campgrounds and RV parks). Saturation of attractants in an area (or number of attractants per residence) was calculated by adding total number of attractants counted during the attractant audit in each subdivision or development type and dividing that number by the total number of residences surveyed. Value of non-natural attractants at residences All areas where attractant audits were conducted, (urban residential, rural residential, industrial areas, trailer parks, and campgrounds and RV parks), also had potential value of non-natural attractants ranked. Each non-natural attractant was ranked by assigning it a score based on its level of attractiveness to bears and subsequent potential threat to human safety. If a bear would likely defend an attractant from humans present in its vicinity (threat to human safety), or if a bear would likely attempt to repeatedly access the attractant (and therefore more likely to be re-located or destroyed), we rated the attractant in the high category. If the item was either something a bear might defend, or a threat to bear s life for repeatedly accessing it, but not both, we rated it as moderate. Highly attractive items included pet food, garbage, recycling and compost (in urban residential areas); moderately attractive items included fruit trees and compost (rural residential areas). Compost was rated higher in attractiveness in urban residential areas because it is not actually composting, but is the organic food waste of garbage and therefore the most attractive part of garbage. Less attractive items included barbeques and mountain ash. Natural Habitat Assessments When surveying smaller sites such as the campgrounds and RV parks, schools, playgrounds and trails, the scale of Ecological mapping data available (Applied Ecosystems Ltd. 2000, 1:20,000) was too coarse to accurately describe the site. In these cases natural habitat assessments were conducted including sight line measurements and natural attractant (bear food) plots. Sightlines To assess how visible bears and people are to each other in a forested area, sightlines surrounding a site were measured, by zone, as described in the data collection of natural attractants section. Sightlines were ranked high (>50 m), 23
24 moderate (25 50 m) or low (<25 m). The zones surrounding each campground, school, playground and trail were then mapped to illustrate the highest risks zones. Natural attractants To assess natural attractants at a scale smaller than the habitat mapping could provide, common bear foods were categorized and ranked by importance to bears, season in which bears target them (pre-berry, berry and post-berry) and by relative attractiveness to bears (low, moderate or high) in all of the areas where natural habitat assessments were conducted, (campgrounds and RV parks, schools, playgrounds and trails). Assessment was based on professional opinion of the authors and Sandra MacDougall, in consultation with the Territorial carnivore biologist, Dr. Ramona Maraj. Bear foods included in each category were categorized as follows: Pre-berry Season (April 1 July 15) High Hedysarum alpinum (bear root) Oxytropis campestrus (locoweed) Equesetum arvense (horsetail) Taraxacum officionale (dandelion) Moderate Trifolium pratense (clover) Arctostaphylus uva-ursi (Kinnickinnick/bear berry) Berry Season (July 16 August 31) High Shepherdia canadensis (soapberry), Empetrum nigrum (crowberry) Moderate Rosa acicularis (wild rose) Low Viburnum edule (cranberry) Post-berry Season (September 1 November 30) High Hedysarum alpinum (bear root) Moderate Empetrum nigrum (crowberry) Viburnum edule (cranberry) Low Taraxacum officionale (dandelion) Percentage cover of high value bear foods in each season was used to create a map of hazard zones surrounding the area we were assessing. We used this methodology for campgrounds and RV parks, schools, playgrounds and trails. Public Input Public input data, including the Survey Monkey poll, were summarized by transcribing reports of sightings and travel corridors from public events and poster demonstrations at the Kwanlin Dün First Nation office and the Canada Games Center onto an aerial photo. Each potential recommendation was listed in a table and indicates the level of public support. 24
25 Hazard Rankings Hazard rankings help to obtain within-group comparisons in order to prioritize mitigation strategies. All data collected in the field was compiled into a hazard ranking score, in order to compare areas by type. Subdivisions Each subdivision was ranked out of a top score of 10. Scores were calculated based on four categories: whether the area bordered a green space, availability of nonnatural attractants, quality of bear habitat surrounding the subdivision, and previous occurrences in the area. Subdivisions that border green spaces automatically scored 1, due to increased likelihood of a bear traveling adjacent to the area, the other three categories were scored out of 3. TIPP line reports were recorded by subdivision between 2012 and The percentage of occurrences from the TIPP line was converted to a score out of 3, where the highest score equaled 3, remaining subdivisions scored reflectively. Nonnatural attractants were ranked by calculating the percentage of high value attractants counted in the total number of residences surveyed. That percentage was multiplied by the saturation score (number of attractants per house), to give a total score out of 300 (which was converted to a score out of 3). Quality of bear habitat was ranked by assigning the Ecosystem Map (Applied Ecosystem Management Ltd. 2000) in each food season (pre-berry, berry and postberry) a score out of one. Any high quality habitat types in each season scored 1, and moderate habitat types scored 0.5. Ranking habitat quality of the Ecosystem Map (Applied Ecosystem Management Ltd. 2000) polygons was based on professional opinion, and cross-references of our notes on high quality bear habitat in locations surveyed while in the field. The three seasonal scores out of 1 were added together to get a habitat quality score out of 3. These scores were added together for an overall hazard ranking out of 10. Each score was categorized as highest hazard if it fell in the top quarter of scores in the group, as lowest if it fell in the bottom quarter of scores in the group, and as either high or low moderate if it fell in the middle. Categorizing in this way enabled comparison between subdivisions. Non-natural attractants + bear habitat + green space + conflict history = 10 (3) (3) (3) (1) 25
26 While schools, playgrounds and campgrounds were all ranked on a ten point scale in a similar fashion, the scale is not meant to allow comparisons from one group (e.g. subdivisions) to another (e.g. campgrounds) because of inherent differences between groups. Campgrounds and RV Parks Campgrounds and RV Parks were ranked by assigning a score out of 10. This score was broken down into: non-natural attractants (3 points), presence of high quality natural bear food, (3 points), sightlines (3 points) and whether the campground had a human-bear conflict history (1 point). For the non-natural attractant category, the campground scored 1 if it contained a non bear-resistant dumpster, 1 if it contained non bear-resistant pedestrian bear-resistant garbage bins, 0.5 if it contained non bear-resistant recycling, and 0.5 based on attractant saturation and proportion of high value attractants that were left unsecured at campsites. Each site received a score out of one for each feeding season of pre-berry, berry and post-berry for habitat quality based on bear food plots (see Campgrounds, Natural attractants section page 12 for details). If a site contained any zone with 75% high value bear foods in any season, it received a score of 1. If a site contained any zone with 25-75% high quality bear food in any feeding season, it received a score of 0.5. The seasonal scores out of 1 were added together to get a habitat quality score out of 3. Measurements of sightlines in all zones surrounding the site were averaged. If the average sightline for a school was low (under 25 m), that school received a score of 1; moderate sightlines (25 50 m) scored 0.5. If a campground had any previous recorded conflict, it scored 1. Each score was categorized (highest, high moderate, low moderate and lowest) in the same way as for subdivisions, and schools and playgrounds. Non-natural attractants + bear food by season + sightlines + conflict history = 10 (3) (3) (3) (1) Schools Schools received a total score out of 10, based on four categories: availability of nonnatural attractants (3 points), presence of high quality natural bear food (3 points), sightlines (3 points), and whether the school bordered a green space. Availability of non-natural attractants was scored by assigning a score out of 1 for the status of their central garbage bin (bear-resistant = 0, non bear-resistant = 1), pedestrian garbage bins (bear-resistant/total bins), and bear resistant recycling (scored as per the central garbage bin). 26
27 Each school was scored on high quality bear foods and sightlines in the same way as playgrounds and schools were scored above. Each score (highest, high moderate, low moderate and lowest) was categorized in the same way as for subdivisions. Non-natural attractants + bear food by season + sightlines + green space = 10 (3) (3) (3) (1) Playgrounds Playgrounds were scored out of 10 similarly to the methodology used to rank schools. Presence of a non bear-resistant garbage bin scored 1 point. Non-natural attractants + bear food by season + sightlines + green space = 10 (3) (3) (3) (1) Trails Trails were not scored as a ranking system as only four trails out of hundreds of local named and un-named trails were sampled. Of the four trails assessed, the sections between vegetation changes were ranked as high, moderate or low by natural bear food and sightlines. 27
28 OCCURRENCE & TIPPLINE REPORTS RESULTS Black bears comprised 81% (n=265) of the species reported within the YG occurrences database and 15 % (n=48) of the TIPP line database. Grizzly bears comprised 5 % (n=16; Table 1). Table 1. Summary of bear species reported within the City of Whitehorse, Yukon from Species YG TIPP line Total Bear unknown species 12(14%) 36 (15%) 48(15%) Black bear 69 (80%) 196 (81%) 265 (81%) Grizzly bear 5 (6%) 11 (5%) 16 (5%) Total Occurrences (including sightings, encounters, conflicts and mortalities) tend to rise sharply in early April, peak in late May and early June, and stay relatively high until late July, after which occurrences drop sharply until early October (Figure 1). Figure 1. Monthly grizzly bear and black bear occurrences (sightings, encounters, conflicts, and bear mortalities) in Whitehorse, Yukon, (YG occurrences from , TIPP line reports from , n = 328). 28
29 Number of Occurances Whitehorse Bear Hazard Assessment October, 2015 Occurrences rose sharply in 2011 and 2012, especially related to incidents (conflicts with humans; Figure 2). Black bear incidents averaged 7.5/year, with only one grizzly bear incident. In 2011 and 2012 black bear incidents jumped from an average of 2.75 incidents per year from 2006 to 2010 to an average of 17, a 6-fold increase. There was no conflict data recorded in Other Harvest Mortality Incident Encounter Year Figure 2. Occurrence type by year in Whitehorse, Yukon for grizzly bear and black bears. When an individual s sex was known, mortalities more frequently involved a female with offspring than unaccompanied bears (Table 2). Table 2. Black bear mortalities by cohort in Whitehorse, Yukon, (Source: YG database). Cohort Frequency Percent Female with offspring Single bear, sex unknown Single female Single male

30 2 bears, sex unknown Unknown Probable cause of human-bear conflict in Whitehorse was mostly human food and garbage (Figure 3). Although in this data, food-conditioning and bears accessing human food and garbage are recorded separately, they are essentially the same. Together, these conflicts caused nearly twice the number of occurrences as curious bears, bears travelling through an area, and legal harvest combined, (Figure 3, below). Figure 3. Probable cause of human-bear conflict in Whitehorse, Yukon ( ). Not all Whitehorse subdivisions are recognized by the TIPPline system. Of those recorded, the Downtown area reported highest frequency of occurrences, followed 30
31 closely by Copper Ridge. McCrae and Valleyview reported the lowest frequency of occurrences (Table 3). Table 3. Frequency of grizzly bear and black bear occurrences by neighborhood in Whitehorse, Yukon, (TIPPLine data only). Neighborhood Frequency Percent Downtown Copper Ridge Porter Creek Riverdale Granger Mt. Sima Lobird Takhini Mt. View Dr Wolf Creek Canyon Cowley Creek Hillcrest Crestview McIntyre Northland Yukon College Kopper King Hidden Valley Mary Lake Pine Ridge Cousin s Airstrip Logan MacRae Marsh Lake (outside Whitehorse) Unknown Alaska Hwy N Klondike Hwy N McCrae Tagish (outside Whitehorse) Valleyview Total
32 Map 2. Occurrence Reports compiled from YG dataset and TIPPline reports from , colored by occurrence type. 32
. Grizzly bear use of the Whitehorse area is outlined in Map 6. Photo 1.")
33 HABITAT MAPPING Pre-berry and berry feeding seasons provided relatively high quality bear habitat in Whitehorse (Map 3 and Map 4), while post-berry feeding season habitat was less widespread (Map 5). Many of the areas rated high in berry season were dense with highly productive soapberry plants (Photo 1). Grizzly bear use of the Whitehorse area is outlined in Map 6. Photo 1. Shepherdia canadensis berries along a trail in downtown Whitehorse, near the escarpment. July 27,
34 Map 3. Pre-berry feeding season habitat quality based on Ecosystem Map (Applied Ecosystem Management Ltd. 2000) ratings in Whitehorse, Yukon. 34
35 Map 4. Berry feeding season habitat quality based on Ecosystem Map (Applied Ecosystem Management Ltd. 2000) ratings in Whitehorse, Yukon. 35
36 Map 5. Post-berry feeding season habitat quality based on Ecosystem Map (Applied Ecosystem Management Ltd. 2000) ratings in Whitehorse, Yukon. 36

37 Map 6. Radio-collared grizzly bear locations in and near Whitehorse, Yukon from the Southern Lakes Grizzly Bear Project ( ). 37
, followed by urban residential and industrial areas. Campgrounds and trailer parks had the lowest saturation of attractants (Figure 4) 4.5 4.0 3.5 3.0 2.5 2.")
38 Number of Attractants per House Whitehorse Bear Hazard Assessment October, 2015 FIELD DATA Residences in rural residential areas of Whitehorse had the highest saturation of attractants (number of available bear attractants per residence), followed by urban residential and industrial areas. Campgrounds and trailer parks had the lowest saturation of attractants (Figure 4) Rural residential Urban residential Industrial Area Trailer Park Campgrounds Catagory/Development type Figure 4. Number of bear attractants per residence in all area types of Whitehorse, Yukon, The bulk (72%) of citywide attractants are high value attractants to bears (e.g. garbage and recycling; Figure 5). Low value attractants comprised 16% of the total attractants unsecured from bears. 38


.")

39 Mountain Ash, 7% Petroleum products, 1% BBQ's, 8% Legend High value Moderate value Low value Bird Feeders, 4% Garbage, 33% Fruit trees, 8% Other, 7% Recycling, 6% Compost*, 26% Livestock feed, 0% Livestock, 0% Smokehouse, 0% Figure 5. Relative quality of non-natural bear attractants visible from the street at surveyed residences in all area types of Whitehorse, Yukon, Urban residential Saturation of attractants in urban residential areas (average number of attractants per residence) was 2.0 attractants per residence, ranging from a low of 1.2 in Riverdale to a high of 2.7 in Arkell (Figure 6). Attractant audits also revealed large amounts of high value attractants (Figure 7). We noted evidence of inappropriate use of garbage totes (Photo 2.), in particular where bins were overflowing with garbage and had been accessed by wildlife (in this photo example, birds). 39


 and")
40 Number of attractants per House Whitehorse Bear Hazard Assessment October, Subdivision Figure 6. Number of bear attractants per residence in urban residential areas of Whitehorse, Yukon, Photo 2. Overfilled garbage bin accessed by wildlife (birds) and inappropriate use of curbside garbage totes in Whitehorse, Yukon,


41 BBQ's, 6% Bird Feeders, 2% Mountain Ash, 8% Garbage, 35% Fruit trees, 9% Compost*, 31% Figure 7. Relative quality of non-natural bear attractants that were visible from the street in urban residential areas of Whitehorse, Yukon, Curbside garbage tote audit Other, 4% Recycling, 5% Smokehouse, 0% The curbside garbage tote audit revealed that, on average, 35% of households place their garbage or composting totes on the curb the night before their morning pickup. Copper Ridge subdivision had the highest rate of overnight curbside bins at 59%, more than 4 times the number of households leaving garbage totes curbside overnight on the low range of the scale in Granger subdivision (Figure 8). 41
42 Percentage of Garbage Totes Available Whitehorse Bear Hazard Assessment October, Subdivision Figure 8. Curbside garbage tote audit count for the number of garbage bins set out on the street the night before pickup in urban residential subdivisions of Whitehorse, Yukon, Bear-resistant latches on garbage totes were noted in three subdivisions, Granger, Logan and Porter Creek; however, an average of 56% of the bins were not latched, leaving their contents unsecured from bears (Table 4). Table 4. Rate of user error for bear-resistant totes during attractant audits in Whitehorse, Yukon, Subdivision Latched Unlatched Total (bear-resistant) (not bear-resistant) Granger 4 (40%) 6 (60%) 10 Logan 21 (48%) 23 52%) 44 Porter Creek 0 (0%) 1 (100%) 1 42

43 Number of Attractants per House Whitehorse Bear Hazard Assessment October, 2015 Rural Residential Saturation of attractants (average number of attractants per residence) in rural residential areas was higher than urban residential areas with an average of 3.85 attractants per residence. Fox Haven and Cowley Creek had lowest saturation with 2.7 attractants per residence. Canyon Crescent had the highest saturation with 5.2 attractants per residence (Figure 9). While rural residential areas contained fewer high value attractants than urban residential areas (74% vs. 56%), they still contained relatively large amounts of high value attractants overall (Figure 10) Subdivision Figure 9. Number of bear attractants per residence in rural residential areas of Whitehorse, Yukon,


, Cowley Creek (4), Fox Haven (2), Mary Lake (3), Pine Ridge (1),")
 at Canyon Crescent (2), Cowley Creek (1), Mary Lake (2), Spruce Hill (2) and Wolf")

44 Mountain Ash, 3% Bird Feeders, 11 % BBQ's, 15% Fruit trees, 8% Compost*, 7% Garbage, 1 4% Other, 24% Recycling, 8% Livestock, 5% Livestock feed, 5% Figure 10. Relative quality of non-natural bear attractants in rural residential areas of Whitehorse, Yukon, Residents in rural residential subdivisions, were asked about garbage management practices and history of conflict in their areas. Residents reported sightings from Canyon Crescent (2), Cowley Creek (4), Fox Haven (2), Mary Lake (3), Pine Ridge (1), Spruce Hill (4) and Wolf Creek (5). Residents reported incidents (conflicts) at Canyon Crescent (2), Cowley Creek (1), Mary Lake (2), Spruce Hill (2) and Wolf Creek (4). Urban Commercial Ten locations were surveyed downtown for attractants. Of the ten locations we visited, none had bear-resistant garbage bins. Industrial Areas Saturation of attractants in industrial areas (average number of attractants per residence; Figure 11) averaged 1.9 attractants per residence. Mt. Sima had the lowest saturation with 1.4 attractants per residence, and Kulan had the highest saturation with 2.4 attractants per residence (Figure 11). Overall, 62% of attractants noted in industrial areas were of high value to bears (Figure 12). 44


45 Number of Attractants per House Whitehorse Bear Hazard Assessment October, Kulan Industrial MacRae Marwell Mt. Sima Industrial Industrial Area Figure 11. Number of bear attractants per residence visible from the street in Industrial areas of Whitehorse, Yukon, BBQ's, 3% Petroleum products, 22 % Garbage, 40 % Other, 13% Recycling, 22 % Figure 12. Relative quality of non-natural bear attractants visible from the street in Industrial areas in Whitehorse, Yukon,
46 Number of Attractants per House Whitehorse Bear Hazard Assessment October, 2015 Trailer Parks Saturation of attractants (number of bear attractants per residence; Figure 13) in trailer courts in Whitehorse averaged 1.5 attractants per residence, with a low of 0.8 attractants per residence in Mountain View Drive, and a high of 2.5 attractants per residence in the Range Road trailer parks. Of all the types of subdivisions surveyed, trailer parks had the lowest relative amount of high value non-natural attractants in Whitehorse, at 51% (Figure 14) Kopper King Mountain View Place Range Road Trailer Courts Kopper King Lobird Northlands Park Mountain View Place Trailer Park Figure 13. Number of bear attractants per residence visible from the street in trailer parks of Whitehorse, Yukon,


.")
47 BBQ's, 30% Garbage, 25 % Mountain Recycling, 12 Ash, 3% % Bird Feeders, 10 % Fruit Other, 14% trees, 6% Figure 14. Relative quality of non-natural bear attractants visible from the street in trailer parks in Whitehorse, Yukon, Campgrounds and RV Parks All four campgrounds and RV Parks in Whitehorse were surveyed: Pioneer RV Park, Wolf Creek campground, Robert Service Campground, and Hi Country RV Park, auditing both natural and non-natural attractants. Non-natural attractants In each campground, general campground attractants and attractants on a site-bysite basis (Table 5), were assessed. Robert Service and Pioneer RV Park scored just under one unsecured attractant per site, while Hi Country RV Park and Wolf Creek campground had lower levels of unsecured attractants per site with an average 0.3 (Figure 15). High value attractants comprised most (72%) of the attractants left unsecured at campgrounds, and 24% of the attractants were low value (Figure 16). 47
48 Number of Attractants per Site Whitehorse Bear Hazard Assessment October, 2015 Table 5. Summary of Whitehorse, Yukon campground audits, Attractants were counted if they were left at the site unattended. Campground Attractants Bear-resistant Bear-resistant Left onsite Garbage Recycling Hi Country 21/66 0/2 0/1 Pioneer 34/39 0/2 0/2 Robert Service 24/26 0/11 0/1 Wolf Creek 4/13 15/25 1/ Robert Service Campground Pioneer RV Park Hi Country RV Park Wolf Creek Campgrpound Campground/RV Park Figure 15. Number of attractants per site at campgrounds in Whitehorse, Yukon,


49 BBQ's, 18% Garbage, 24% Mountain Ash, 6% Other, 10% Recycling, 14% Food, 28% Figure 16. Relative quality of non-natural bear attractants visible from the street in campgrounds in Whitehorse, Yukon, 2015 Photo 3. A campsite in Robert Service Campground with unsecured attractants left unattended. Photo 4. Non bear-resistant garbage bins at Robert Service campground. 49
, and Wolf Creek campground in pre-berry and berry season (Figure 20) have high levels of high quality bear food around the edge of the campground.")
, berry (July 16 August 31) bear feeding seasons in Whitehorse, Yukon.")
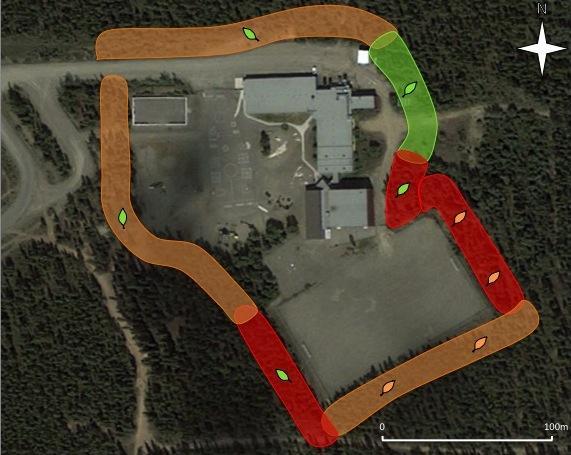
50 Natural attractants Hi Country RV Park (Figure 17) had two zones with low sightlines. Pioneer RV Park in berry season (Figure 18), and Wolf Creek campground in pre-berry and berry season (Figure 20) have high levels of high quality bear food around the edge of the campground. Robert Service campground (Figure 19) had the lowest sightlines. Figure 17. Hi Country RV Park bear hazard assessment. From left to right are assessments for pre-berry (April 1 July 15), berry (July 16 August 31) bear feeding seasons in Whitehorse, Yukon. Post-berry season (September 1 November 30) had the same result as pre-berry season. Figure 18. Pioneer RV Park bear hazard assessment. From left to right are assessments for pre-berry (April 1 July 15), berry (July 16 August 31) bear feeding seasons in Whitehorse, Yukon. Post-berry season (September 1 November 30) had the same result as pre-berry season. 50
 had the same result as pre-berry season. Figure 20. Wolf Creek campground bear hazard assessment.")
 had the same result as pre-berry season.")
51 Figure 19. Robert Service campground bear hazard assessment. From left to right are assessments for pre-berry (April 1 July 15), berry (July 16 August 31) bear feeding seasons in Whitehorse, Yukon. Post-berry season (September 1 November 30) had the same result as pre-berry season. Figure 20. Wolf Creek campground bear hazard assessment. From left to right are assessments for pre-berry (April 1 July 15), berry (July 16 August 31) bear feeding seasons in Whitehorse, Yukon. Post-berry season (September 1 November 30) had the same result as pre-berry season. Schools Seven schools were surveyed (École Émelie Tremblay, Elijah Smith, Golden Horn, Grey Mountain, Porter Creek, Hidden Valley and Takhini Elementary), auditing both non-natural and natural attractants Non-natural attractants Of the seven schools surveyed, only Golden Horn, Porter Creek, and Hidden Valley had any bear-resistant pedestrian bins available on the schoolyard. Most of those bins were not functioning due to removed latches in the handle (Table 6). 51

52 Table 6. Non-natural attractants survey results at 7 schools in Whitehorse, Yukon, School Central bear- Pedestrian bear- Bear-resistant resistant garbage? resistant garbage? Recycling? École Émelie Tremblay No No No Elijah Smith No No No Golden Horn No 1/1 No Grey Mountain No No No Porter Creek No 4/9 No Hidden Valley No No No Takhini Elementary No 1/9 No Natural attractants École Émelie Tremblay in berry season (Figure 21) and Hidden Valley School in berry season (Figure 26) had high hazard zones related to bear habitat quality and sightlines immediately adjacent to the school grounds. Golden Horn school in preberry and berry season (Figure 23) and Grey Mountain School in berry season (Figure 24) had the lowest hazards related to bear habitat quality and sightlines immediately adjacent to the school grounds. Elijah Smith Elementary School (Figure 22) had low sightlines around the entire perimeter of the school, but low value natural food. Porter Creek Elementary (Figure 25) also had low sightlines around significant portions of the schoolyard, and a zone with high levels of soapberry. Takhini Elementary School (Figure 27) had one zone of low sightlines, but no zones containing high natural attractants. 52
, berry (July 16 August 31) bear feeding seasons in Whitehorse, Yukon.")
 had the same result as pre-berry season. Figure 23. Golden Horn School bear hazard assessment.")
53 Figure 21. École Émelie Tremblay School bear hazard assessment. From left to right are assessments for pre-berry (April 1 July 15), berry (July 16 August 31) bear feeding seasons in Whitehorse, Yukon. Post-berry season (September 1 November 30) had the same result as pre-berry season. Figure 22. Elijah Smith School bear hazard assessment. From left to right are assessments for pre-berry (April 1 July 15), berry (July 16 August 31) bear feeding seasons in Whitehorse, Yukon. Post-berry season (September 1 November 30) had the same result as pre-berry season. Figure 23. Golden Horn School bear hazard assessment. From left to right are assessments for pre-berry (April 1 July 15), berry (July 16 August 31) bear feeding seasons in Whitehorse, Yukon. Post-berry season (September 1 November 30) had the same result as pre-berry season. 53
, berry (July 16 August 31) bear feeding seasons in Whitehorse, Yukon.")
 had the same result as pre-berry season. 54")
54 Figure 24. Grey Mountain School bear hazard assessment. From left to right are assessments for pre-berry (April 1 July 15), berry (July 16 August 31) bear feeding seasons in Whitehorse, Yukon. Post-berry season (September 1 November 30) had the same result as pre-berry season. Figure 25. Porter Creek School bear hazard assessment. From left to right are assessments for pre-berry (April 1 July 15), berry (July 16 August 31) bear feeding seasons in Whitehorse, Yukon. Post-berry season (September 1 November 30) had the same result as pre-berry season. 54
 had the same result as pre-berry season. Figure 27. Takhini Elementary School bear hazard assessment.")
 had the same result as pre-berry season.")
55 Figure 26. Hidden Valley School bear hazard assessment. From left to right are assessments for pre-berry (April 1 July 15), berry (July 16 August 31) bear feeding seasons in Whitehorse, Yukon. Post-berry season (September 1 November 30) had the same result as pre-berry season. Figure 27. Takhini Elementary School bear hazard assessment. From left to right are assessments for pre-berry (April 1 July 15), berry (July 16 August 31) bear feeding seasons in Whitehorse, Yukon. Post-berry season (September 1 November 30) had the same result as pre-berry season. Playgrounds A sample of 13 playgrounds throughout the city of Whitehorse were sampled for non-natural attractants, sightlines, and the quality of surrounding bear habitat. Nine out of thirteen provided bear-resistant garbage bins, which had the latched disabled, making them non-bear-resistant, (Table 7). 55
56 Table 7. Bear-resistant garbage bin audit at 13 playgrounds in Whitehorse, Yukon, Playground Bear-resistant pedestrian garbage bins Downtown (Black Street) Yes Cowley Creek Yes Mary Lake Yes Porter Creek (Wann x Hickory) Yes Logan (Finch Crescent) No Copper Ridge (Grizzly Circle) No Hidden Valley No Northlands No Granger (Thompson Road) No Valleyview No Whitehorse Copper No Wolf Creek No Kopper King No Trails The Escarpment trail (Figure 29), has low sightlines along the sections just south of Two Mile Hill, and along the section at the north end at Robert Service Way. The Copper Ridge trail (Figure 28), has low sightlines (mostly due to fences in the residential area) at the north end abutting the Logan and Arkell subdivisions. The Yukon College trail (Figure 30), has low sightlines along most of the trail, but low bear food for its entire length. The Millennium trail (Figure 31), had low sightlines along most of its length, and in pre-berry and post-berry seasons, it also had high bear food. 56
, berry (July 16 August 31) bear feeding seasons in Whitehorse,")

57 Figure 28. Copper Ridge trail bear hazard assessment. From left to right are assessments for pre-berry (April 1 July 15), berry (July 16 August 31) bear feeding seasons in Whitehorse, Yukon. Post-berry season (September 1 November 30) had the same result as pre-berry season. Figure 29. Escarpment trail bear hazard assessment. From left to right are assessments for pre-berry (April 1 July 15), berry (July 16 August 31) bear feeding seasons and post-berry season (September 1 November 30) in Whitehorse, Yukon,
, berry (July 16 August 31) bear feeding seasons and post-berry")
, berry (July 16 August 31) bear feeding seasons in Whitehorse,")
58 Figure 30. Yukon College trail bear hazard assessment. From left to right are assessments for pre-berry (April 1 July 15), berry (July 16 August 31) bear feeding seasons and post-berry season (September 1 November 30) in Whitehorse, Yukon, Figure 31. Millennium trail bear hazard assessment. From left to right are assessments for pre-berry (April 1 July 15), berry (July 16 August 31) bear feeding seasons in Whitehorse, Yukon. Post-berry season (September 1 November 30) had the same result as pre-berry season. 58
59 City Parks and Recreation areas Seven trailheads and recreation areas along Chadburn Lake road and Grey Mountain road were surveyed. Of these areas, only two provided bear-resistant bins and signage educating users about bears or other wildlife was in place (Table 8). Table 8. Education and garbage facilities at trailheads in recreation areas in Whitehorse, YT, Area Bear signage Bear-resistant garbage Grey Mountain Road No 0/1 Magnusson and Lower Grey Mountain No 1/1 Upper Grey Mountain No 0/1 Schwatka Lake Day Use No 2/3 Chadburn Lake ski trails No 0/1 Chadburn Lake boat launch No 0/1 Chadburn Lake Day Use No 0/1 Chadden Lake trail No 0/1 Additional audits Twenty-one condominium complexes were visited and garbage and recycling systems in place surveyed (Table 9). Garbage was considered bear-resistant if contained in a bear-resistant structure or was behind a sturdy fence. None of the condominium complexes had bear-resistant garbage in place. Table 9. Condominium complex garbage bin audit in Whitehorse, Yukon, 2015 No. surveyed No. garbage bins No. bear-resistant? Pedestrian bins at bus stops, in city parks and placed on sidewalks (Table 10) were opportunistically audited. Most bins were not bear-resistant. 59
60 Table 10. Public pedestrian bin garbage bin audit in Whitehorse, Yukon, No. surveyed No. not bear-resistant No. bear-resistant? (78%) 6 (22%) Public Input Public Information Sessions Two drop-in style public information sessions were held at the Whitehorse public library. Attendees were asked if they supported several potential recommendations common in other communities seeking to reduce human-bear conflict. Feedback posters were left up for two weeks at the Canada Games Center, at the Kwanlin Dün First Nation office, and at the Ta an First Nation office. An online survey (available from19th October to 17 th November 2015) was advertised on social media for residents to provide opinion and input on local human-bear conflict issues. Table 11. Summary of general public support for potential recommendations to reduce human-bear conflict in Whitehorse, Yukon. Potential recommendation Yes (%) No (%) Total (N) Curbside pickup with bear-resistant bins Loaner programs for bear-resistant livestock feed bins Electric fence cost sharing program Management of edible landscaping initiatives Implement community bear-resistant garbage (e.g..carcross) Bird feeder restrictions (April 1 November 30) Bear resistant bird feeders required Bylaw prohibiting curbside placement of bins until AM Fruit picking drives, accumulation bylaws *1 additional support vote conditional on the City paying for bear-resistant bins General written comments: 13 comments that humans are the problem. 4 comments indicating that there is no bear problem in Whitehorse. 2 comments about education to reduce fear and over-reaction to bears. 60
61 2 comments about only putting garbage out the day of pickup (curbside). 1 suggestion that garbage pickup switch to weekly instead of biweekly. 1 suggestion to hire more people to patrol for bears. 1 suggestion of varying the appearance of curbside garbage bins. 1 comment about people leaving garbage bins on the curb for several days. 1 comment to wash and freeze attractants until garbage pickup day. 1 comment about using evidence-based decisions. 1 comment to increase the hunt. Table 12. Summary of Kwanlin Dün First Nation support for potential recommendations to reduce human-bear conflict in Whitehorse, Yukon. Support Potential recommendation Yes No Bird feeder restrictions (April 1 November 30) 8 0 Bear resistant bird feeders required 8 0 Fruit picking drives, accumulation bylaws - - Edible landscaping initiatives in the city 9* 5 Community bear-resistant garbage (e.g. Carcross) - - Curbside pickup with bear-resistant bins - - Bylaw prohibiting curbside placement of bins until AM - - Loaner programs for bear-resistant livestock feed bins 13 5 Electric fence cost sharing program 12 6 *1 vote conditional on edible landscaping being placed downtown only General written comments: 1 suggestion to enforce laws prohibiting the feeding of wildlife. Online Survey The online survey was available from 19 th October to the 17 th November. After completed surveys had not been submitted for three days, the survey was taken offline and we summarized the results. Multiple choice questions were converted into pie charts (Figures 32 39), and results from Question 2, which asked which where in the City respondents thought human-bear conflict was highest, and Question 4, which asked where respondents have encountered bears, were added to the public input map (Map 6). 61


, 14% Availability of unnatural food (e.g.")
62 I don't know, 21% Yes, 47% No, 32% Figure 32. Is human-bear conflict in Whitehorse a significant issue (Question 1)? High human population, 12% High bear population, 4% Loss of habitat, 22% Availability of natural food (e.g. soapberries), 14% Availability of unnatural food (e.g. garbage), 48% Figure 33. What is the biggest driver of human-bear conflict in Whitehorse (Question 3)? 62


? Other, 29% Electric fencing, 17% Bearproof")

63 Other, 14% Haul All, 19% Ammended pick up bylaw wthout bear proof bins, 17% Bear-proof totes, 50% Figure 34. Which of the following bear-proof waste management systems would work for you (Question 5)? Other, 29% Electric fencing, 17% Bearproof community bins, 54% Figure 35. Which potential recycling and compost management systems would you like to see in place (Question 6)? 63


, 33% Fruit bearing trees removed within urban areas, 4%")
64 I don't think we should manage bird-feeders, 52% Bylaws allowing bird-feeders from December 1 to April 1 only, 28% Bear-resistant bird-feeders only, 20% Figure 36. How would you like to see bird feeders managed in your neighborhood (Question 7)? I don't think fruit trees should be managed, 63% Fruit not allowed to accumulation trees (community fruit-picking drives etc), 33% Fruit bearing trees removed within urban areas, 4% Figure 37. How would you like to see fruit trees managed in your neighborhood (Question 8)? 64
, 35% Bear-proof livestock bin \"loaner\" programs., 22% Electric fence cost sharing program., 43% Figure 39.")
65 no opinion, 19% do not support, 13% wholly support, 38% support with restrictions, 31% Figure 38. Do you support edible landscaping in the City of Whitehorse (Question 9)? Other (please specify), 35% Bear-proof livestock bin "loaner" programs., 22% Electric fence cost sharing program., 43% Figure 39. Which initiatives to manage agricultural attractants would you support (Question 10)?. 65
66 Map 7. Bear sightings and bear travel corridors from public input sessions in Whitehorse, Yukon, July August
67 Downtown Copper Ridge Canyon Crescent Wolf Creek Porter Creek Hidden Valley MacPherson Mary Lake Cowley Creek Hillcrest Riverdale MacIntyre Spruce Hill Granger Arkell Mt. Sima Industrial Crestview MacRae Range Road Trailer Courts Kopper King Takhini Whitehorse Copper Lobird Kulan Industrial Whistle Bend Logan Fox Haven Pine Ridge Crow & Swan Mountain View Place Ingram Marwell Valleyview Northlands Park Hazard Ranking Score Whitehorse Bear Hazard Assessment October, 2015 HAZARD RANKINGS The average hazard ranking for Whitehorse subdivisions was 5.26/10 with a range of 8.0/10 Downtown and 1.66/10 for Northlands trailer park (Figure 32) Subdivision or Development Name Figure 40. Overall hazard rankings for Whitehorse, Yukon subdivisions, Highest hazard subdivisions scored between 6 and 8, high moderate subdivisions scored between 4 and 6, low moderate subdivisions scored between 2 and 4, and lowest hazard subdivisions scored under 2 on a 10-point hazard ranking scale. 67
68 Map 8. Subdivisions in Whitehorse, Yukon, ranked according to overall bear hazard score,
69 Hazard Ranking Score Hazard Ranking Score Whitehorse Bear Hazard Assessment October, 2015 Average hazard ranking in campgrounds and RV parks was 4.5/10, with Robert Service campground scoring the highest at 6.6/10, and Wolf Creek campground scoring the lowest at 4.95/10 (Figure 33) Robert Service Campground Pioneer RV Park Campground Wolf Creek Campgrpound High Country RV Park Figure 41. Overall hazard rankings for Whitehorse, Yukon campgrounds Highest hazard campgrounds scored between 6.25 and 7, high moderate campgrounds scored between 5.5 and 6.25, low moderate campgrounds scored between 4.75 and 5.5, and lowest hazard campgrounds scored between 4 and 4.75 on a 10-point hazard ranking scale. Average hazard ranking for schools was 7.7/10, with Hidden Valley School scoring the highest hazard ranking at 9/10, and Golden Horn Elementary scoring the lowest at 6.5/10 (Figure 29) Hidden Valley School Ecole Emilie Elijah Smith Tremblay Elementary Takhini Elementary School Porter Creek Elementary Grey Mountain Primary Golden Horn Elementary Figure 42. Overall hazard rankings for a sample of Whitehorse, Yukon schools, Highest hazard schools scored between 8.25 and 9, high moderate schools scored between 7.5 and 8.25, low moderate schools scored between 6.75 and 7.5, and 69
70 Hazard Ranking Score Whitehorse Bear Hazard Assessment October, 2015 lowest hazard schools scored between 6 and 6.75 on a 10-point hazard ranking scale. Average hazard scores for playgrounds was 4.5/10, with Northlands trailer park playground scoring highest hazard at 7/10, and Mary Lake s playground scoring lowest at 2/10 (Figure 35) Playground Figure 43. Overall hazard rankings for a sample of Whitehorse, Yukon playgrounds, Highest hazard playgrounds scored between 5.75 and 7, high moderate playgrounds scored between 4.5 and 5.75, low moderate playgrounds scored between 3.25 and 4.5, and lowest hazard playgrounds scored between 2 and 3.25 on a 10-point hazard ranking scale. 70
71 CURRENT PROGRAMS TO REDUCE HUMAN-BEAR CONFLICT Whitehorse has a number of programs currently in place to help to reduce humanbear conflict, including bylaws, government programs, and non-governmental organizational programs. The Whitehorse City landfill was electric fenced in 1997, the landfill has not been accessed by bears in many years (though wolves are a concern in winter). The fence is inspected weekly and vegetation is brush-cut annually (Dan Jordan, personal communication, August 20, 2015). Bylaws in urban areas require chicken owners to apply for a permit, which provides opportunities for education of residents on securing chickens and their feed from predators (City of Whitehorse, 2012, revised bylaw 36(2) concerning residential hens/chickens). Rural residential areas do not require permits to house chickens. Government programs include an agricultural incentive to cost share supplies (e.g. electric fences, wildlife deterrents) with large or small commercial farmers. While the program s mandate is to promote agriculture, being a subsistence farmer does not disqualify people from qualifying for a cost-share program. A local non-profit, Wild Wise Yukon, was formed in 2012 and has a stated purpose of conducting research, educational outreach and activities with a view to reducing negative human-wildlife conflicts in a comprehensive and collaborative manner by bringing together government, citizens and communities ( Wild Wise Yukon has partnered with the City of Whitehorse and Environment Yukon to implement educational programs and has made the bearresistant latches for the curbside garbage totes available at no cost (Heather Ashthorn, Wild Wise Yukon coordinator, personal communication, July 21, 2015), though as a pilot program, any remaining latches were sold at cost. Representatives from the City, Environment Yukon, Wild Wise Yukon and other local stakeholders regularly meet as part of a bear working group to identify and mitigate local humanbear conflict issues. 71
72 DISCUSSION Whitehorse appears to have many of the same human-bear conflict issues common in communities with urban bear populations, most notably, unsecured non-natural attractants, as well as the availability of natural food in urban areas (e.g. soapberries, fruit trees). Communities that restrict the availability of non-natural attractants have drastically reduced both the number of occurrences of human-bear conflict and the nature of conflict (less conflict related to food-conditioning; e.g. Honeyman 2007). Human-wildlife conflict often fluctuates with the availability of natural food (Baruch-Mordo 2014), and this appears to be the case in Whitehorse. Bears often prefer high-value natural forage to anthropogenic food when high value natural food is available; however, in years of natural food shortage, the availability of anthropogenic food sources is the primary driver of conflict (Figures 2 and 3 demonstrate this effect well). In 2008 and 2009, berry crops were abundant and there was very little recorded human-bear conflict (demonstrated through a lack of, or low rate of occurrences), in 2011 and 2012 there were few berries, and rate of occurrences increased markedly. The primary cause of conflict in Whitehorse from , when it was known; (Figure 3) was bears accessing human food and garbage. The cause of human-bear conflict is usually highly driven by food availability. Managers and community members have some influence over the availability of naturally occurring food sources, but have near-complete control over the availability of anthropogenic food sources, especially garbage. Bears accessing garbage is the biggest concern for reducing human-bear conflict in Whitehorse. Bears with access to garbage and other anthropogenic attractants are likely to spend more time in the community, increasing the likelihood of encounters with displays of aggression, and increasing the likelihood that bears will be removed from the population (Herrero 1985). From Map 6, it seems like collared grizzly bears are not spending more time in urban areas, but most bears periodically use more developed areas to at least cross the valley. In those movements, they are vulnerable to conflict with humans. With a lower reproductive rate than most mammals, this is a conservation concern as well as a human safety concern. Killing a large number of bears even every few years can depress populations (Baruch-Mordo et al. 2014). Females with cubs are at increased risk, as they are more likely to occupy marginal habitat (i.e. urban/suburban areas) to avoid larger, more aggressive adult animals (McLoughlin et al. 2002). Dispersal animals are often adolescent males; individuals that are more 72
73 likely to display bold behavior. Black bear populations with stable adult populations have fewer cubs, and a lower total population than populations with a high mortality rate (Czetwertynski et al. 2007), which may also lead to reduced conflict with humans. ATTRACTANT MANAGEMENT Most wildlife managers mitigate human-wildlife by managing the symptom (bears) because the cause (garbage) is out of their jurisdiction. Communities that have successfully reduced human-bear conflict show significant partnerships between provincial or territorial governments (responsible for management of wildlife) with municipal governments (responsible for management of waste). Once a community implements bear-resistant waste management protocols, conflicts with bears are drastically reduced. For example, in Canmore, Alberta, bears accessing garbage became a rare event once the community implemented a bear-resistant garbage management system, and while human-bear conflict rose in surrounding areas, conflict actually decreased in the areas with bear-resistant garbage (Honeyman 2007). The single most important action a community can take to reduce conflict with bears is to implement a tested and certified bear-resistant waste management system. Since most of the non-natural attractants in the urban residential areas of Whitehorse are garbage and compost, the city could reduce the availability of nonnatural attractants to bears by up to 35% and reduce the rate of occurrences by one half, through implementation of a bear-resistant waste management system. Garbage Management It is beyond the scope of this document to assess the different bear-resistant waste management systems available in a cost-benefit analysis, but we will provide an overview of systems in use in other communities. To be successful, bear-resistant waste management systems must be: 1. Tested (and have passed testing) on bears at an approved testing facility (one is located in Kamloops, another in West Yellowstone). 2. Easily accessible to all user groups (residents, visitors, people with disabilities, people without vehicles). 3. Self-latching (user error should not be a significant factor in the efficacy of the system). There are three bear-resistant waste management systems in wide use that show varying levels of success. Community bear-resistant bins (e.g. Haul All bins - Canmore, AB and Carcross, YT) have the most success; bears accessing garbage and 73
74 human attractants have become a rare event in communities that have implemented this system (Honeyman 2007). Even in Whitehorse, there is current evidence that such a system can reduce attractant availability. Northlands trailer park and Lobird subdivision both have a central garbage disposal system (though not currently bearresistant), these areas show lower attractant saturation (Figure 13), and ranked lower overall on the hazard scores than all three trailer parks in which residents are responsible for their own waste disposal, (Figure 32). The biggest barrier to the Haul All system is likely the upfront cost and required purchase of specialized garbage trucks, along with the loss of investment in the current system. It is worth considering however, that Canmore s experience was that the system paid for itself in a few years by substantially reducing the number of pickup sites (Town of Canmore 2000), and while initially cheaper, curbside garbage pickup options require higher annual costs in manpower and related initiatives to minimize human error. Curbside pickup with bear-resistant latches on the garbage totes (e.g. Squamish, BC) have some success but require passing bylaws prohibiting garbage totes from being placed curbside before the morning of pickup. In Squamish, BC, Meg Toom (Squamish Bear Aware coordinator, personal communication, October 3, 2015) indicated that the establishment of this system dropped human-bear conflict in the city by approximately 80%. However, because this system is extremely prone to human error (people forgetting to latch their bins, overfilling bins, or putting the bins out the night before garbage pickup, as already evidenced in the City of Whitehorse), it is a labor-intensive system, requiring extensive and continuous public education and monitoring. This system will not be bear-resistant unless a bylaw prohibiting garbage totes from being placed curbside before the morning of pickup is passed and enforced. A monitor must be hired to patrol subdivisions the evening before garbage/compost pickup to tag bins with a sticker to educate users about the bylaw. The monitor then reports violations to bylaw officers who must dedicate an officer to follow up on the education message and levy fines, if appropriate. If the monitoring of this system is reduced, people quickly become complacent, leaving garbage out overnight, which bears can then access, (Meg Toom, Squamish Bear Aware Coordinator, personal communication, October 3, 2015). Parts of Durango, Colorado, are experimentally evaluating this system, and have significant issues with user compliance (Johnson 2015). At present in Whitehorse, residents can voluntarily have their bins retro-fitted with a bear-resistant latch, which must be unlatched the morning of pickup so the garbage trucks can dump them automatically, without having to get out of the truck. Of the 1924 garbage totes we audited while in the field, 55 were retrofitted with bear-resistant latches, and of those 55 bins, only 25 were latched to make them 74
75 bear-resistant. Current challenges with these latches include issues with proper latch installation, lids being dumped by city garbage collectors, user compliance, and product integrity. The latches require ongoing, periodic inspection and maintenance (Heather Ashthorn, Wild Wise Yukon coordinator, personal communication, November 15, 2015). If the city decides to implement a system without self-latching clips to keep the totes bear-resistant, there is strong evidence that the system will need to be intensively and continuously monitored to be functional. Cities with bylaws or city ordinances stating that non bear-resistant bins cannot be placed curbside before 6 AM on the day of pickup and must be stored in a bearresistant structure, (e.g. Durango, CO) have issues with user compliance. In Durango, the level of user compliance in putting bins curbside the morning of pickup only, ranges between 34% and 52%, with significant effort towards education and enforcement (Johnson 2015). With approximately 5,800 totes in Whitehorse (Dan Jordan, personal communication, August 20, 2015), a similar level of noncompliance would result in between 2,784 and 3,828 unsecured garbage totes. In addition, since the totes are not bear-resistant, residents must have a bear-resistant structure to store totes, which many residents did not appear to have access to when we conducted our audits. While 3,000 4,000 unsecured bins would be an improvement over the current situation of over 5,000 unsecured bins, it will not likely be biologically significant in reducing human-bear conflict. Bears appear to use urban areas to supplement their diet in years of food shortage (Johnson et al. 2015). In years where natural food is scarce (e.g and 2012), bears are highly motivated to locate non-natural food sources used previously in food shortage years. The level of education and enforcement of this system would cost the city more money, and would likely still fail to reduce human-bear conflict, especially in years of natural food shortages. Urban residential and rural residential subdivisions have different challenges in improving waste disposal, and will likely require different solutions. Even if a community bear-resistant garbage system is not desired where curbside garbage pickup currently exists, providing rural residential residents with a closer and bearresistant alternative to storing garbage on their property until they are ready to drop it off at the landfill is prudent; people tend to do what is easiest and the more inconvenient it is for people to dump waste, the more likely that they will procrastinate, letting it accumulate on their property. For curbside garbage pickup options, a garbage tote with self-latching lids that is compatible with standard garbage trucks passed the testing process in mid-october of (Patti Sowka, Living With Wildlife Foundation, personal communication, 75
76 October 17, 2015). The authors have asked for a sample to be shipped to Wild Wise Yukon to evaluate its potential for use in Whitehorse. Table 13. Pros and cons of bear resistant waste management solutions available. System Pros Cons Recommend? Haul-All Guaranteed to work Long-lasting bins Requires special truck (expense) Not as easy to recycle Yes Self-latching curbside totes Bear-resistant latches retrofitted to totes Compatible with current system Relatively little up front cost Tested and certified but not yet implemented (no track record yet) Unlikely to work unless carefully monitored, which will eventually cost more than the systems mentioned above Yes No Whitehorse should most strongly consider implementing community bear-resistant garbage bins like those in Canmore and Carcross (Haul-All brand or comparable). These bins have been used successfully in many communities in Canada and the United States for decades. Another option may be the tested and certified selflatching curbside garbage totes that recently passed certification, to be implemented in areas that currently receive curbside garbage pickup, and larger commercial versions (that have also been tested and certified) to be shared by multiple houses in rural residential areas. Both of these systems minimize human error, and are therefore more cost-efficient and more likely to be successful. The Survey Monkey results indicate that most would people support making garbage infrastructure more bear-resistant, but are less supportive of managing fruit trees and bird feeders. Using bear resistant totes (similar in style to the current system, but bear-resistant) had the most support at 50%. If the City wants a truer indication of public support for an effort to make garbage unavailable to bears, a professional polling company should be used to get a more accurate indication of the prevailing public opinion. Our results are likely biased, as only people interested in human-bear conflict issues are likely to take the time to answer the survey questions. Surveys should also avoid only asking people at the landfill as well, since we also spoke to rural residential residents who had paid for a neighborhood bin, and would be missed in a landfill survey. 76
77 Campgrounds are another area where garbage (and unsecured human food) is of particular concern. In Whitehorse, Robert Service campground was particularly of note. This campground hosts low-income campers who make their campsite a temporary residence on a monthly basis. Many residents do not own a vehicle where they could store their food, but even if they did, the tenting sites are walk-in, which makes retrieving food from the campground parking lot inconvenient. The campground is also situated between a major road entering Whitehorse, and the Yukon River, which functionally funnels bears through the campground in order to pass through the area. Like garbage, recycling needs to be secured from bears in bear-resistant containers. While not as available as garbage is in Whitehorse, recycling can be highly attractive to bears, especially if it isn t thoroughly cleaned. At present, residents take their recyclables to one of a couple of commercial operators in Whitehorse, storing recycling at their residence until that time. Bins designed for storing garbage securely from bears will also work for recycling (and livestock feed), and could be stocked in the local feed store or loaned to interested residents. Other non-natural attractants Human-bear conflict does not end with bear-resistant garbage. Bears are opportunistic omnivores targeting fruit trees, bird feeders, pet food, and barbeque grease traps. During fruit season, many communities have found it necessary to pass bylaws requiring residents to harvest their fruit, or have implemented programs to encourage residents to replace fruit bearing trees with a tree that blossoms but does not fruit. Sample bylaws are included in the appendices. The two main issues with fruit trees include residential fruit trees (e.g. crabapple trees), and ornamental May trees. May trees in Whitehorse have attracted bears to urban areas, including Yukon College. The numerous, small berries are difficult to manage and the trees themselves may have high intrinsic value to a small number of residents. This same situation exists in Whistler, BC (with mountain ash), where the community has passed a bylaw requiring all fruit trees to be picked or the tree removed. Local nonprofit groups have offered replacement non-fruit bearing ornamental or native plants as an incentive to residents and businesses. Community fruit-picking drives are also popular, where you can not only pick the fruit but people without fruit trees can buy or receive harvested fruit for their own use. Bird feeders can be particularly problematic, as many residents and visitors enjoy feeding and seeing birds, and associated conflict with bears often goes unreported. Some communities (e.g. Canmore, AB) have restricted bird feeders to the winter months only, while other communities (e.g. Whistler, BC) have tolerated bird feeders, and the associated human-bear conflict. Feeding small amounts and not 77
78 leaving bird feeders out overnight, when birds are asleep anyway) can help reduce the likelihood of bears accessing birdseed. One of the most concerning emerging issues is livestock and livestock feed, particularly with the rising popularity of backyard chickens. Bears can easily kill chickens, and most chicken coops are inadequately protected. Electric fencing is the best way to prevent bears from accessing livestock. The fence must be erected to predator exclusion specifications (6-8 wires, 10,000 volts, etc) to prevent bears from entering. The fence does require maintenance, ensuring the voltage stays high, but the investment is minimal compared to buying new livestock and rebuilding damaged structures. Electric fencing is not dangerous for people, pets or children (more on electric fencing here: ElectricFenceGuideBears.pdf). Perhaps one of the most interesting and difficult to explain attractants are petroleum products. In some jurisdictions, bears have torn into buildings, seemingly initially attracted by used motor oil on the other (inside) side of the wall, causing enormous property damage (personal experience). In Whistler, there is a continuing problem with bears damaging hot tub covers in high-end resorts and condominiums, presumably due to the covers being made from petroleum products (Homstol et al. 2007). Petroleum product containers should be treated in the same way as recycling, as a bear attractant. First Nation Communities First Nation communities in Whitehorse have some unique issues related to nonnatural attractants. The Kwanlin Dün collect their own garbage twice per week (John Miekle, personal communication, August 21, 2015). Each residence has a wooden garbage box near the street; wood is much better at accumulating odors, and is more difficult to clean, compared to metal or plastic, which makes these boxes highly attractive to bears. Replacing these boxes with sturdier, bear-resistant metal boxes that can also hold recycling and/or compost would be an ideal solution. Meat processed in the fall can be highly attractive to bears while it is being processed (in smokehouses) and the following spring when bones thrown out to dogs thaw from the snow. We could find no occurrence reports indicating bears were targeting smokehouses, but if the data is simply not captured currently, or if smokehouses become more of an issue in the future, centrally locating some behind an electric fence, would deter bears from accessing the meat inside. Any bones in yards can be easily removed on an organized spring clean-up day, coordinated with social events to encourage participation. 78

79 Natural attractants Whitehorse Bear Hazard Assessment October, 2015 While non-natural attractants are the primary concern for Whitehorse, it is worth considering ways to reduce some of the natural attractants that initially attract animals into the human developments. Bears may defend a particularly laden berry bush from people, and many people are not expecting to encounter a bear within the city limits, making a surprise encounter more likely. The practice of fire smarting communities (thinning forests near communities to reduce fuel for wildfires) helps to open up sightlines so bears and people are less likely to experience surprise encounters. However, it also opens the forest canopy and creates better conditions for soapberry (Shepherdia canadensis), which results in increased berry production (Hamer 1996). From mid-july to late August, black and grizzly bears target soapberries, which, due to their preference for partial shade and partial sun, often grow best on roadsides, trails, and in fire smarted areas. Because male plants don t produce berries (Cooper 1932), workers can pull or cut female shrubs to significantly reduce an area s attractiveness to bears. Removing the female Shepherdia shrubs within 100 m of human developments has become a standard recommendation and is commonly practiced in other communities situated in ecosystems where soapberry is a preferred bear food (Honeyman 2007, Homstol and Rear 2009). Concerns about impacts to forest aesthetics can be minimized through education; soapberry-reduced forests are still aesthetically pleasing (Picture 5) and safer for both bears and humans. Photo 5. A trail in Porter Creek subdivision with high sightlines. Soapberry is not the only significant bear food requiring semi-open habitat to flourish; dandelions (Taraxicum officionale), bear root (Hedysarum alpinum) and locoweed (Oxytropus) are all important bear foods in spring and/or fall and are 79
80 more likely to be growing on roadsides and trailsides, attracting bears into areas where they are more likely to encounter humans and their non-natural attractants. Areas where this may be of particular concern include campgrounds, playgrounds and schools. Many of these areas abut green spaces, where people are more likely to encounter a bear. Our campground and park assessments of sightlines and habitat may capture some edge effect (where partial canopy cover allows for increased sunlight to hit the ground and encourage plant productivity). In addition, these habitat assessments are at a much finer scale than the GIS habitat maps; high bear food availability is calculated differently than for the larger scale habitat maps (see Methods section). It is meant to allow comparisons between different campgrounds, school yards and parks, and to highlight the priorities to address at this scale. Habitat manipulation is very difficult to accomplish at a large scale, but on a fine scale such as the perimeters of campgrounds, RV parks and school yards, it can be quite important. Completing the schoolyard and playground assessments can provide some direction with respect to sightlines improvements, and reduction of high quality bear foods in urban areas. Potential future sources of conflict in Whitehorse Mountain ash trees appear to be purely ornamental in Whitehorse at present, but since they are a preferred fall bear food in more southern areas where they grow in the wild (Homstol et al. 2007), bears in Whitehorse may eventually start to target them. Hunting is a popular fall activity, and processing meat in the open, for residents without a garage or suitably bear-resistant shed, bears accessing meat may become a concern. If this becomes an issue, providing residents with some infrastructure to store and process wild game should eliminate this potential problem. In Summary Managing attractants for bears, both natural and non-natural, is a many faceted challenge and as such requires an integrated approach. Visible change can come slowly when dealing with a large area city of Whitehorse, with a complex system of fluctuating natural food availability. Reducing human-bear conflict will require buy in from community stakeholders, members of the public, and the City of Whitehorse. Finding community champions to take charge of a particular recommendation that resonates with them will help turn recommendations into reality. 80
81 CONCLUSION AND RECCOMENDATIONS The most effective way to reduce human-bear conflict within the City of Whitehorse is to better secure non-natural attractants. The storage of garbage, compost and other high value attractants is a city-wide issue. HIGHEST PRIORITIES 1. Conduct a thorough assessment of available bear-resistant garbage management systems (described in the Discussion section) to determine which system would work best for Whitehorse. With the unique needs of each subdivision type, there is not likely one prescription that would fit every area. We suggest either the Haul-All system for the entire city; or an equivalent system with tested and certified self-latching bear-resistant garbage totes for urban residential areas and a system similar to Haul-All for rural residential areas. 2. Implement a city-wide bear-resistant waste management system (for residential and commercial properties). 3. For Kwanlin Dün areas (MacIntyre, Crow & Swan), replace wooden garbage boxes at residences and community buildings with bear-resistant metal boxes that can hold garbage and recycling/compost. Hold a community spring clean-up to remove any left over bones from the fall hunt that were given to dogs. Make the event social to encourage resident participation. 4. Draft and pass a wildlife attractants bylaw (see Appendix V for a sample bylaw from the District of Squamish). Consider including all non-natural attractants, including bird feeders, livestock (electric fence) and fruit trees. 5. Install bear-resistant food lockers and garbage bins at campground tenting sites, prioritizing Robert Service campground tenting area. 6. Pedestrian garbage bins in parks, campgrounds and scattered around the city are often not bear-resistant, as many have had the latches removed. These bins should be completely audited (and monitored on a 1-5 year cycle) and replaced or repaired as required. Prioritize bins bordering on green space and campgrounds. 81
82 7. Open sightlines and remove soapberry plants prioritizing the areas abutting green spaces in the highest hazard areas: the downtown escarpment, Hamilton Boulevard, Copper Ridge, Hidden Valley school, the tenting loop at Robert Service campground. Work with Fire smart initiatives to pool planning and resources. 8. Require new developments to install bear-resistant garbage bins (or provide bear resistant garbage totes) as part of the development plan. 9. Implement an education program for city workers (bylaw, permit granting staff) about the merits of electric fencing (constructed for predator exclusion) for livestock. The cost-sharing program implemented by the agriculture branch appears to be under-utilized and should be advertised to local agriculturalists. MODERATE PRIORITIES 10. Landfill maintenance should be increased to ensure the electric fence maintains a high charge. Keep vegetation and loose garbage that could short out wires near the fence low for at least four feet outside the fence (use a weed-whacker/bobcat as often as is necessary). 11. Start a program to manage community fruit trees (including education). Assist residents who want to harvest their fruit (with community gleaning programs etc.) so bears don t access the fruit first. Implement a program to replace unwanted fruit trees with trees that blossom in the spring but do not produce fruit (e.g. spring snow crabapple trees). 12. Start a bear-resistant bin loaner program for recycling and livestock feed. These programs have been quite popular in some communities (e.g. Bragg Creek, AB; Meadow Creek, BC). 13. Remove fruiting berry bushes from city landscaping and enact a policy of planting natural food less attractive to bears. 14. If certain trails are experiencing high numbers of bear sightings, consider a trail audit, to assess sightlines and bear food on trails popular with recreationalists. 15. Audit the remaining schools to determine if sightlines need to be increased or bear food (e.g. soapberry) needs to be removed. 82
83 16. Erect educational bear signage at the recreation areas, prioritizing Day Use areas, as users are more likely to have food with them. Replace non bearresistant bins with bear-resistant ones. 17. Continue partnerships (including the Bear Working Group) with the City of Whitehorse, Wild Wise Yukon and Environment Yukon to ensure humanbear conflict issues are mitigated with input and resources from all stakeholders. Developing capacity through staff and volunteers at Wild Wise Yukon will help keep much of the work required for these recommendations local. 18. Update this hazard assessment in approximately five years to track progress and measure success. 83
84 LITERATURE CITED Alberta Environment and Sustainable Resource Development Grizzly Bear Conservation in Alberta: 2013 Management Activities and Recovery Implementation. Document available at: wildlife/wildlife-management/grizzly-bears/documents/grizzlybears- GrizzlyBearConservationAlberta-Apr2014.pdf Applied Ecosystem Management Ltd Defining Ecologically Based Significant Wildlife Areas. Prepared for City of Whitehorse Planning Department and YG Department of Renewable Resources, Wildlife Viewing Program. Appleton, R Black bear abundance and seasonal forage habitat value in Whistler, BC. Master s thesis. Simon Fraser University, Vancouver, Canada. Baruch-Mordo, S., K. R. Wilson, D.L. Lewis, J. Broderick, J. S. Mao, S. W. Breck Stochasiticity in Natural Forage Production Affects use of Urban Areas by Black Bears: Implications to Management of Human-Bear Conflict. PLoS ONE 9(1): e Blanchard, B. M. and R. R. Knight Biological consequences of relocating grizzly bears in the Yellowstone ecosystem. Journal of Wildlife Management 59(3): Can, Ö. E., D'Cruze, N., D. L. Garshelis, J. Beecham, and D. W. Macdonald Resolving Human-Bear Conflict: A Global Survey of Countries, Experts, and Key Factors. Conservation Letters, 7: doi: /conl Cooper, D. C. "The chromosomes of Shepherdia canadensis." American Journal of Botany (1932): Czetwertynski, S.M. M. S. Boyce, and F. K. Schmiegelow Effects of hunting on demographic parameters of American black bears. Ursus 18(1): Davis, H., D. Wellwood, L. Ciarniello Bear Smart Community Program. Background Report. Prepared for BC Ministry of Water, Land and Air Protection, Victoria, BC. Document downloaded at: 84
85 Ecological Framework of Canada. No date. Boreal Cordillera Ecozone. Document available at Environment Canada Canadian Climate Normals Station Data (Whitehorse Airport). Document available at: nid=1617&lang=e&stationname=whitehorse&searchtype=contains&stnna mesubmit=go&dcode=0 Fies, M.L., D. D. Martin, G. T. Blank Movements and rates of return of translocated black bears in Virginia. International Conference on Bear Research and Management 7: Hamer, David. Buffaloberry. November, [Shepherdia canadensis L. (Nutt.)] fruit production in fire-successional bear feeding sites. Journal of Range Mangement 49(6) Herrero, S Bear Attacks: Their Causes and Avoidance. Hertig Publishers Ltd, Toronto, Canada. Homstol, L., N. Brabyn, and T. Hamilton Whistler Bear Aversion Research Team 2006 annual report. Prepared for BC Ministry of Environment. Homstol and Rear Haines Junction, Yukon Bear Hazard Assessment. Prepared for YG, Parks Canada, Champagne and Aishihik First Nation and the Village of Haines Junction. Honeyman, J Bow Valley Bear Hazard Assessment. Prepared for Alberta Sustainable Resource Development. Canmore, Alberta, Canada. Document available at: eyfinal.pdf Johnson, H. E Black bear exploitation of urban environments: finding management solutions and assessing regional population effects. Wildlife Research Report for Colorado Division of Parks and Wildlife. Document available at: ndurangobear_w204-r4_progressreport_ pdf Johnson, H. E., S.W. Breck, S. Baruch-Mordo, D.L. Lewis, C.W. Lackey, K.R. Wilson, J. 85
86 Broderick, J.S. Mao, J.P. Beckmann Shifting perceptions of risk and reward: Dynamic selection for human development by black bears in the western United States. Biological Conservation 187: McCann, R.K Kluane National Park grizzly bear research project. Interim final report to accompany the project review, October 21 & 22, Parks Canada, Kluane National Park and Reserve, Haines Junction. 128 pp. New Jersey Division of Wildlife Know the bear facts: black bears of New Jersey. Documents available at McLoughlin, P., R. l. Case, R. J. Gau, H. D. Cluff, R. Mulders and F. Messier. Hierarchical habitat selection by barren-ground grizzly bears in the central Canadian arctic. Ecosystems Ecology 132: Smith, B.L. and E.J. Osmond-Jones Grizzly bear abundance in Yukon ecoregions. Draft file report to the Yukon fish and Wildlife Branch, Department of Renewable Resources, Whitehorse, YT, Canada. Town of Canmore Bear-proof Waste Handling System The Town of Canmore Experience. Powerpoint presentation at Managing Bears in Forested Environments Conference. Document available at: Management/Animal-Proof-Containers.html U.S. Fish and Wildlife Service Louisiana Black Bear. Document available at: Yukon Bureau of Statistics Population Report Government of Yukon report. Document available at : 86
87 APPENDIX I List of Interviewees during the Field Visit to Whitehorse, July and August 2015 Miles Hume Shannon Clohosey Tom Wyers Jackie Taylor Kinden Kosick Dan Jordan Kevin Lyslo Andrew Smith Scott Gilbert Ramona Maraj Ken Knutson Dave Bacika Matt Ball Christina MacDonald Lewis Rifkind Dave Sembsemoen John Meikle Dawna Hope Heather Ashthorn Graham Van Tieghem Clayton Hadley City of Whitehorse City of Whitehorse City of Whitehorse City of Whitehorse City of Whitehorse City of Whitehorse City of Whitehorse Yukon College Yukon College Yukon Territorial Government Yukon Territorial Government Yukon Territorial Government Yukon Territorial Government Yukon Conservation Society Yukon Conservation Society Kwanlin Dün First Nation Kwanlin Dün First Nation Ta an First Nation Wild Wise Yukon Yukon Fish and Wildlife Management Board General Waste Management i
88 APPENDIX II Residential, Commercial and Industrial Survey details Table II.1. Number of curbside garbage totes left overnight the day before garbage pickup in urban residential areas, Whitehorse, Yukon, Subdivision surveyed bins out bins in Arkell Copper Ridge Crestview Crow & Swan n/a n/a n/a Downtown Granger Hillcrest Ingram Logan MacIntyre n/a n/a n/a Porter Creek Riverdale Takhini Valleyview Whistle Bend Table II. 2. Number and type of unsecured non-natural attractants in Whitehorse, Yukon, Type surveyed garbage recycle smoke live compost fruit bird mtn bbq othr house stock trees fdrs ash urban res rural res trailer park ii
89 Indust * * also, 26 Petroleum products unsecured. iii
90 APPENDIX III Ecosystem Map (Applied Ecosystem Management 2000) habitat descriptions and ranking according to habitat quality for Grizzly and Black bears AB Trembling Aspen Bearberry Generally occur on south-facing slopes and ridges, but can be found in a variety of positions. Lichen and moss cover are low with a near carpet of bearberry (Arctostaphylus uva-ursi) forming ground cover. Sporadic soapberry (Shepherdia canadensis) is common. Steep slopes are often associated with GS (grass-sage). Aspen (Populus tremuloides ) groves may also be locally- prominent on a range of conditions and are often considered early successional forest types. PB Pine/Bearberry Lodgepole pine-dominated stands on morainal or transitional upland sites with limited shrub understory development. Bearberry (Arctostaphylus uva-ursi) forms the dominant groundcover. Soapberry (Shepherdia canadensis) and willow cover sporadic, aspen and spruce may be intermixed in canopy and moss cover is generally low. Terrestrial lichens may be locally abundant. Labrador tea (Ledum groelandicum)/dwarf birch shrubs (Betula glandulosa ) and mossberry (Empetrum nigrum) may be important on moist sites and in the lower subalpine. This community generally occurs on dry, poor sites, however. PC Lodgepole Pine Canoe (Paper) Birch Open canopy lodgepole pine stands occurring on gently sloping, shallow soil ecosystems with rock outcrops. Rock outcrops may contain a high cover of terrestrial lichens. Moist depressions contain thick blankets of feathermoss with Paper Birch (Betula paperifera), alder (Alnus crispa) and Labrador Tea (Ledum groenlandicum). This community has only been described on one site within the City of Whitehorse, near Mount Sima. To the knowledge of the mapping team, this ecosystem unit has not been described elsewhere within the Southern Lakes Region. PG Lodgepole Pine - Grass Open, mesic stands with low shrub cover, abundant grass cover and a variable moss layer. Soapberry and Mooseberry (Viburnum edule) is often present in moderate amounts with large, sporadic willows growing in canopy openings. This unit has received limited description and field sampling. PL Pine/Lichen Dry, open canopy lodgepole pine (Pinus contorta) forests with abundant terrestrial lichen cover (Cladina and Cladonia spp.) growing on coarse textured soils. Flat benches and complex terrain are the dominant terrain features. iv
91 Rapidly drained, poor sites. Usually associated with glaciofluvial parent materials (glaciofluvial sites generally have the highest abundance of terrestrial lichens). Complex fire history is common. PL is commonly associated with PB ecosystems. RB Recent Burn Recent burn (<10 years old) with limited vegetation recovery. A recent burn in a previously forested area would receive the designation of Forested, Recent Burn. This would be differentiated from Non-forested areas by the presence of standing and downed snags, indicating forested conditions. SF White Spruce - Feathermoss A closed canopy, white spruce (Picea glauca) dominated forest community occurring on both level conditions and cool aspects. The shrub understory is usually sparse and ground cover is dominated by a thick layer of feathermoss. Pine may be interspersed throughout the canopy. Old stands may contain juniper; moist sites may contain mossberry and Labrador tea. Spruce-feathermoss forests that occur in riparian zones and on alluvial terraces can have variable but usually limited development of shrub understory. Moist sites may have extensive horsetail (Equisetum spp.) cover on rich, organic soils. They are generally not influenced by active flooding and deposition. These sites contain some of the most productive forests in southern Yukon. SL White Spruce - Lichen - Grass Open canopy white spruce stands growing on level medium textured soils with rapid drainage. Mixed spruce and pine canopy with predominantly lichen, grass and dwarf shrub groundcover. Lichen is not as dominant as the PL ecosystem unit. Willow or shrub birch may be interspersed throughout. ST White/Black Spruce Labrador Tea Acidic, cool (possibly permafrost), moist to wet soils for portions of the year. Tree cover can be white or black (Picea mariana) spruce. Forest canopy is usually sparse and a thick layer of moss and Labrador tea in the understory. Limited shrub cover. Poor sites often in association with depressions and seepage areas. ST usually forms on mineral soils with peaty surface horizons. SW White Spruce - Willow Open canopy white spruce forests growing on a variety of sites but tending towards mesic, with moderate-high moss cover and a prominent shrub layer. Both willow and shrub birch may be present. Moss cover is variable. Depressions may contain Labrador Tea and mossberry. SB Spruce Bog Acidic, partially saturated soils for portions of year. Partially forested with variable cover of willow and shrub birch. Bogs are rare in southern Yukon due to the dry climate. v
92 SP White Spruce - Balsam Poplar Riparian Generally limited to lowland riparian areas with rich organic soils. Are periodically influenced by flooding and similar low intensity disturbances. They tend to be structurally complex and are affected by fire to a lesser degree than upland stands. ST White/Black Spruce Labrador Tea Acidic, cool (possibly permafrost), moist to wet soils for portions of the year. Tree cover can be white or black (Picea mariana ) spruce. Forest canopy is usually sparse and a thick layer of moss and Labrador tea in the understory. Limited shrub cover. Poor sites often in association with depressions and seepage areas. ST usually forms on mineral soils with peaty surface horizons. SW White Spruce -Willow Wettest of the spruce-willow communities. Well developed herbaceous and gramminoid cover is common. Table III.1 Habitat ratings for ecosystem types in Pre-berry (April 1 July 15), berry (July 16 August 31), and post-berry (September 1 November 30) feeding seasons for black and grizzly bears in Whitehorse, Yukon. Pre-berry Berry Post-berry Unit Name Boreal Upland Forested Ecosystems H H M AB Trembling aspen bear-berry H H M PB Pine bear-berry L L L PC Lodgepole Pine Grass L L L PL Pine/Lichen L L L RB Recent Burn L L L SF White Spruce Feather Moss M L L SL White Spruce Lichen Grass L L L ST White/Black Spruce Labrador Tea L L L SW White Spruce Willow Boreal Lowland Forested Ecosystems L L L RB Recent Burn L L L SB Spruce Bog H L L SF White Spruce Feathermoss M L L SP White Spruce Balsam Poplar Riparian L L L ST White/Black Spruce Labrador Tea M L L SW White Spruce Willow vi
93 Boreal Vegetated, Non-forested Ecosystems L L L BG Sphagnum Bog M L L FE Sedge Fern M L L ME Meadow M L L MR Marsh L L L WA Willow Alder M L L WB Willow Shrub Birch vii
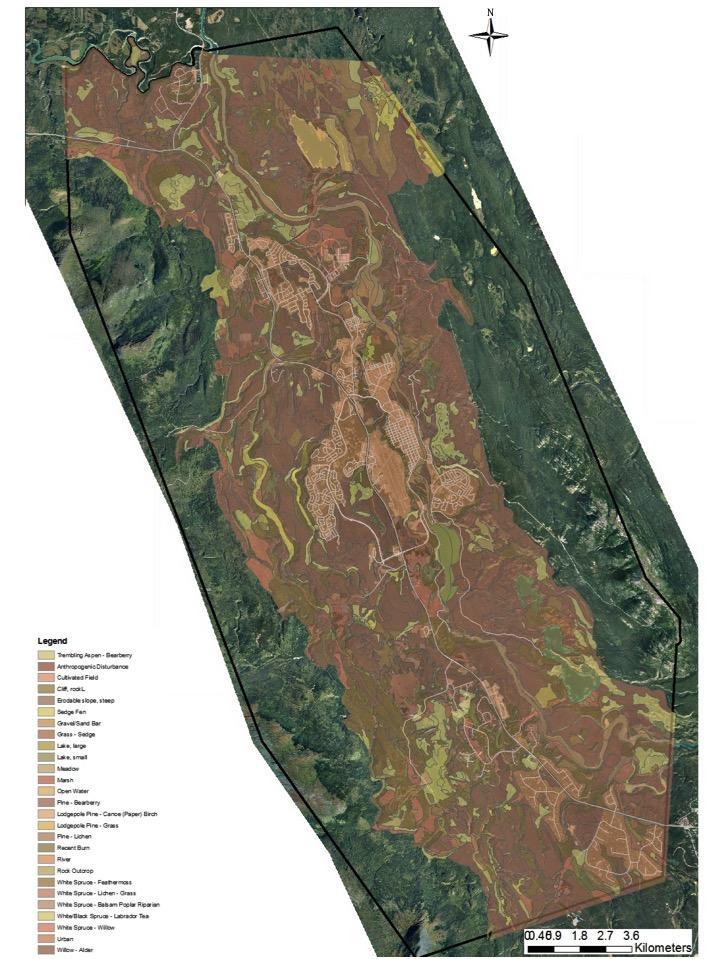
94 viii
Wallace Lake Provincial Park. Management Plan
 Wallace Lake Provincial Park Management Plan 2 Wallace Lake Provincial Park Table of Contents 1. Introduction... 3 2. Park History... 3 3. Park Attributes... 4 3.1 Natural... 4 3.2 Recreational... 4 4.
WildSafeBC Annual Report 2015 Powell River Regional District
 WildSafeBC Annual Report 2015 Powell River Regional District Prepared by: Francine Ulmer, WildSafeBC Community Coordinator Photo: Francine Ulmer Executive Summary Conservation Officers in Powell River
Wallace Lake Provincial Park. Draft Management Plan
 Wallace Lake Provincial Park Draft Management Plan Wallace Lake Provincial Park Draft Management Plan Table of Contents 1. Introduction... 3 2. Park History... 3 3. Park Attributes... 4 3.1 Natural...
Proposal to Redevelop Lower Kananaskis Lake Campgrounds in Peter Lougheed Provincial Park. What We Heard
 Proposal to Redevelop Lower Kananaskis Lake Campgrounds in Peter Lougheed Provincial Park What We Heard In December 2016, Alberta Parks proposed to make several changes to campgrounds in the Lower Kananaskis
KBSIC Southern Foothills Bear Resistant Container Loan Program 2008 Final Report. Prepared by Karen Oldershaw, Program Coordinator
 KBSIC Southern Foothills Bear Resistant Container Loan Program 2008 Final Report Prepared by Karen Oldershaw, Program Coordinator The Foothills Bear Resistant Container Loan Program is designed to provide
Northern Rockies District Value of Tourism Research Project December 2007
 Northern Rockies District Value of Tourism Research Project December 2007 Project Partners: Northern Rockies Regional District, Tourism British Columbia, Northern Rockies Alaska Highway Tourism Association,
Preferred Recreation Recommendations Stemilt-Squilchuck Recreation Plan March 2018
 Preferred Recreation Recommendations Stemilt-Squilchuck Recreation Plan March 2018 Below are the recommended recreation ideas and strategies that package together the various recreation concepts compiled
Yard Creek Provincial Park. Management Plan
 Yard Creek Provincial Park Management Plan Draft January 2010 Yard Creek Provincial Park Management Plan Approved by: telàlsemkin/siyam/chief Scott Benton Bill Williams Squamish Executive Director ation
Watchorn Provincial Park. Management Plan
 Watchorn Provincial Park Management Plan 2 Watchorn Provincial Park Table of Contents 1. Introduction... 3 2. Park History... 3 3. Park Attributes... 3 3.1 Natural... 4 3.2 Recreational... 4 3.3 Additional
Labrador - Island Transmission Link Target Rare Plant Survey Locations
 27-28- Figure: 36 of 55 29-28- Figure: 37 of 55 29- Figure: 38 of 55 #* Figure: 39 of 55 30- - east side Figure: 40 of 55 31- Figure: 41 of 55 31- Figure: 42 of 55 32- - secondary Figure: 43 of 55 32-
2.0 PARK VISION AND ROLES
 2.0 PARK VISION AND ROLES 2.1 Significance in the Protected Area System Marble Range and Edge Hills provincial parks protect 6.8% of the Pavillion Ranges Ecosection, which is located in the Southern Interior
Rogue River Access and Management Plan Draft Alternatives
 Rogue River Access and Management Plan Draft Alternatives The Rogue River Access and Management Plan was initiated in December, 2011 and is being led by Jackson County Parks (JCP) and Oregon Department
Map 1.1 Wenatchee Watershed Land Ownership
 Map 1.1 Wenatchee Watershed Land Ownership Map 1.1 Wenatchee Watershed Land Ownership The Wenatchee watershed lies in the heart of Washington state in Chelan County. Just larger than the state of Rhode
Alternative 3 Prohibit Road Construction, Reconstruction, and Timber Harvest Except for Stewardship Purposes B Within Inventoried Roadless Areas
 Roadless Area Conservation FEIS Summary Table S-1. Comparison of Key Characteristics and Effects by Prohibition Alternative. The effects summarized in this table A would occur in inventoried roadless areas
July 2018 RV PRODUCTION. Overview of towable and motorised recreational vehicles manufactured in Australia. Data Provided by nemaustralasia
 y RV PRODUCTION Overview of towable and motorised recreational vehicles manufactured in Australia. Data Provided by nemaustralasia This research is undertaken in partnership between the National Association
PROUDLY BRINGING YOU CANADA AT ITS BEST. Management Planning Program NEWSLETTER #1 OCTOBER, 2000
 PROUDLY BRINGING YOU CANADA AT ITS BEST VUNTUT NATIONAL PARK Management Planning Program NEWSLETTER #1 OCTOBER, 2000 INTRODUCTION This newsletter launches the development of the first management plan for
Beaver Creek Provincial Park. Management Plan
 Beaver Creek Provincial Park Management Plan 2 Beaver Creek Provincial Park Table of Contents 1. Introduction... 3 2. Park History... 3 3. Park Attributes... 4 3.1 Natural... 4 3.2 Recreational... 4 4.
Nelson and RDCK Areas E and F 2015 WildSafeBC Annual Report
 Nelson and RDCK Areas E and F 2015 WildSafeBC Annual Report Executive Summary Nelson, Areas E and F WildSafeBC, a program of British Columbia Conservation Foundation (BCCF), received funding from the Columbia
Mackinnon Esker Ecological Reserve Draft - Management Plan
 Mackinnon Esker Ecological Reserve Draft - Management Plan May 2011 Photo Credit: This document replaces the direction provided in the Carp Lake Provincial Park and Protected Area and Mackinnon Esker Ecological
Network of International Business Schools
 Network of International Business Schools WORLDWIDE CASE COMPETITION Sample Case Analysis #1 Qualification Round submission from the 2015 NIBS Worldwide Case Competition, Ottawa, Canada Case: Ethiopian
Marchand Provincial Park. Management Plan
 Marchand Provincial Park Management Plan 2 Marchand Provincial Park Table of Contents 1. Introduction... 3 2. Park History... 3 3. Park Attributes... 4 3.1 Natural... 4 3.2 Recreational... 4 3.3 Additional
Dr. Melissa Grigione And Kurt Menke. Jaguar -Arturo. Jaguarundi -Arturo. Ocelot -Arturo. Caso. Caso. Caso
 Identifying Priority Conservation Areas in the U.S.- Mexico Border Region for America s Neotropical Cats, the Jaguar, Jaguarundi and Ocelot: An International Effort Dr. Melissa Grigione And Kurt Menke
Submission to NSW Koala Strategy Consultation Process. March 2017
 Submission to NSW Koala Strategy Consultation Process March 2017 Table of contents Opening 3 Response 3 Whole-of-government NSW koala strategy 3 State Environment Planning Policy (SEPP) 44 3 The draft
Restore and implement protected status that is equivalent, or better than what was lost during the mid-1990 s
 THE ROSSLAND RANGE, OLD GLORY AREA. Executive summary. The Friends of the Rossland Range Society, on behalf of the local outdoor community, seeks to accomplish the following with respect to the Old Glory
BIG ANIMALS and SMALL PARKS: Implications of Wildlife Distribution and Movements for Expansion of Nahanni National Park Reserve. John L.
 BIG ANIMALS and SMALL PARKS: Implications of Wildlife Distribution and Movements for Expansion of Nahanni National Park Reserve John L. Weaver Conservation Report No.1 July 2006 4 SUMMARY The boundaries
SAMTRANS TITLE VI STANDARDS AND POLICIES
 SAMTRANS TITLE VI STANDARDS AND POLICIES Adopted March 13, 2013 Federal Title VI requirements of the Civil Rights Act of 1964 were recently updated by the Federal Transit Administration (FTA) and now require
MANAGEMENT DIRECTION STATEMENT
 Lower Mainland District MAAGEMET DIRECTIO STATEMET January 2001 for Liumchen Ecological Reserve Ministry of Environment Lands and Parks BC Parks Division Table of Contents Page Introduction... 1 Purpose
HOTFIRE WILDLIFE MANAGEMENT MODEL A CASE STUDY
 1 HOTFIRE WILDLIFE MANAGEMENT MODEL A CASE STUDY Sub-theme: Economics / business venture, livelihood strategies Format: Poster Bruce Fletcher Hotfire Hunting and Fishing Safaris P O Box 11 Cathcart 5310
Accommodation Survey: November 2009
 Embargoed until 10:45am 19 January 2010 Accommodation Survey: November 2009 Highlights Compared with November 2008: International guest nights were up 2 percent, while domestic guest nights were down 1
Dungeness Recreation Area County Park Master Plan
 Dungeness Recreation Area County Park Public Outreach Meeting October 10, 2007 Project Overview USFWS Site Dungeness Recreation Area County Park Meeting Objectives: Re-Introduce project; provide status
Lake Trout Population Assessment Wellesley Lake 1997, 2002, 2007
 Lake Trout Population Assessment Wellesley Lake Prepared by: Lars Jessup Fish and Wildlife Branch November 2009 Lake Trout Population Assessment Wellesley Lake Yukon Fish and Wildlife Branch TR-09-01 Acknowledgements
RESEARCH AND PLANNING FORT STEELE HERITAGE TOWN VISITOR STUDY 2007 RESULTS. May 2008
 RESEARCH AND PLANNING FORT STEELE HERITAGE TOWN VISITOR STUDY 2007 RESULTS May 2008 Research and Planning Tourism British Columbia 300-1803 Douglas St. Box 9830 Stn. Prov. Gov t. Victoria, BC V8W 9W5 Web:
RAY YENKANA Willowbrook Cr, Dawson Creek BC Canada $2,847,000
 1716 Willowbrook Cr, Dawson Creek BC Canada For SALE $2,847,000 This is a rare find, 32 townhomes in Dawson Creek, BC. Excellent investment in a single title multi family complex. Vendor has upgraded this
Role of the Protected Area
 Role of the Protected Area Provincial and Regional Context Height of the Rockies and Elk Lakes provincial parks lie in southeastern British Columbia in the Rocky Mountains, about 85 km southwest of Calgary,
AURORA WILDLIFE RESEARCH
 AURORA WILDLIFE RESEARCH Kim Poole 2305 Annable Rd. Nelson, BC, V1L 6K4 Canada Tel: (250) 825-4063; Fax: (250) 825-4073 e-mail: klpoole@shaw.ca 27 April 2005 Mike Gall Conservation Specialist and Glenn
Whitemouth Falls Provincial Park. Draft Management Plan
 Whitemouth Falls Provincial Park Draft Management Plan Whitemouth Falls Provincial Park Draft Management Plan Table of Contents 1. Introduction... 3 2. Park History... 3 3. Park Attributes... 4 3.1 Natural...
Numaykoos Lake Provincial Park. Management Plan
 Numaykoos Lake Provincial Park Management Plan 2 Numaykoos Lake Provincial Park Table of Contents 1. Introduction... 3 2. Background... 3 3. Park Purpose... 5 4. Park Management Guidelines... 6 Appendix...
3.0 LEARNING FROM CHATHAM-KENT S CITIZENS
 3.0 LEARNING FROM CHATHAM-KENT S CITIZENS An important aspect in developing the Chatham-Kent Trails Master Plan was to obtain input from stakeholders and the general public. Throughout the course of the
Agritourism in Missouri: A Profile of Farms by Visitor Numbers
 Agritourism in Missouri: A Profile of Farms by Visitor Numbers Presented to: Sarah Gehring Missouri Department of Agriculture Prepared by: Carla Barbieri, Ph.D. Christine Tew, MS candidate April 2010 University
Committee. Presentation Outline
 CW-33-15 11/9/2015 Community and Corporate Services Committee November 10, 2015 1 Presentation Outline Background Vision and Objectives Study Process and Timeline Public and Stakeholder Engagement Organization
2009 Muskoka Airport Economic Impact Study
 2009 Muskoka Airport Economic Impact Study November 4, 2009 Prepared by The District of Muskoka Planning and Economic Development Department BACKGROUND The Muskoka Airport is situated at the north end
Cooloolabin Dam Recreation Management Discussion Paper. November 2013
 Cooloolabin Dam Recreation Management Discussion Paper November 2013 Contents November 2013... 1 Background... 3 Overview of Cooloolabin Dam... 6 Weed Management... 7 Cultural Heritage... 7 Commercial
Longmont to Boulder Regional Trail Jay Road Connection DRAFT FINAL REPORT
 Longmont to Boulder Regional Trail Jay Road Connection DRAFT FINAL REPORT December 2018 Project Summary Boulder County, Colorado, in partnership with the City of Boulder, is evaluating options for multi-use
Thai Airline Passengers' Opinion and Awareness on Airline Safety Instruction Card
 1 Thai Airline Passengers' Opinion and Awareness on Airline Safety Instruction Card Chantarat Manvichien International College, Suan Sunandha Rajabhat University, Thailand Chantarat.ma@ssru.ac.th Abstract
Proposal to Redevelop Lower Kananaskis River-Barrier Lake. Bow Valley Provincial Park. Frequently Asked Questions
 Proposal to Redevelop Lower Kananaskis River-Barrier Lake Bow Valley Provincial Park Frequently Asked Questions What is being proposed? What are the details of the proposal? Where is the project area located?
Planning Future Directions. For BC Parks: BC Residents' Views
 Planning Future Directions For BC Parks: BC Residents' Views Summary Report Ministry of Water, Land and Air Protection Province of British Columbia April, 2002 National Library of Canada Cataloguing in
The Design of Nature Reserves
 The Design of Nature Reserves Goals Maintenance of MVP s for targeted species Maintenance of intact communities Minimization of disease Considerations of reserve design 1. Disturbance regime Fire Insect
Steps in the Management Planning Process
 Steps in the Management Planning Process Developing a management plan for Kalamalka Lake Park will follow a multi-stage process. The planning process for this park is currently in the Draft Management
Good Neighbour Guide A guide to being a good neighbour in Peachland
 District of Peachland Good Neighbour Guide A guide to being a good neighbour in Peachland 1 Introduction to the Guide Good neighbours make great neighbourhoods. We each play a role in enhancing our neighbourhoods
Clearwater Lake Provincial Park. Draft Management Plan
 Clearwater Lake Provincial Park Draft Management Plan Clearwater Lake Provincial Park Draft Management Plan Table of Contents 1. Introduction... 3 2. Park History... 4 3. Park Attributes... 4 3.1 Location/Access...4
Northeast Quadrant Distinctive Features
 NORTHEAST QUADRANT Northeast Quadrant Distinctive Features LAND USE The Northeast Quadrant includes all the area within the planning area that is east of Interstate 5 and to the north of State Route 44.
SMS HAZARD ANALYSIS AT A UNIVERSITY FLIGHT SCHOOL
 SMS HAZARD ANALYSIS AT A UNIVERSITY FLIGHT SCHOOL Don Crews Middle Tennessee State University Murfreesboro, Tennessee Wendy Beckman Middle Tennessee State University Murfreesboro, Tennessee For the last
WildSafeBC Annual Report 2014 Sunshine Coast. Photo: Peter Sulzle
 WildSafeBC Annual Report 2014 Sunshine Coast Photo: Peter Sulzle Executive Summary The WildSafeBC program aims to reduce human-wildlife conflict throughout British Columbia. The program was delivered to
Sawtooth National Forest Fairfield Ranger District
 United States Department of Agriculture Forest Service Sawtooth National Forest Fairfield Ranger District P.O. Box 189 Fairfield, ID. 83327 208-764-3202 Fax: 208-764-3211 File Code: 1950/7700 Date: December
BRIEFING Subject: 2017 Visitation Initiatives
 BRIEFING Subject: 2017 Visitation Initiatives Presented to: Council Submitted by: Adrian Field Date: June 12, 2017 Agenda #: 7.6 This report is submitted for council s information. BACKGROUND Reason for
Results from a February 2018 community survey of Boulder County residents about urban black bears. by: Melanie Hill University of Colorado Boulder
 Results from a community survey of Boulder County residents about urban black bears. by: Melanie Hill University of Colorado Boulder What is your age? 12% 4% 9% 17% 21% 19% 18% n=362 17 or younger 18-24
Map 1: 2012 Zoning, and some main trails ideas
 Map 1: 2012 Zoning, and some main trails ideas White dashed lines are quick ideas for a walking network. The yellow sections are areas of improvement or things that need addressing PE TKC C-28B YCCMA PS
WildSafeBC Annual Report 2018
 WildSafeBC Annual Report 2018 District of Invermere Prepared by: Jenna Milne, WildSafeBC Community Coordinator 0 Executive Summary The WildSafeBC Community Coordinator (WCC) worked closely with Groundswell
City of Durango 5.8 FUNDING TRAILS DEVELOPMENT
 5.8 FUNDING TRAILS DEVELOPMENT The City has been successful in establishing dedicated local funding sources as well as applying for grants to develop the City s trail system, having received nearly $2.4
Theme: Predominately natural/natural appearing; rustic improvements to protect resources. Size*: 2,500 + acres Infrastructure**:
 Recreation Opportunity Spectrum (ROS) Classes The Recreation Opportunity Spectrum (ROS) provides a way to describe the variations in the degree of isolation from the sounds and influences of people, and
WildSafeBC Annual Report 2015 Pacific Rim. Prepared by: John Platenius Pacific Rim Community Coordinator October 29 th, 2015
 WildSafeBC Annual Report 2015 Pacific Rim Prepared by: John Platenius Pacific Rim Community Coordinator October 29 th, 2015 Executive Summary The WildSafeBC program is managed by the British Columbia Conservation
Pinawa Provincial Park. Draft Management Plan
 Pinawa Provincial Park Draft Management Plan Pinawa Provincial Park Draft Management Plan Table of Contents 1. Introduction... 3 2. Park History... 3 3. Park Attributes... 4 3.1 Natural... 4 3.2 Recreational...
Wildlife Management from a Regulatory Perspective
 Wildlife Management from a Regulatory Perspective Description Operators of aircraft have a reasonable expectation that any wildlife hazard which may exist at an airport they use will be managed to a level
Photopoint Monitoring in the Adirondack Alpine Zone
 Photopoint Monitoring in the Adirondack Alpine Zone Julia Goren (PI) and Seth Jones Adirondack High Peaks Summit Steward Program Adirondack Mountain Club summit@adk.org PO Box 867, Lake Placid, NY 12946
Recreation Opportunity Spectrum for River Management v
 Recreation Opportunity Spectrum for Management v. 120803 Introduction The following Recreation Opportunity Spectrum (ROS) characterizations and matrices mirror the presentation in the ROS Primer and Field
Proposal to Redevelop Lower Kananaskis River-Barrier Lake. Bow Valley Provincial Park
 Frequently Asked Questions Proposal to Redevelop Lower Kananaskis River-Barrier Lake Bow Valley Provincial Park Frequently Asked Questions What has been decided? What are the details of the plan? What
Appendix A BC Provincial Parks System Goals
 Appendix A BC Provincial Parks System Goals The British Columbia Provincial Parks System has two mandates: To conserve significant and representative natural and cultural resources To provide a wide variety
Pillar Park. Management Plan
 Pillar Park Management Plan January 2014 Pillar Park Management Plan Approved by: Jeff Leahy Regional Director Thompson Cariboo Region BC Parks January 9, 2014 Date Brian Bawtinheimer Executive Director
PREFACE. Service frequency; Hours of service; Service coverage; Passenger loading; Reliability, and Transit vs. auto travel time.
 PREFACE The Florida Department of Transportation (FDOT) has embarked upon a statewide evaluation of transit system performance. The outcome of this evaluation is a benchmark of transit performance that
As outlined in the Tatshenshini-Alsek Park Management Agreement, park management will:
 Management Strategy General Strategy The priority management focus for the park is to ensure that its internationally significant natural, cultural heritage and recreational values are protected and that
2015 British Columbia Parks. Visitor Survey. Juan De Fuca Park. China Beach
 2015 British Columbia Parks Visitor Survey Juan De Fuca Park China Beach 1 Contents Introduction 3 Methodology 3 Limitations 3 How this report is organized 3 Part 1 - Visitor Satisfaction 4 Part 2 - Visitor
Revelstoke Bear Hazard Assessment and Bear Human Conflict Management Plan
 Revelstoke Bear Hazard Assessment and Bear Human Conflict Management Plan Prepared for: Revelstoke Bear Aware Society May 2009 Updated 2013 Prepared by: Penny Page-Brittin, HB.Sc. Revelstoke Bear Aware
Business Growth (as of mid 2002)
") Page 1 of 6 Planning FHWA > HEP > Planning > Econ Dev < Previous Contents Next > Business Growth (as of mid 2002) Data from two business directories was used to analyze the change in the number of businesses
Page 1 of 6 Planning FHWA > HEP > Planning > Econ Dev < Previous Contents Next > Business Growth (as of mid 2002) Data from two business directories was used to analyze the change in the number of businesses
Participant Presentations (Topics of Interest to the Meeting) GASP SAFETY PERFORMANCE INDICATORS. (Presented by the Secretariat) EXECUTIVE SUMMARY
 GASP SAFETY PERFORMANCE INDICATORS. (Presented by the Secretariat) EXECUTIVE SUMMARY") PA RAST/31 WP/03 19/02/18 Thirty First Pan America Regional Aviation Safety Team Meeting (PA RAST/31) of the Regional Aviation Safety Group Pan America (RASG PA) South Florida, United States, 20 to 22
PA RAST/31 WP/03 19/02/18 Thirty First Pan America Regional Aviation Safety Team Meeting (PA RAST/31) of the Regional Aviation Safety Group Pan America (RASG PA) South Florida, United States, 20 to 22
Evaluating Lodging Opportunities
 Evaluating Lodging Opportunities This section explores market opportunities for new lodging accommodations in the downtown area. It will help you understand travel and visitation trends, existing competition,
State Park Visitor Survey
 State Park Visitor Survey Methods, Findings and Conclusions State s Department of Recreation, Park and Tourism Management surveyed state park visitor and trip characteristics, and collected evaluations
Section 61 Recreational Vehicle Park / Campground (Bylaw No. 2012/10)
") Part 7 General Regulations Section 61 Recreational Vehicle Park / Campground (Bylaw No. 2012/10) 61.1 A comprehensive site plan shall be provided to the satisfaction of the Development Authority that shows
Part 7 General Regulations Section 61 Recreational Vehicle Park / Campground (Bylaw No. 2012/10) 61.1 A comprehensive site plan shall be provided to the satisfaction of the Development Authority that shows
STONE MOUNTAIN PROVINCIAL PARK Purpose Statement and Zoning Plan
 1 STONE MOUNTAIN PROVINCIAL PARK Purpose Statement and Zoning Plan Stone Mountain Provincial Park is situated 140 km west of Fort Nelson at Kilometre 595 of the Alaska Highway. The 25 690 ha park is located
Birch Point Provincial Park. Management Plan
 Birch Point Provincial Park Management Plan 2 Birch Point Provincial Park Table of Contents 1. Introduction... 3 2. Park History... 3 3. Park Attributes... 4 3.1 Natural... 4 3.2 Recreational... 4 4. Park
THAT the Board approve the final proposed concept plan for the Jericho Marginal Wharf site as shown in Figure C-4 of Appendix C.
 Date: January 17, 2012 TO: Board Members Vancouver Park Board FROM: General Manager Parks and Recreation SUBJECT: Jericho Marginal Wharf Phase 2 Concept Plan RECOMMENDATION THAT the Board approve the final
MUNICIPALITY OF ANCHORAGE
 MUNICIPALITY OF ANCHORAGE ANCHORAGE PARKS & RECREATION Memorandum PRC 08-56 DATE: 5 August 2008 TO: FROM: SUBJECT: Parks & Recreation Commission Holly Spoth-Torres, Park Planner PRC 08-56 Far North Bicentennial
K SIGNAGE & TRAFFIC CONTROL. Table of Contents
 Table of Contents K1. ACCOMMODATION OF TRAFFIC... 1 K2. MINIMUM CONSTRUCTION SIGNING... 1 K3. SUBDIVISION SIGNS... 2 K4. TRAFFIC CONTROL DEVICES... 2 K4.1 Traffic Signs Regulations... 2 K4.2 Materials...
Risk Assessment in Winter Backcountry Travel
 Wilderness and Environmental Medicine, 20, 269 274 (2009) ORIGINAL RESEARCH Risk Assessment in Winter Backcountry Travel Natalie A. Silverton, MD; Scott E. McIntosh, MD; Han S. Kim, PhD, MSPH From the
PROPOSED PARK ALTERNATIVES
 8 Chimne y Rock State Park M a ster Pl an 2011 PROPOSED PARK ALTERNATIVES Introduction Three different park development concepts were prepared and presented to the citizens of North Carolina through a
Submission on the Tukituki Catchment Proposal: EPA reference numbers; NSP 13/ , NSP 13/ , NSP 13/ , NSP 13/02.
 Hutt Valley Tramping Club PO Box 30 883 LOWER HUTT 5045 Tukituki Catchment Proposal Environmental Protection Agency Private Bag 63 002 WELLINGTON 6140 29 July 2013 Submission on the Tukituki Catchment
Global Tourism Watch China - Summary Report
 Global Tourism Watch 2010 China - Summary Report Table of Contents 1. Research Objectives... 1 2. Methodology... 1 3. Market Health & Outlook... 1 4. Unaided Destination Awareness... 2 5. Canada s Value
Three Sisters Campground Redevelopment
 Three Sisters Campground Redevelopment In 2013 heavy rains in southern Alberta caused flooding along the Bow River that resulted in damage to facilities in the Kananaskis Region including the Three Sisters
Nov. 19 th Public Workshop Summary
 On November 19 th, more than 60 community members attended an Open Space Matters workshop at the Linen Building in downtown Boise for over two hours. Participants learned about reserves, discussed the
METROBUS SERVICE GUIDELINES
 METROBUS SERVICE GUIDELINES In the late 1990's when stabilization of bus service was accomplished between WMATA and the local jurisdictional bus systems, the need for service planning processes and procedures
Spatial Distribution and Characteristics of At-Risk Species in the Southeast U.S.
 Nicholas Institute for Environmental Policy Solutions Scoping Document Part 2 Exploratory Analysis of Characteristics and Trends of At-Risk Species in the Southeast U.S. Spatial Distribution and Characteristics
VERP Assignment for Ft. Fisher State Recreation Area
 Case Background VERP Assignment for Ft. Fisher State Recreation Area Fort Fisher State Recreation Area is a jewel of the southeastern coast of North Carolina. Comprised of a wide variety of maritime ecosystems,
TONGASS NATIONAL FOREST
 TONGASS NATIONAL FOREST UNITED STATES DEPARTMENT OF AGRICULTURE-FOREST SERVICE Contact: Dennis Neill Phone: 907-228-6201 Release Date: May 17, 2002 SEIS Questions and Answers Q. Why did you prepare this
Ministry of Parks, Culture and Sport. Plan for saskatchewan.ca
 Ministry of Parks, Culture and Sport Plan for 2018-19 saskatchewan.ca Table of Contents Statement from the Minister... 1 Response to Government Direction... 2 Operational Plan... 3 Highlights... 7 Financial
TRAILS WHERE TO FIND TRAILS IN NOVA SCOTIA
 TRAILs SIGNAGE Know the Signs............................ 44 WHERE YOU CAN RIDE Roads and Highways........................ 46 Designated Trails........................... 47 Established Trails...........................
NAPA VALLEY VISITOR INDUSTRY 2014 Economic Impact Report
 NAPA VALLEY VISITOR INDUSTRY 2014 Economic Impact Report Research prepared for Visit Napa Valley by Destination Analysts, Inc. Table of Contents SECTION 1 Introduction 2 SECTION 2 Executive Summary 5 SECTION
SOUTH INTERCHANGE AREA
 Santaquin City General Plan 1 Location and Characteristics The South Interchange Area of Santaquin is located west of Interstate 15 and south of 500 South (Figure 1). It includes properties already annexed
CENTRAL OREGON REGIONAL TRANSIT MASTER PLAN
 Central Oregon Regional Transit Master Plan Volume II: Surveys and Market Research CENTRAL OREGON REGIONAL TRANSIT MASTER PLAN Volume IV: Service Plan Appendices A-B July 213 Nelson\Nygaard Consulting
The Impact of Camping on Soil Properties in the Strawberry Lake Campground in the Turtle Mountains
 The Impact of Camping on Soil Properties in the Strawberry Lake Campground in the Turtle Mountains Eric C. Brevik Department of Natural Sciences Dickinson State University Background Previous studies have
MANAGEMENT DIRECTION STATEMENT
 Skeena District MAAGEMET DIRECTIO STATEMET July, 2000 for Driftwood Canyon Provincial Park Ministry of Environment Lands and Parks BC Parks Division i Table of Contents Driftwood Canyon Park Approvals
Keeping Wilderness Wild: Increasing Effectiveness With Limited Resources
 Keeping Wilderness Wild: Increasing Effectiveness With Limited Resources Linda Merigliano Bryan Smith Abstract Wilderness managers are forced to make increasingly difficult decisions about where to focus